Total Massive Pump or Massive Dump ? 🤔Hello Guys ❤️
Hope all of you are good.
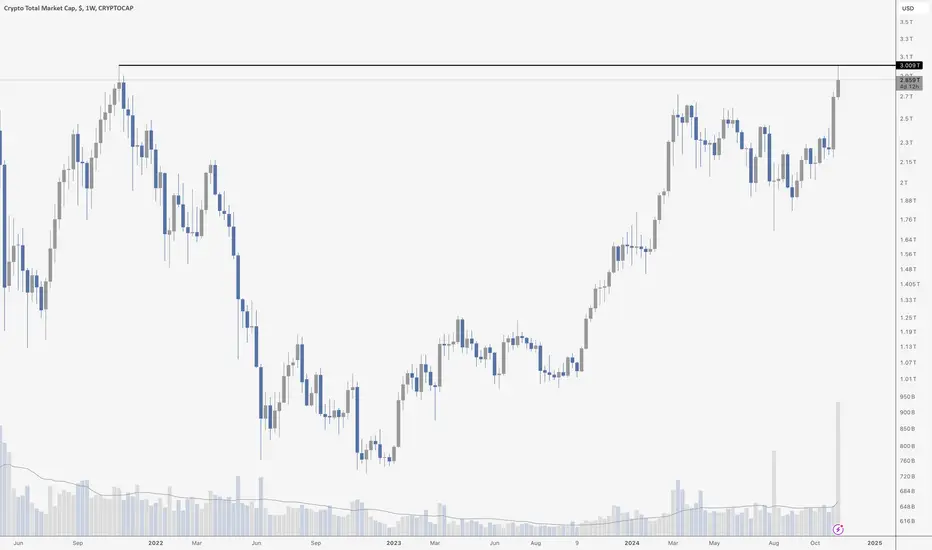
As u see on my chart , Total is inside this stubborn channel for a long time , failed to break it out about 4 times in the last year.
Also we informed a pattern called Double top till now.
***Breaking out of this channel will be good for the market and we won't stop before achieving the target 1.60T but first we need to break the upper nick line at 1.26T
****if the double top pattern was correct and worked this will be very bad for BTC & the whole market and it will down at least to the lower nick line at 974B (The middle of the channel also) and if we broke it down will down to 690B or anywhere in the bottom of the channel.
Only take care and watch out this chart to know what will happen.
Next days will be very interesting to the market.
I hope for all of you big profits and happy life.
I am just sharing my thoughts with u.
It is not a financial idea and plz DYOR.
TOTAL trade ideas

Crypto Total Market Cap targetsTotal I track since 2023. By my idea top of the market was in 2021 spring
I use my fib and mark green block zone for accumulation CRYPTOCAP:TOTAL
Now all money almost in BTC and we swept ath total.
Now is time to send it to two next levels, it's hard to say about timing but most likely top for btc and alt season will be spring - autumn 2025.
Around 5 Trillion conservative targets for capitalisation
Based on Trade on indicator you can track how it goes on W timeframe!
I use my custom indicator set for more factors in my analysis. April correction playing out good, same like summer 2022 bottom.
July and August we saw the buy back signals!
Hope you enjoyed the content I created, You can support with your likes and comments this idea so more people can watch!
✅Disclaimer: Please be aware of the risks involved in trading. This idea was made for educational purposes only not for financial Investment Purposes.
---
• Look at my ideas about interesting altcoins in the related section down below ↓
• For more ideas please hit "Like" and "Follow"!

TOTAL CRYPTO MARKET CAP BULLISHYup Its bullish as tattas. going to be watcching the show press play in 6 months from now and see what we see.

Why we are not going to 100k in BTC?It is because we are at 3T resistance once clear we can see 100k and we need some more good news to move forward. For now we just need to hold this important level.
ALT season will start when BTC dominance will drop to 50%.

Total market warningHello guys. Chart shown for you. As you see index touched ATH then rejected so far
I think market needs a break and correction.
Support Levels shown for you for better trading
Always DYOR

TOTAL crypto market cap VS Bitcoin dominanceIf history repeats itself, bitcoin dominance should decrease in the coming days and altcoins will outperform the king CRYPTOCAP:BTC
What do you think?

TOTAL - Short Term Top?The FOMO in the market is real, but looking at the charts this seems to be a place to see some "take profit" occurring. Total crypto marketcap is fighting the $3T level. If we can break above we can flip that into a new support level, but for now do not be surprised if we see a pullback from here.

TOTAL to 7 to 10TWith BINANCE:BTCUSDT at a new ATH of 90k it brings up the rest of the market and raises all boats.
We are still in November of 2024 right after the election. Lots of people remained sidelined and lots of capital is sidelined. Come next year all the investments that are up on the year that have been invested in equities and any other assets will get their appreciation reinvested at an alarming rate due to it being the beginning of the year.
I say that to say this: things could get very silly in crypto and a 7 to 10 trillion TOTAL crypto marketcap is a very real possibility in the next 1-2 years.
It is not a guarantee but the time to position into risk assets is now quite frankly. It was a better time to position in back during the summer but now we have a clearer vision we are headed down with the election behind us.
I wish anyone investing and trading a great end of the year and an even better next year.
Never get liquidated. Keep clicking.

TOTAL CRYPTO MARKETCAP HITS ATHThis is not an altcoin chart, per se, but it is very telling. This is the Total Marketcap of Crypto, including both Bitcoin and Ethereum. As you can see, this reached the all time high from the previous bull market, which was hit in November of 2021 - right around $3T.
We have not even STARTED this cycle yet (assuming we get one), and the entire market size is already equivalent to that peak. Imagine what happens when this breaks out…
Be patient, it is coming.
Price action on the TOTAL chart now comfortably above the c&h Price action is now knocking on the door of 3 trillion for the total crypto market cap. We can see also that now that price action is reasonably above the rimline of this massive cup and handle pattern, and has also closed a weekly candle above it now as well, that we are likely to soon validate the breakout of this pattern and star climbing towards its breakout target of 4.6 trillion. I think Brad Garlinghouse was anticipating the total market cap nearing 5 trillion by end of 2024 and that target is not that far off. I will link some previous total market cap charts below so you can see other macro patterns we are also heading towards with an even higher target than this cup and handle. *Not financial advice*

Theres no new money.. its the same money sloshing aroundBearish divergences everywhere, like last time.
Trump led you fools to the slaughter. But you deserve it, so be it.

Clockwork OrangeThe Eudollar is more robust than any US or Fed forces.
Mycrostrategy to become Bitcoin World Bank.
The Fed is undershooting, and they know it.
There are so many gray swans ready to turn black.
The Repo and SOFR spread outliers are watched closely by Hawks like me.
Over 100 US regional banks are on the verge of collapsing.
China's stimulus is not working, smoke and mirrors.
Get ready while drip-buying the TLT and EDV.
Buy a basket of Call options on the TLT.
PEPE is Bitcoin's heartbeat.
DOGE, X and Telsa are now Nazi symbols.
Only a war can save the fiat standard from here.
Stay safe out there.
OMS

TOTAL CRYPTO TICKER - moving average linesAll the moving average lines are in order and underneath the price of cryptocurrency, bitcoin too. If so, the signal would mean the price will maintain and continue forth onward to the new year. The potential for the market cap of cryptocurrency to double may be in the cards, the loftiness of trillions of dollars swelling cryptocurrency is a much tougher sell than Bitcoin, ideally. For all those active investors and active social viewers this post is of the utmost simplicity based on the simple method of keeping ideas useful.

4 Years Or Eternal Growth? The Trump Bull-Market! (8.88-$11.11T)This week the TOTAL index chart saw the biggest volume session, ever, in its whole history, and it is only Monday. We are witnessing something extra-ordinary.
Think of instead of a 2025 bull-market, a bull-market that can last 2 years, 3 years or even 4 years or more; all the time that Trump is in the white-house. We will call this the "Trump Bull-Market."
Trump is not even president yet and the entire world is feeling the positive heat; Bitcoin is hitting new ATHs, the stock market, after being on the verge of the biggest crash in its history, reverse its course and started to grow. The Altcoins are set to boom... I don't know about the conventional markets, but Cryptocurrency is set to enter the most bullish situation in its history. The Cryptocurrency market is set to be worth more than 8.88 Trillion USD or even 11.11 Trillion USD in the coming years, this will be the Internet boom 2.0.
The total Cryptocurrency market capitalization's ATH stands at 3T, we are only some $70,000,000 away from this mark, soon, a new ATH will hit. The week is young and we have the highest volume ever, by the end of the week, we don't know how far up it can go.
Think of Bitcoin being cheap at $80K. Think of Bitcoin trading easily beyond $220,000 and growing continuously for years... If the Cryptocurrency market can grow when the entire world was against it, how good can it get with favorable legislations? With a friendly US government! We don't know, but we know about the Internet and how that ended; Cryptocurrency is the future of technology, of finance; it is the future of communication, the future of exchange.
Prepare for unlimited growth.
Namaste.

TOTAL - $3T soon...Very important to see how the market reacts at the $3T level. Once that is broken the expansion phase will begin.

Total Market CapTotal market cap parbolic curve is also at the beginning of the epic rise phase!
Historical levels are being loaded for #Bitcoin #Ethereum and #Altcoins 🌊⏳

MARKETS week ahead: November 11 - 17Last week in the news
Regardless of the FOMC meeting and rate cut for another 25 bps, still the major event during the week was related to the US Presidential elections. It seems that investors were more than satisfied with the American votes, as almost all markets finished the week in green, few of them with fresh new all time highest levels. Equity markets were the first to react to election results, by pushing the S&P 500 to new ATH at the level of 6.010. Another market which significantly gained with the election was the crypto market. BTC passed the level of $80K, reaching another all-time highest level. On news that a new US President might influence peace negotiations in the Middle East, the price of gold slowed down and reverted back toward the $2,65K level. The US Treasury bonds were the only to stay resilient, and waited for the FOMC decision in order to return back toward the 4,30 level.
The FOMC members cut interest rates by another 25 bps at their meeting held on Thursday. Speaking about the state of the economy, Fed Chair Powell noted that “The Committee judges that the risks to achieving its employment and inflation goals are roughly in balance”. This sentence summarizes the current view of FOMC members on the state of the US economy. Although this was an expected move, still the after-the meeting speech of Fed Chair Jerome Powell was marked with a question whether he will resign if newly elected US President Trump requests from him such a move. He clearly stated that he will not resign and soon after closed the Q&A session.
Another topic that is emerging among Fed Governors is what will happen if the US imposes high tariffs on imported goods, as newly elected President Trump was mentioning in his presidential campaign? This question was commented by the Minneapolis Fed President Kashkari, who noted that such an action could worsen a long term inflation outlook. Economists are noting that such a course of action might impact the Fed to increase interest rates again, if inflation needs to be kept under control.
While the Western news are speaking about future potential import taxes for foreign goods, which might be implemented by the new US government, China continues to stay focused on its own economy. News have reported that the China government is planning a five-years package around $1,4 trillion in yuan equivalent. The aim with the latest measure is to tackle the Government debt, while there has been announcements that more of aid for the economy might come during the following year. The package should be released mainly through a debt-swap program, however, investors did not perceive such an approach to the current Government problems. The IShares China Large Cap exchange traded fund, was down by nearly 5% on the news.
Crypto market cap
After the US Presidential elections during the previous week, it seems like there is a new dawn for the crypto market. Namely, as newly elected President Trump was highly pro-crypto during the presidential election, so the markets are currently expecting that the crypto ecosystem will finally have full support from the US government for its further expansion. The market reacted in line with this sentiment, pushing the crypto market and BTC to the new historically highest levels. Total crypto market capitalization was increased by 18% during the whole week, adding more than $412B to the market value. Daily trading volumes were more than doubled from the week before, where it was traded around $278B on a daily basis. Total crypto market capitalization increase from the end of the previous year currently stands at $1.053B, which represents a 64% surge from the beginning of this year.
It was one of the best weeks on the crypto market, certainly not recently seen. All coins gained during the week, with BTC leading the market. Incredible gains were also part of this weekly story. BTC gained the most of all coins, adding more than $222B to its market cap, increasing it by 16.1%. During the week, BTC also recorded a new all time highest value above the $80K. ETH was in second place with an inflow of $82.6B to its market cap, increasing it by 27.5%. ETH managed to cross the $3K psychological level. DOGE was a surprise of the week, with an increase in the market cap of $17.1B or 73%. More than $ 8B in value managed to add ADA and BNB, where ADA increased its market value by 66.2% while BNB surge was 10.2%. A market favorite Solana should also be mentioned as the coin increased its market cap by $22.1B or 28.44%. The list of gaining coins could continue, as weekly gains were quite significant between 20% and 30%. Only rare coins managed to add below or up to 10% during the week.
Coming to coins in circulation, the situation was relatively stable with the exception of a few coins with higher gains and decrease of circulating coins. Maker gained the most new coins as they were increased by 0.7% on a weekly basis. Filecoin, Polkadot, Solana and Stellar added 0.2% of new coins, each. Tether increased the number of coins on the market by 2.2%, increasing by this percentage its total market cap. On the opposite side was standing Polygon, which decreased its number of circulating coins by 1.9%, while Algorand pulled 0.8% of coins in circulation.
Crypto futures market
The crypto futures market fully reflected developments on the spot market during the previous week. Both BTC and ETH futures significantly gained during the week. BTC futures gained more than 10% for all maturities, while ETH futures surged by around 17%. BTC futures maturing in December this year ended the week at $77.935, while those maturing in December 2025 closed the week at $85.020. March 2026 was closed even higher, at $86.835 which is the highest ever level reached for BTC.
Similar situation was with ETH futures, where almost all maturities crossed the psychological $3K line. In this sense, December 2025 closed the week at $2.993, still 17.19% higher from the week before, while December 2025 was last traded at $3.207.

Provides analysis of cryptocurrency market cap (CRYPTOCAP)The red line shows the 50-week moving average, which appears to be a crucial support level for the overall trend. Historically, the market cap has respected this moving average, with upward momentum when trading above it.
This area acts as a strong support level, as it has historically provided a solid foundation for price recovery. The total market cap has rebounded from this level several times, indicating buyer interest.
This is a crucial resistance level, as the market has reversed from this area before. If the total market cap approaches this area, selling pressure may occur.
The white diagonal line shows a long-term ascending trendline, suggesting a steady upward trend since 2018. This line further strengthens the overall bullish trend, as long as the total market cap stays above it.
Currently, the total market capitalization is testing the 2.728T level, which is close to recent highs, with a possible bounce if it breaks above the red resistance zone.
The overall outlook appears to be bullish, but it is essential to keep an eye on any significant moves around the resistance zone and the 50MA, as these will influence the long-term trend.
Disclaimer: This analysis is for informational purposes and is not financial advice. Always stay updated with market movements and adjust your trading strategies as needed.
You can DM us for information on any other coin.
@Peter_CSAdmin

TOTAL market cap chart screaming buy signalIf you're not long crypto I don't even know what the heck you're doing, if you call yourself a financial speculator...
Last time a signal fired in this timeframe it was in October 2023, at 1.15T market cap.
Upside to 5 to 9 trillion by July 2025 is in the cards.
Get long crypto!
Best of luck!
Cheers,
Ivan Labrie.

Crypto bear marketCrypto entered a bear market in July when it's total market cap dropped - 20%. TOTAL March high of 2.721T down to the August low of 1.691T was - 38%, but it bounced back up. So now, heading into September, we are only down - 25% at 2.036T. However, as a trader we can use some of the key levels that have printed on the chart to go long or short according to positioning. I see 5 main levels to pay attention to:
1) 2024 high = 2.721T
2) 2024 - 20% = 2.169T
3) August low = 1.691T
4) Down trend channel top = 2.314T
5) Down trend channel bottom = 1.868T
TOTAL has made lower lows and lower highs since March. The strongest trend to trade long or short off of since March is to go long crypto off TOTAL down trend channel bottom in green and go short off TOTAL down trend channel top in red. Anything in between is not high probability. But, also now that we have a confirmed crypto bear market printed on the chart, the 2024 - 20% = 2.169T level will act as serious resistance too.
A bear market is a downward trend in financial markets, indicating a weakening economy and a loss of investor confidence. Generally, a market is considered a bear market when prices have declined more than 20%. Bear markets can be as short as a few weeks or as long as a several years. Until there is confirmation of TOTAL breaking out of the crypto bear market, we have to accept the fact that we are in it for an unknow period of time.

TOTAL cryptocap chart about to complete the handle on its c&h We can see price action is breaking up fro a bullflag that has a target of 3.33 trillion. In doing so we should also validate the breakout of the cup and handle pattern which will give ita breakout target around 4.6 trillion or so. Price action is currently very close to retesting the green rimline of the cup and handle pattern and completing the handle. If we were to look at the daily, this pupcoincided precisely with the daily chart’s recent golden cross(not shown here) *not financial advice*

Whale Alert! Transactions Dynamics, 2025 Bull-Market, Patience &Before the US Presidential elections, all the whale transactions within the Cryptocurrency market had bearish connotations. I was seeing large amounts of Crypto, mainly Bitcoin and Ether, being transferred across exchanges. It is said that when large amounts of Crypto is transferred, it is in order to sell and thus have bearish connotations. This dynamic was on for a while.
After the elections, things changed. First, Tether Treasury minted 1Billion and then it did it again, today. Large amounts of USDT and USDC started to move across whale accounts and exchanges, this tend to be seen as bullish and has bullish connotations. Even now large amounts of stable coins is entering the exchanges and large amounts of Crypto (BTC, ETH and others) is leaving exchanges, the dynamics changed.
But, compared to past market cycles, the bearish transactions are also present in-between the bullish ones and we see more and more ancient (satoshi-era) Bitcoin wallets waking up.
So we are seeing a mix of bearish and bullish transactions being executed by the whales.
The general sense I am getting from these transactions is that something big is about to develop and it ain't a new ATH. A new All-Time High has been hit already on Bitcoin, let's see what we get next.
The war has been cancelled and this is awesome, but it seems that a major market flush has not been cancelled, let's consider the TOTAL chart next.
First, super high volume for the bulls 6-November. Then a third strong lower high in a row. The volume is super high but lower than 5-August and lower than 6-March. (Bearish.)
TOTAL Cryptocurrency continues to point down. The action we are seeing across Bitcoin is extraordinary and is not reflecting on the rest of the market, it seems it will soon end.
I was considering a different scenario, what if the Altcoins are just behind and will soon breakout? As some are doing and already did; but, I continue to look at hundreds of charts and they are pointing lower, the bounce (pull-back) is over and next, down we go!
Imagine/think/feel/listen, if we are about to experience the biggest bull-market ever in 2025, when will the correction take place?
1) Will the market rally straight up for 3 more months and end in March 2025?
2) Or will the market correct to set the stage to grow for more than 12 months straight?
I am going with #2.
Bull-market year tends to be bull-market year; growth, growth, growth. For sustained growth to be possible, it tends to start out of a market low. After three months of growth, a correction is due regardless of the short-term, mid-term or long-term, the market moves in waves.
We are due for a correction, and we will be 100% bullish at the next support focused on the long-term.
Now, there are different pairs and different charts; some are trading low already and these can be bought. Those trading high and at resistance, should be approached with caution because people are really smart.
Only beginners would buy at the top, and the majority of the players approaching the market now have some experience and this will do what is right to win in the long-term.
The beginners buying at the top, these are the ones that will have to go through the first lesson, they will have to wait just like we had to wait when we started trading back in those days.
We noticed the market because of the new All-Time High. We buy in expecting forever growth (March 2024, November 2021, December 2017, 2014), but instead of growth, the market enters a major correction and we learn the first and most basic lesson, you can never buy at the top.
Patience is key. The market is not going away.
If we are bullish for the whole of 2025, there is plenty of time to buy and trade.
This is not financial advice.
Your support is appreciated.
You are reading Alan Santana.
Namaste.

Crypto Total Market Cap, $Hello everyone,
Small daily chart.
Break of the trend line.
I indicated the next tp in yellow on the chart.
On the chart the 3 accumulation zones.
Make your opinion, before placing an order.
► Thank you for boosting, commenting, subscribing!
