2024: The End Of A Cycle | 2025: A New BeginningThe reason why you are seeing mentions of "no more SHORTs," is not only because I am turning bullish but because we are reaching the end of a cycle.
The Cryptocurrency market has been bearish since March 2024, invariably. It has been going down. This chart is absolute proof of this statement, but it won't go down forever, in fact, the bearish cycle is coming to an end.
The TOTAL index closed red two consecutive weeks. The first red week produced a minor high and all was good; the second week, last week, produced a strong bearish candle and this candle closed below the previous week bearish close, producing a very strong bearish signal. This type of signal is the one that I am describing as "there is no going back."
The good news is that this is likely the end. Once the correction low is in, TOTAL (the entire Cryptocurrency market) will recover and it will recover really strong. The market moves in cycles and it fluctuates between going down and going up. There are many variations between the pairs but the general bias is always the same.
For example, Bitcoin was growing strongly together with the rest of the market until March 2024. Even though Bitcoin hit a double-top recently, there is no new highs. Earlier this year and last year, we would see and experience a clear price advance with higher highs being hit every single day or week. The same for this index, before March 2024, notice the green arrow, higher highs... Higher and higher with force. After March 2024, lower highs and lower lows.
The whole lower highs and lower lows sequence will lead to a final flush. This final flush will produce the corrective phase bottom and from this bottom we go bullish; this bullishness is what we translate as growth. We will see a clear and undeniable sequence of higher highs and higher lows. This will happen long-term until a new All-Time High is hit as part of the major 2025 bull-market bull-run.
Prepare for the crash. It will be over fast. Those unaware as to what is happening will have to undergo some pain.
If you know what is coming, you have the option to prepare and make the best of this situation. You can do nothing, protect your capital or even profit from this drop.
Whatever you do, I am rooting for you; you have my unconditional support.
Thank you for reading.
I'll you see on the other side.
The end of the bearish cycle will usher in the start of the bullish phase.
Namaste.
TOTAL trade ideas

MARKETS week ahead: November 4 - 10Last week in the news
During the previous week a mixed US macro data and disappointing NFP data shaped the market sentiment. The US Dollar gained in strength as of the end of the week, pushing the price of gold toward the level of $2.735, after it reached the fresh new ATH supported by geopolitical tensions. The US Treasury yields continue to test higher grounds in a wake of the FOMC meeting in a week ahead, where 4,3% for 10Y US benchmark has been tested. The S&P 500 reverted a bit to the downside, closing the week at the level of 5.728. The weekly best performer was BTC, which was testing the level of $ 73K during the week.
The US Non-farm payrolls of 12K in October were the surprise of the week for the markets. Such a weak performance and a significant drop, analysts are contributing to the hurricane and syndicate strikes in the US during October. Still, the question is pending how this figure will affect the FOMC rate decision, scheduled for November 7th. At this moment, markets continue to expect a further 25 bps rate cut. The final FOMC perception of the macro developments will be known after the FOMC meeting on Thursday.
CNBC is reporting that the most famous investor, Warren Buffet continues to stockpile cash, which is currently estimated to be $325 billion. This was an increase in Q3, from $276 billion in Q2. The news is reporting that Berkshire Hathaway continues to sell stocks, first place Apple and Bank of America. There are also no buybacks of sold stocks, which might be repurchased when Buffet “believes that the repurchase price is below Berkshire's intrinsic value, conservatively determined.”.
News are reporting that the New York Stock Exchange announced plans to extend equities trading on Arca to 22 hours per day, five days a week. The NYSE came to this proposal considering a “growing demand for our listed securities around the world”. It is still under question whether this proposal will be adopted by NYSE.
NVIDIA will replace Intel stock in the Dow Jones Industrial Average index on November 8th. Nvidia shares surged by 170% during 2024, while the company surpassed $3,3 trillion in the market cap.
In its research, JPMorgan analysts noted that BTC daily mining revenue dropped in October for a fourth consecutive month. Analysts noted that BTC miners earned on average $41.800 per exahash per second of hashrate, which was 1% lower than in September. On a positive side is that transaction fees spiked to 60%.
Crypto market cap
Although BTC had its rally toward the higher grounds, overall the crypto market had a pretty mixed week. The forthcoming Presidential elections pushed the major coins to higher grounds, however, other altcoins did not perform in the expected manner. Total crypto market capitalization ended the week 2% higher from the week before, where a total $ 46B has been added to the crypto market cap. Daily trading volumes were increased to the level of $140B on a daily basis, from $99B traded a week before. Total crypto market capitalization increase from the end of the previous year currently stands at $641B, which represents a 39% surge from the beginning of this year.
BTC was the major coin which was driving the market to higher grounds. From a total market cap increase of $ 46B w/w, BTC added to its market cap a total $48B. This indicates that some other coins were driving the market cap to lower grounds. ETH was also traded with a positive weekly sentiment, adding to its cap almost $ 3B, increasing it by 1%. DOGE was another coin traded in a positive territory, increasing cap by $3.2B or 16.2%. From other altcoins Maker had solid performance, where the coin was traded higher by 11.7% w/w. Interestingly, Solana was traded with a negative sentiment, where $4.2B has been erased from its market cap, which decreased by 5.1%. BNB had a negative week, where its market cap dropped by $2.9B or 3.4%. Other altcoin lost somewhere between 1% and 5%.
There has been significantly increased activity with coins in circulation. BNB decreased the number of coins on the market by 1.3%. On the opposite side were Polygon, with an increase of circulating coins by 0.8% w/w, OMG Network increased the number of coins by 0.6%, while Filecoin and Maker added 0.4% new coins to the market.
Crypto futures market
The crypto futures market ended the week at a positive territory for both BTC and ETH. BTC short term futures were traded higher by 3.5%, while longer term ones were up by 3.6%. BTC futures maturing in December this year were last traded at $70.195, and those maturing a year later closed the week at $76.850. It should be noted that March 2026 was last traded at $78.490 which was its highest price in history.
ETH futures were traded around 1.6% higher for all maturities. Futures maturing in December closed the week at $2.554, and those maturing in December 2026 were last traded at $2.744. March 2026 closed the week at $2.794. This shows that investors are still not perceiving ETHs price above the $3K target.

Total to 2.5 trillion Possible deviation below trend line ?
Yes .
Probable ?
No.
I expect a bounce right now.

$TOTAL Market Cap 259 Day BREAKOUT!At last, the Crypto CRYPTOCAP:TOTAL Market Cap has a BREAKOUT from the 259 Day trend!
This was the lagging chart I was watching to confirm the next leg up in the bull market.
The 20DMA has also crossed the 200DMA for the first time in 12 months. This is a SUPER bullish signal, as you can see what occurred last time in October 2023.
With less than 1 week away until Donald Trump is declared President of the United States, and the FOMC announcing another round of rate cuts the following day, we can expect a lot of volatility in the market.
The 20DMA should act as a good support on the way up.
The final signal will be when the Fed announces they will stop selling securities from their balance sheet. This will signal a new round of quantitative easing, and complete risk-on.
Tick-tock MFers. Position accordingly!

what if?Interesting point on the 1 month RSI, every time we caught a bounce from this zone followed by a capitulation, what if this time too?

MARKETS week ahead: October 30 – November 3Last week in the news
Previous week was a relatively calmer one on financial markets. A strong sentiment for US inflation data was the one which pushed the US 10Y yields to the higher grounds, at 4,25%. The US Dollar continued to gain, while ongoing geopolitical issues impacted the price of gold to also end the week at historically highest levels, at $2.746. The US equity markets had a modestly mixed week, with the S&P 500 ending the week at the level of 5.808. The crypto market modestly pulled back, with BTC still holding around the $ 67K level.
A week after the ECB cut interest rates, as expected, the markets are reconciling what could be the next move of this Central bank. There has not been much information provided in an after the meeting speech of President Lagarde, except that “disinflation is on the track”. However, analysts are commenting that more has to be done in order to support the weakening EU economy. There has also been discussion that the decreased interest rates made an impact on modestly increased bank lending to corporates and the retail segment in September. Still, the increase of 0,7% for the year, analysts see as relatively low.
Tesla (TSLA) shares surged by a significant 22% during the single week, after the company posted better than expected Q3 results. This was the best weekly performance of the company for the last 16 years. TSLA posted a revenue of $25,18 billion, an increase of 8% on a yearly basis. Also, the company posted earnings per share of 78 cents, beating the analysts estimate of 58 cents.
News is reporting that the price of BTC was strongly impacted during the previous week by the story published by Wall Street Journal over a DOJ probe on Tether. As per report, the US officials are currently investigating the stablecoin issuer Tether, for its potential involvement in violation of anti money laundering laws and sanction rules. However, Tether Chief technology officer shortly commented on the news on platform X, noting that WSJ is “regurgitating old noise”.
In the wake of the US elections, market analysts were investigating the topic of potential impact of US tariffs on Chinese goods to China's economy. Analysts from the CITI Research commented that an introduction of tariffs of 60% might impact a severe drop in China's exports to the US, which now accounts for 14,8% of China's total exports, which would further impact a potential drop in the GDP of China by 2,4%. However, this was only a case study of researchers, while potential increases in tariffs are still only at the level of discussion among some US political figures.
Crypto market cap
The crypto market relaxed a bit during the previous week, after the week of significant move to the upside. Total crypto market capitalization decreased by 3% on a weekly basis, with a drop in market cap of $58B. Daily trading volumes were also modestly decreased to the level of $99B on a daily basis, from $112B traded a week before. Total crypto market capitalization increase from the end of the previous year currently stands at $595B which represents a 36% surge from the beginning of this year.
Majority of crypto coins were traded within a negative territory during the week, with only a few who finished the week in green. BTC slowed down during the week, ending it by 1.6% lower, decreasing its market cap by $22B. ETH followed the sentiment, with a decrease in value of 6.6% or $21B. BNB was also traded toward the downside, where the coin lost $2.2B in value, decreasing it by 2.5%. In relative terms, the few coins which lost the most were NEO, Theta and Maker, with a drop of more than 10%, Polygon was traded down by 14%. Interestingly, this week Solana was in the spotlight of the market, where the coin managed to end a week by 11.5% higher from the week before, adding $8.5B to its market cap. Tron was also among weekly gainers, with an increase in the market cap of 5.3%.
There have also been interesting developments with circulating coins. This week Polygon decreased the number of its coins in circulation by 2.2%. Maker also had a withdrawal of coins by 0.2% w/w. On the opposite side were Filecoin, Polkadot, Tether and XRP, which added 0.2% new coins to the market, each.
Crypto futures market
The crypto futures market reflected the developments from the spot market during the previous week. In this sense, BTC short term futures were traded lower by some 2% on average, while the longer term ones were holding below the 1%, almost flat on a weekly basis. BTC futures maturing in December this year were closed at $67.790, and those maturing in December 2025 were last traded at $74.135. March 2026 ended the week at $75.715. This was a positive signal from the futures market that investors still see the value in BTC in the long run.
ETH both short and long term futures were traded down by more than 5% for all maturities. December 2024 ended the week at the level of $2.517, while December 2025 was closed at $2.703. At the same time, futures maturing in March 2026 were last traded at $2.752, moving away from the $3K target.

CryptoMarket 📍 #CryptoMarket Quick Update
As previously mentioned, several factors could trigger a #BlackSwan event before the US elections, causing an average 35% drop across #altcoins💥. Large caps might decline 25-35%, while low caps could see drops of 40-60%. This could be a last shakeout before a real #Altseason begins. Stay ready and don't get scared!💪

The Psychology Of Trading: Advanced Course (Part 1)What are you looking for when you engage in the process we call trading? Are you in it for the money? Are you in it for learning, excitement or fun?
Are you aware of what you are dealing with?
What is this situation that we experience with the market that it tends to move contrary to anything we expect? We decide to buy and sure enough, the market goes down the next day. We've been holding for months and nothing happens, prices are going down and we cannot wait any longer to see everything go up. Somehow we give up, sell everything and the next day, sure enough, the exact same pair we sold starts to rise, the new one we buy was moving strongly but in that moment we bought the growth momentum is gone.
What is happening here? How did it get to this?
Can you explain how this works and how to get in a situation that produces positive results?
Absolutely, that's my job.
The market is alive but at the same time, the "market," as an individual or entity does not exist. The market is nothing more than you and me, multiplied a million times over.
Before we go deep into the market, let's answer the first question above.
As we engage with the Cryptocurrency market, or any market for that matter, we tend to do so without a plan, without a vision and thus we have to join the market force. When we join this market force we become entangled with the market. This entanglement can be either a positive or a negative polarization. Another way to become entangled is by reading news articles and analyses, notice that the news always tend to be negatively polarized with the market. When the say down, the market goes up. When they say up, the market goes down. This is the same phenomenon that causes your pairs to drop when you buy, and rise when you sell. It is a form of entanglement. The same concept as in "quantum entanglement" in quantum physics.
The first thing you need to know is that you are not making a decision for yourself, when you are in front of the computer and thinking, should I do this or that, there is literally a million people thinking the same. When you decide, they've all decided and this happens because of the entanglement.
Now, the reason why the market drops when you buy is because a million people decided to do the same, this is the mass. The bots that are owned by the exchanges trade against this mass. Anything you do, they simply do the contrary. They don't take any action, ever, they simply wait for the mass to take action, program their bots to do some calculations and then move contrary to whatever the mass does. Easy money.
If a large group of people decide to buy a pair, the whales, professional traders and exchanges will move to that same pair and sell. If the mass decides to sell a pair, the same group will buy and drive prices up.
The only way to become detached from this situation is by planning, because in this way you will create your own reality, your own timeline, your own vision and you won't be restricted to whatever the market force does. As soon as you lose your own vision you will get tangled up with the mass again and at this time you will give back any on all the profits you made.
That's why planning is so important. It is not because you have to have an actual plan, but because you will be able to make decisions that are not based on an impulse, the market impulse, you will make decisions made on your own. Just this small detail will make the difference between a win and a loss.
You can become entangled with an exchange, for example, by procrastinating in front of the screen, just looking at numbers and clicking around. This is surely a recipe for disaster.
As soon as you do whatever it is you are doing, detach. Go do something useful; read, meditate, exercise, breathe, or you can read my stuff. But you have to do something that expands your mind and creates new pathways in your brain, if it is an energy draining exercise you will eventually get tired and get drawn back into the herd and you will be moved again by the market impulse which will result in a loss.
This is the psychology of trading. We all know we can buy at the right time but somehow sell wrong. We can make many positive moves and then mess it all up. This is because the game is more than buying and selling, it is all in your mind and to have a strong mind you need knowledge, information, confidence; knowledge is power and I am giving you some specialized knowledge that I hope might help you improve your results.
Namaste.

$TOTAL Crypto Market Cap Trying to Breakout - Retail IS ComingOnly thing we’re waiting for is the Crypto Total Market Cap to breakout.
Golden Cross on the horizon.
That’s why we’ve seen lack of volume in breakouts for CRYPTOCAP:BTC and Alts.
Means money is just switching from coin to coin, primarily from Tether in circulation, hence why CRYPTOCAP:USDT.D is going down.
CRYPTOCAP:TOTAL breakout will be fueled by retail, which should slowly come in the next couple weeks leading into another round of rate cuts on the 14th, followed by Donald J. Trump being declared the President of the United States the very next day 🇺🇸❤️
YOU'RE NOT BULLISH ENOUGH 🎯

MARKETS week ahead: October 21 – 27Last week in the news
The US Retail Sales figures for September, as well as better than expected posted quarterly results of US companies were the major catalyst for the US equity markets during the previous week. The S&P 500 reached the newest all time highest level, ending the week at the level of 5.864. Although the US Dollar was gaining in strength, gold has also reached the fresh new highest level at $ 2.721, supported by the continuing tensions in the Middle East. The US 10Y Treasury yields were testing the 4,0% level. This week the crypto market was also in the spotlight of investors, where BTC was pushed up to the level of $68K.
The ECB cut interest rates by another 25 bps at their meeting held during the previous week. This was widely expected by market participants. Although ECB President Lagarde is still holding to the narrative that the ECB will be data dependent in the coming period, still what is evident is that the inflation in the Euro Zone is nearing targeted 2,0%. However, at this moment, inflation is a minor problem, considering that the EU economy is significantly slowing down. President Lagarde did not put too much emphasis on this issue, however, the markets continue to be of the opinion that the ECB would have to cut further in the coming months.
As September Retail Sales in the US were in line with the market expectation, and showed no threat to the inflation and FEDs forthcoming rate cuts, the market turned the view toward the increasing U.S. deficit. Economists are stressing that the US administration increased further deficit by 8% during this year, which recorded a $1,8 trillion. However, the economists are stressing a much higher problem for the US administration, which is the level of interest paid on that debt. As per reports, the interest payments reached $1,16 trillion, the highest amount ever in US history.
In line with the latest surge in BTC price, the inflows into BTC-linked ETFs also increased. As per news reports, around $2,1 billion flowed to these funds. BlackRocks chief investment strategist noted that 75% of all new investors in their BTC ETF IBIT have never before owned not a single iShare.
China posted its Q3 growth rate at 4,6% which was higher than expected, however, economists are noting that there are still significant challenges. The highest pressure on further China's growth is coming from the property market. New housing starts for the first three quarters were down by -12%y/y. However, hi-tech manufacturing continues to surge 10,1% y/y, as well as the auto industry, which is currently standing at 4,6%y.y. At the same time strategists from Wells Fargo are stressing that the value of Chinese equities are moving at overvalued territory. The MSCI China surged by 40% this year.
Crypto market cap
After a few challenging weeks, where crypto coins were traded in a mixed mode, a final breakthrough occurred during the previous week. A positive market sentiment was evident not only on the US equity market, but this time, investors sentiment was turned also toward the crypto market. Reasons are not quite evident at this moment. On one side are analysts who are noting increased odds of the US Presidential candidate and crypto-supporter (at least in the presidential campaign), Donald Trump to win the elections, while on the other side are analysts who are putting emphasis on increased government spending, which is more a realistic scenario. Whatever the reason, the crypto market capitalization increased by 6% on the weekly basis, adding total $139B to its market cap. Daily trading volumes remained relatively stable on a weekly level, moving around $112B on a daily basis. Total crypto market capitalization increase from the end of the previous year currently stands at $653B which represents a 40% surge from the beginning of this year.
Despite the significant increase in the market capitalization, still, there were coins which were traded in a negative territory during the week. The significant weekly gainer was BTC, which added $101.4B to its market cap, increasing it by more than 8% w/w. ETH followed the path, with a relatively smaller gain of $ 20B or 6.9%. BNB had another solid week, with a surge in market cap of almost $ 3B, increasing it by 3.5%. Market-favorite Solana was also in the winning club, with a surge in cap of $4.5B or 6.6%. Significant gainers in a relative terms, were Litecoin, with a surge in value of 13.7%, DOGE was traded higher by more than 26%, Bitcoin Cash was higher by almost 10%. There were a few coins which closed the week at lower grounds from the week before, like Maker, which dropped in value by 11% w/w, Uniswap was down by almost 11%, while OMG Network lost 5.3% in value.
When it comes to coins in circulation, Tether managed to increase the number of coins on the market by 0.3%, also increasing its total market cap by this amount. IOTA added 0.6% more coins to the market on a weekly basis, while the amount of Polkadot`s coins was higher by 0.2%. On the other hand, Maker decreased the number of coins by 0.6%.
Crypto futures market
The crypto futures market reacted in the same manner as the crypto spot market during the previous week. BTC both short and long term futures were traded higher by around 8.5% for all maturities. BTC futures maturing in December this year closed the week at the level of $69.900, while those maturing a year later were last traded at $76.035. At the same time, futures maturing in March 2026 closed the week at $78.010. This represents a significant move to the higher grounds, where the market, for the first time, is expecting BTC to reach the $78K level.
ETH futures surged by around 7.7% for all maturities. Futures maturing in December this year were last traded at $2.723, and those maturing in December 2025 closed the week at $2.904. It is interesting that ETH did not manage to cross the $3K level till the end of next year, and also not for maturities in March 2026, which were last traded at $2.957.

A glance at TOTAL Crypto Market LiquidityAs per current cup handle enthusiasm we have to be aware of the 2019 cup and handle that ended up not fulfilling the expected trend. History doesn't repeat but it does rhyme, and with more participants, more volatility, bigger cup, bigger handle.

Diversify Your Crypto InvestmentsCryptocurrency markets are known for their volatility, where prices can rise and fall dramatically within a short period. To manage the risks and capitalize on potential gains, diversifying your cryptocurrency portfolio is crucial. Just as in traditional investing, spreading your investments across different crypto assets helps reduce exposure to extreme price movements in any single asset and ensures you can benefit from the growth of various sectors within the market.
In this idea, we’ll explore the concept of crypto diversification, the importance of spreading risk, and a recommended percentage allocation for building a balanced portfolio across Bitcoin, Ethereum, altcoins, and meme coins.
Why Crypto Diversification Matters
Risk Management: Cryptocurrencies are notoriously volatile. By diversifying, you reduce the risk of one asset dramatically impacting your portfolio. If one cryptocurrency underperforms or crashes, others might perform well enough to offset potential losses.
Exposure to Different Technologies: The cryptocurrency space is vast, with Bitcoin leading as a store of value, Ethereum as a smart contract platform, and altcoins offering innovations in areas like decentralized finance (DeFi), NFTs, and blockchain scalability. Diversification allows you to participate in the growth of these different technologies.
Hedge Against Market Swings: Different cryptocurrencies may react to market conditions in various ways. For example, during market corrections, Bitcoin and Ethereum might drop less sharply than smaller altcoins or meme coins. A diversified portfolio allows you to hedge against such market swings.
Suggested Crypto Portfolio Diversification
When it comes to diversifying your crypto portfolio, a strategic approach can help you balance between established coins, emerging altcoins, and more speculative assets. Here’s an example of a diversified crypto portfolio with percentage allocations:
1. 50% Bitcoin (BTC)
Bitcoin is often referred to as "digital gold" and is considered the most stable and established cryptocurrency. As the largest cryptocurrency by market capitalization, it has the least volatility compared to altcoins and meme coins. A 50% allocation to Bitcoin provides a solid foundation for your portfolio, acting as a safer hedge in the volatile world of crypto.
2. 20% Ethereum (ETH)
Ethereum is the second-largest cryptocurrency and the leading platform for decentralized applications (dApps), smart contracts, and DeFi protocols. With its growing ecosystem and the shift to Ethereum 2.0 (which promises greater scalability), Ethereum offers significant growth potential while maintaining more stability than smaller altcoins. A 20% allocation in Ethereum allows you to participate in the innovation and expansion of decentralized finance and other blockchain applications.
3. 25% Altcoins:
Altcoins are any cryptocurrencies other than Bitcoin, many of which offer unique technological innovations. For this part of the portfolio, you could include assets such as SOL, FET, INJ, UNI, LINK, etc.
Allocating 25% of your portfolio to altcoins offers exposure to innovative technologies with potentially high returns, though they come with higher risks compared to Bitcoin or Ethereum.
4. 5% Meme Coins (DOGE, SHIB, etc.)
Meme coins like Dogecoin (DOGE) or Shiba Inu (SHIB) are speculative assets that often gain value due to community support, social media hype, or celebrity endorsements. They are extremely volatile, with the potential for short-term gains but also significant risks. Keeping only 5% of your portfolio in meme coins ensures you don’t overexpose yourself to their high volatility, while still allowing you to benefit if these coins surge in value.
Example of a Diversified Crypto Portfolio Allocation
Let’s assume you have $10,000 to invest in cryptocurrencies. Here's how you might allocate your funds based on the diversification strategy above:
$5,000 in Bitcoin (50%)
$2,000 in Ethereum (20%)
$2,500 in Altcoins (25%)
$500 in Meme Coins (5%)
This allocation offers a balanced approach, giving you exposure to the relative safety of Bitcoin and Ethereum while also allowing you to take advantage of the potential high growth from altcoins and meme coins.
Why This Allocation Strategy Works
- Stability with Growth Potential: With 50% allocated to Bitcoin and 20% to Ethereum, you are investing in two of the most established and widely adopted cryptocurrencies. These are often seen as the "safer" options in the crypto world, and their long-term potential is generally considered strong.
- Exposure to Innovation: The 25% allocation to altcoins provides exposure to emerging sectors like DeFi, AI, and blockchain interoperability. While altcoins tend to be more volatile, they offer significant growth potential if their underlying technologies gain widespread adoption.
- High-Risk, High-Reward: The 5% allocation to meme coins adds a speculative aspect to the portfolio. Meme coins have a history of spiking in value, often due to online hype. Although risky, keeping a small portion of your portfolio in these assets can offer the opportunity for outsized gains while limiting your risk.
Key Tips for Managing a Diversified Crypto Portfolio
- Rebalance Regularly: The crypto market is highly volatile, and the value of different assets can fluctuate dramatically. Periodically rebalance your portfolio to ensure that your allocations remain aligned with your goals. For example, if the value of your meme coins spikes, they might occupy a larger percentage of your portfolio than desired. Rebalancing ensures that you take profits and stick to your original diversification strategy.
- Do Your Own Research (DYOR): While diversification helps mitigate risk, it's essential to research the coins you're investing in. Don’t blindly invest in an asset just because it’s trending. Understand the project, its use case, the team behind it, and its long-term potential.
- Avoid Over-Diversification: While diversification is important, spreading your investments too thin can dilute your returns. Focus on quality projects rather than trying to invest in every available cryptocurrency.
- Have a Long-Term Mindset: The crypto market can be volatile in the short term, but having a long-term mindset is critical for success. Don’t panic during market dips—if you have a well-diversified portfolio, you’re better positioned to ride out the volatility and potentially benefit from long-term growth.
Diversifying your cryptocurrency portfolio is a smart strategy for managing risk and taking advantage of the crypto market's various opportunities. A balanced allocation—such as 50% Bitcoin, 20% Ethereum, 25% altcoins, and 5% meme coins—helps you mitigate the risks of volatility while allowing you to participate in the growth of different sectors.

Total market cap is on the verge of parabolic rise!We are in the beginning stages of the parabolic movements that come after the 700th day, which corresponds to the 23rd candle from the bottom on the monthly chart in the #Totalmarketcap.
However, #bitcoin #ethereum and #altcoins will follow the hard run 📈⏳

TOTAL update - Oct 18 2024#Total has been rising for the past 7-8 days and has managed to hit 2.3T area. Since there are multiple resistances present in the mentioned area, it's possible to see some dump in TOTAL. The trigger for the drop is the breaking of the blue ascending trendline. If the dump is confirmed, TOTAL can drop to 2.13T - 2.16T zone.

Crypto Total Market Cap to Surge to $5.987T by 2029!Using the Elliott Wave theory, Fibonacci retracement, and the ABCD pattern, I’m projecting a significant rise in the total crypto market cap over the coming years, potentially reaching $5.987 trillion by 2029.
We are currently in the early stages of a new impulse wave (Wave 3) after completing a corrective phase (Wave 2). The first target (TP1) is set at 3.967T, supported by the 1.618 Fibonacci extension level. If the market reaches this target, a subsequent wave (Wave 5) could push the total market cap up to 9.983T, aligned with the 2.618 Fibonacci extension level.
The ABCD pattern further confirms these projections, reinforcing the potential for a strong upward movement.
While the market remains dynamic, this analysis provides a promising outlook for the long-term growth of the crypto space. Stay tuned and secure your positions! 🛡️📈


Total 1 MA200Hi dear traders, as you can see on this chart Total 1 has been break the MA200 approximately and if it can Consolidation above MA200 and when we make sure that we really break MA200 so we can expect the rest of the alt coins start moving upward at least up to their MA200 area.
me myself still watching the Total 1 to make sure of breakout.
will update you again and will share my analysis also about Total 2&3 as well separated on another post.
p.s : always do the money management and risk management do not do gamble.
Regard

TOTAL crypto DiagonalI found a pattern that is the key to upcoming moves in all cryptocurrency markets. I am looking at the same charts for months because I focus on them as indicators, however I has discovered it on TOTAL, which indicates his predictive strength.
It is quite simple to understand the pattern. Here is a quote from the book “Elliott Wave Principle”, -
A diagonal is a pattern that has two corrective characteristics. As with an impulse, no reactionary subwave fully retraces the preceding actionary subwave, and the third subwave is never the shortest. A diagonal is the only five-wave structure in the direction of the main trend within which wave four almost always moves into the price territory of wave one and within which all the waves are "threes" or can be labeled 5-3-5-3-5. It has recently come to light that a diagonal occasionally appears in the wave 1 position of impulses and in the wave A position of zigzags.
An ending diagonal occurs primarily in the fifth wave position at times when the preceding move has gone "too far too fast". A very small percentage of diagonals appear in the C-wave position of A-B-C formations. In all cases, they are found at the termination points of larger patterns, indicating exhaustion of the larger movement.
Here is an example of Ending Diagonal on DJIA.
Ending diagonal often ends in a “throw-over,” i.e., a brief break of the trendline connecting the end points of waves one and three.
A rising ending diagonal is usually followed by a sharp decline retracing at least back to the level where it began and typically much further. A falling ending diagonal by the same token usually gives rise to an upward thrust.
Fifth wave extensions, truncated fifths and ending diagonals all imply the same thing: dramatic reversal ahead. At some turning points, two of these phenomena have occurred together at different degrees, compounding the violence of the next move in the opposite direction.
That it for now!
Which next steps towards analysis of this discovery do I see?
In the text of the citation there is mentions of the labeling shape - 5-3-5-3-5. It is need to check the relationship to the PHI, this may give a clue - Ending or Leading Diagonal do we have and - targets projection.

CRYPTO bullish?CRYPTOCAP:TOTAL
- Crypto market is forming a solid cup and handle formation.
- Currently in a broad downward trending channel, with a high probability of a breakout to the upside.
- Price is currently at 0.5 fib from previous swing low and swing high on the daily.
- High volume on the candles leading to the 50% level which indicate high interest.
- Looking for smaller candles to consolidate on the 50% level before a reversal to occur.
- If the reversal does occur at the 50% key level, this would create a high probability of a channel breakout to the upside.
- If price breaks through the 50% key level to the downside, then crypto will be bearish, looking for support at the 1.816T level, or touch on the lower bounds of the channel.
- Daily StochRSI is also at oversold region at <5

MARKETS week ahead: October 14 – 20Last week in the news
The US inflation data were in the spotlight of the markets during the previous week. A modest increase in September was another indicator for markets that the Fed might continue to cut in the coming period. The US equity markets reacted positively, bringing the S&P 500 to the freshly new all time highest level. The index is ending the week at the level of 5.815. The US Dollar gained during the week, while the price of gold managed to break from the $2,6K level, reaching new highs at $2.657. The 10 US Treasury yields spent the week testing the levels modestly above the 4,0%, easing a bit at the weekend. The crypto market was traded in a mixed manner, still, BTC managed to reach the $63K short term resistance as of the Fridays trading session.
The US inflation data for September was published during the previous week. The data shows that the inflation is cooling down toward the Feds targeted 2%. The inflation was higher by 0,2% for the month, bringing the total yearly inflation to the level of 2,4%. Core inflation continues to be elevated, adding 0,3% in September to the total yearly score of 3,3%. The majority of market participants are positive when it comes to expectations that the Fed might continue to cut interest rates at their November meeting, according to the CME FedWatch Tool. Still, Atlanta Fed President Bostic, noted in an interview that he might be against a rate cut in November in order to get better insight if inflation is certainly moving toward the 2% target.
The ECB meeting is scheduled for October 17th, where its members will discuss the potential rate cut. As per current market sentiment, expressed in the Reuters poll, 90% of economists and professionals are of the opinion that the ECB will make a 25 bps cut in October and also 25 bps cut in December. Such a sentiment is supported by a cooling inflation in the EuroZone, which is gradually moving toward the 2,0% target. However, the core inflation is expected to stay elevated. On the other hand, it should be considered that the EuroZone is struggling to sustain economic growth. It is expected that the economy will grow modest 0.2% this quarter, reaching some 0.7% a yearly growth. Still, the economy is expected to accelerate during 2025 by 1,2%.
After frenzy for China's stocks hit the market two weeks ago, the market has cooled down during the previous week, as China's Ministers did not provide in a statement the level of austerity measures as was expected by markets. News reports that China's finance minister noted in an address to journalists, that China has space to increase its debt and the deficit. The government is still not publicly disclosing the level of fiscal stimulus for the economy.
Tesla shares dropped by around 9% during the week, after the announcement of a new product called robo-taxi. The investors were not at all impressed by the product, as they were commenting that the presentation was related to Elon Musk's vision of the future more than opportunities for Tesla.
Crypto market cap
The crypto market was traded in a mixed manner during the previous week. The start of the week was with a negative sentiment, but the US inflation which is nearing toward the Feds target of 2% turned market sentiment to positive one. Although the highest weekly gainers were US equity markets, still positive sentiment helped the crypto market to end a week with a small weekly gain. Total crypto market capitalization increased by modest 2%, adding $ 51B to the market cap. Almost half of it came solely from Bitcoin. Daily trading volumes were modestly decreased to the level of around $114B on a daily basis, from $126B traded a week before. Total crypto market capitalization increase from the end of the previous year currently stands at $514B which represents a 31% surge from the beginning of this year.
The first half of the week was not positive for the majority of crypto coins, however, the majority of them managed to finish the week with a small gain. The leader of the market was BTC, which added $24B to its market cap, finishing the week at a gain of almost 2%. ETH surged by 3% on a weekly basis, adding $8.7B to its capitalization. BNB also managed to add $2.2B to its market cap, increasing it by 2.7%. The group of significant weekly gainers also includes Solana, with an increase in cap of $2.3B or 3.4%. Coins which managed to increase their market capitalization in relative terms were NEO, with a surge of 7.25%, ZCash was traded higher by even 28.1%, currently without public information on the reason. Uniswap also ended the week with a gain of 20.3% on a weekly basis, which was rare, but quite a significant increase of the market value. The majority of other coins gained somewhere from 0% up to 3%. There were also several losers during the week, like LINK, which traded down by 1.85%, OMG Network ended the week by 5% lower, Maker dropped by 6.3%.
Changes in circulating coins are still relatively active on the crypto market. During the previous week Polygon decreased the number of its coins on the market by 0.8%, while Maker`s circulating coins decreased by 0.3%. On the opposite side, Algorand increased the number of coins on the market by 0.4%, while Solana, Polkadot and Filecoin increased the number of coins by 0.2%. The majority of other altcoins increased their circulating coins by 0.1% w/w.
Crypto futures market
The crypto futures market did not manage to catch up with an increase in value of coins which occurred on the spot market. BTC both short and long term futures were traded higher by around 0.9% on a weekly basis. BTC futures maturing in December this year reached the last price at $64.210, while those maturing a year later are still holding above the $70K level, ending the week at $70.305.
ETH futures were traded higher by around 1% on a weekly basis, except those maturing in December 2024, which were last traded at $2.505 or 4.03% higher from the week before. Futures maturing in December 2025 closed the week at level of $2.696, while March 2026 was traded below the $3K level, ending the week at $2.745.

🔥How much can the Crypto market capitalization grow by 2025🔥Today we want to share with you our observations and thoughts on how the total capitalization of the crypto market can grow in the future.
You have probably already noticed that in all markets the history of market participants' behavior and, accordingly, asset prices is cyclical.
The cryptocurrency market is no exception.
Here is a global chart of the total capitalization of cryptocurrencies in different periods of the market.
Despite the fact that in different periods there were different factors of growth or decline of the cryptocurrency market, such as the ICO alt-season 2017 and the bear market 2018 or the DeFi boom of 2020-2021 and the current exhausting market's decline. There is a clear cyclicality (of course, a statistical error of 1-2 weeks over such a long period of time is acceptable)
So, 1 candle or bar on the chart is 1 trading week and that's what we have:
from the high of 2017 to the low of 2018 - +/- 49 weeks have passed
from the high of 2021 to the low of 2022 - +/- 52 weeks have passed (of course, if an absolute annual minimum was recorded last week)
from 2017 high to "BTC halving 2020" 123 weeks have passed
from the high of 2021 to "BTC halving 2024" may take +/- 125 weeks (the approximate date is April 2024, but the date may move, depending on the capacity that will be connected to mine BTC blocks. Halving will take place on block 840000)
after "BTC halving 2016", the crypto market maintained a rapid growth trend for 77 weeks
after "BTC halving 2020", the crypto market maintained a rapid growth trend for 78 weeks
after "BTC halving 2024", we project a rapid growth trend of 79 weeks. Accordingly, the future growth trend in the cryptocurrency market may reach its maximum around the middle of autumn 2025.
We also designed 2 fractals of a possible path of growth of the total capitalization of the crypto market.
The white fractal indicates growth with a maximum value of +/- $13 trillion.
The blue fractal indicates growth with a maximum value of +/- $26 trillion.
In order to understand whether it is a lot or not, we will give you some examples of the current capitalization of certain markets:
SP500 +/- $33 trillion
Gold +/- $11 trillion
Silver +/- $1 trillion
Cryptocurrencies +/- $800 billion
Earlier, we made an idea where we made similar calculations on the BTCUSDT chart
So, if you are interested in what mark the Bitcoin price can reach at the end of 2025, we invite you to view it:
If you are interested in the current situation on the BTCUSDT chart and the prospects of price movement for the next week, we invite you to read this idea:
_____________________
Did you like our analysis? Leave a comment, like, and follow to get more

Crypto Market will fly!I did a lot of research an analysis, but everything is pointing out to the upcoming rally across the crypto market. When looking at Total Market Cap, it is quite obvious that there is a huge bull flat. If I to trade TOTAL, this would be my setup, but this could only be the very beginning of a huge rally.

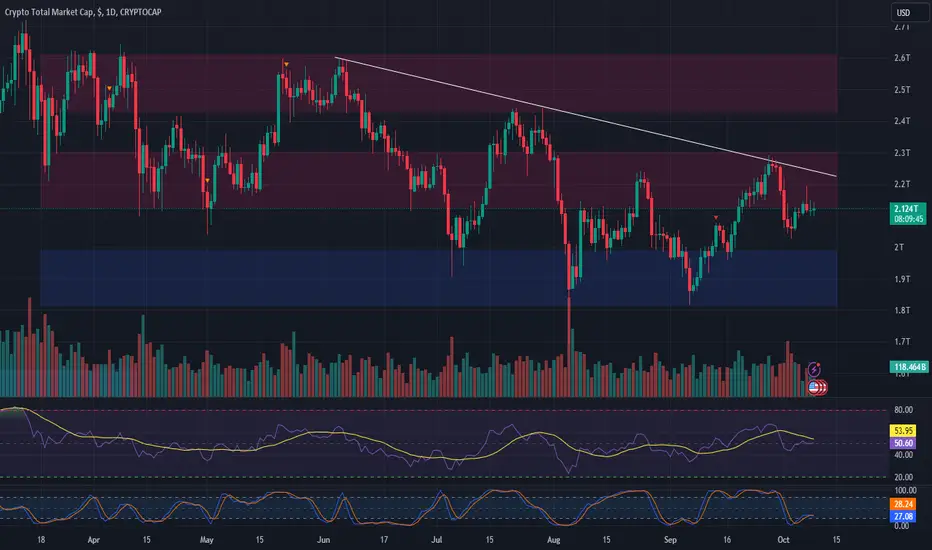
TOTAL Market Struggles at $2.13T Resistance: Key Levels to WatchMarket Update:
Over the past week, the TOTAL market capitalization has attempted to break through a tough resistance level at $2.13 trillion.
A rejection at this level may lead to a pullback, testing the next support level around $2 trillion.
Potential Scenarios:
Should the TOTAL market successfully break above $2.13 trillion, it could rise to challenge the descending resistance line formed since June, as well as the top of the range resistance at approximately $2.3 trillion.
Given that the TOTAL market is currently at resistance, it is essential to manage risk carefully, as a rejection at this level could result in further downside for many altcoins.
#CryptoMarket #TOTALMarket #ResistanceLevels #Altcoins #MarketAnalysis