CRYPTO TOTAL MARKET CAP (TOTAL)Crypto Total on the mend. Price appears to have found support above the 50% and we see further price continuation. Volume has slowly crept back into the market with most institutional player coming back after holiday. Notice how volume has created a higher low on the 4H. Keep an eye out if this trend holds. Markets are extremely volatile so expect large moves off consolidation areas. Expecting a potential bounce off the lower time frame 50%. Price must hold the short-term trend line otherwise we could see a liquidity sweep. If the higher time frame 50% is turned into resistance, we could see a price drop to the lower levels.
Take note of recent divergence found on the MACD and RSI. Price continues to move higher with high lows, while we see lower lows forming on the indicators. This typically indicates that the buyers are absorbing all the selling pressure in the market. Once sellers are unable to maintain pressure the buyers will prevail. Expect price continuation until otherwise proven.
TOTAL trade ideas


MARKETS week ahead: January 6 – 12Last week in the news
Markets used the first trading week in this year to slowly gear up for the coming period. The US equity markets had a copy-paste from the last week of December, where the week started in a negative sentiment, but Friday brought optimism. The S&P gained on Friday, ending the week at the level of 5.942. The US Dollar continues to gain in strength, bringing some volatility to the price of gold, which ended the week at $2.638. The US Treasuries are still digesting US macro data in expectation of the January FOMC meeting, bringing the 10Y US benchmark to the level of 4,62%. The crypto market started the new year in an optimistic manner, bringing BTC back to levels of $98K.
Previous week was relatively calm when it comes to the release of currently significant macro data in the US. However, the largest US companies started to release their business plans for the year 2025. One of the most important news came from Microsoft, which noted that the company plans to spend at least $80 billion on construction of data centers which could be able to sustain a heady workload of AI-powered systems. For some time now, analysts have been noting that AI is the next “big thing” and that companies involved in the AI ecosystem would gain the most funds from investors. After this news the US equity market regained optimism bringing tech-heavy indexes to the higher grounds on Friday.
CNBC made an interesting analysis based on officially published data in China, related to imports of phones into this country. Namely, as per CNBC, foreign mobile phone shipments in China dropped by 47% y/y in November. Considering that the majority of foreign phone shipments in China comes from Apple, CNBC is noting that Apple's market share in China might be under pressure in the coming period, considering strong competition from local smartphone producers.
Interesting news published by Reuters at the beginning of the previous week, states that a local group of Swiss cryptocurrency advocates started an initiative proposing to the Swiss National Bank to hold Bitcoin, in a sense of national reserves. The initiators now have the task to collect 100.000 signatures in order for the initiative to reach a public referendum in Switzerland.
At the start of the new year, analysts from investment company Goldman Sachs published their view and forecasts on the economic developments in the US, EU and China. The economic growth is expected to continue in the US, around 2,7%, while the EU should accelerate at a modest pace of 0,8%. The EU economy will continue to stand a hit from higher energy prices and also from high competition from China. Their expectations are that the EU will further cut interest rates to the level of 1,75%. Analysts from Goldman are noting geopolitical risks as ones to prevail in the 2025, as well as risks for the US economy if a new US administration imposes tariffs on goods from China.
Crypto market cap
The crypto market used the first trading week in a year to gear up for the rest of the year, and set the sentiment for the future. Major event that is ahead relates to the inauguration of the new US administration on January 20th, which was generally crypto-friendly during the pre-election period. The market expects positive developments for the crypto industry in the next four years. Whether there will be challenges on that road, is to be seen. After a bumpy year-end, the market set the positive sentiment during the previous week, where total crypto market capitalization gained 5% during the week, adding $160B to its market cap. Due to holidays, daily trading volumes remained relatively lower, moving around $158B on a daily basis. Total crypto market capitalization during the year 2024 was increased by 97%, while during the first trading week in 2025 the market gained 5%, or $160B.
Majority of crypto coins gained during the previous week. BTC, the leader of the market, increased its market cap by 3,5% or $65B. Ether was also on a winning side, adding $ 29B to its market cap, increasing it by 7,3% w/w. Some other notable gainers were DOGE, with an increase in the market cap of 19,3%. ADA also significantly gained, a 21% increase w/w. Market favorite Solana was up by “only” 11%, while Algorand was traded higher by 20% w/w. Stellar should also be mentioned, as the coin managed to gain a significant 26% in value. Only a few coins ended the week in red, among which were ZCash, with a weekly decrease in value of 4%, while Tether decreased its coins in circulation and its market cap by 1,2%.
As for coins in circulation this week Solana managed to increase the number of its coins on the market by 0,7%, followed by Filecoin`s increase by 0,5% of circulating coins. In line with its significant increase in the value, Stellar managed also to increase the number of circulating coins by 0,2%.
Crypto futures market
The market optimism is back not only on a spot market, but also on the crypto futures market. The long term futures prices are expressing currently strong sentiment for BTC of investors. BTC futures were traded higher by more than 4% for all maturities. The major development is with longer term futures which are holding at levels above the $100K. In this sense, futures maturing in December 2025 ended the week with the price of $107.460, while futures maturing in December 2026 reached for the first time the level of $116.750.
The ETH futures were traded higher around 8% on average. It is important for ETH that longer term futures crossed for one more time the level of $4K. Futures maturing in December 2025 were last traded at $3.885, while those maturing in December 2026 closed the week at $4.172.

I’m expecting a bounce of the 3.43 regionWe still very much bullish until it breaks below 3.34. It took out liquidity at the 3.43 region so would likely bounce of there or proceed to 3.34 and be bearish

2025 Crypto is Starting Strong
On the 2W timeframe (left), the chart shows a bullish structure holding, with the market previously breaking above significant levels, such as the 21' High at 3.02T and the previous high at 3.45T. The next target appears to be 3.73T, marked as "waiting for retest."
The 8M timeframe (right) reflects a broader, cleaner perspective, indicating that the market has consistently broken higher highs since 2021. The structure is bullish as long as it holds above the 21' High.
Key Levels:
3.73T: A crucial resistance level and target for retesting in the bullish cycle.
3.45T: Current support where the market has recently retested.
3.02T: Strong support from 2021, providing a critical foundation for bullish momentum.
Analysis:
The market looks to consolidate above 3.45T and aim for the 3.73T level.
If momentum continues, the next significant target is the 4.44T level, aligning with the higher-timeframe bullish cycle.
Any pullback should ideally hold above 3.45T to maintain the bullish trend. If it fails, the 3.02T level is critical for structural support.
Conclusion: This chart is solid evidence of a bullish market. It highlights the importance of respecting higher timeframe structures, focusing on previous highs as targets, and watching for confirmation around significant levels like 3.45T and 3.73T.

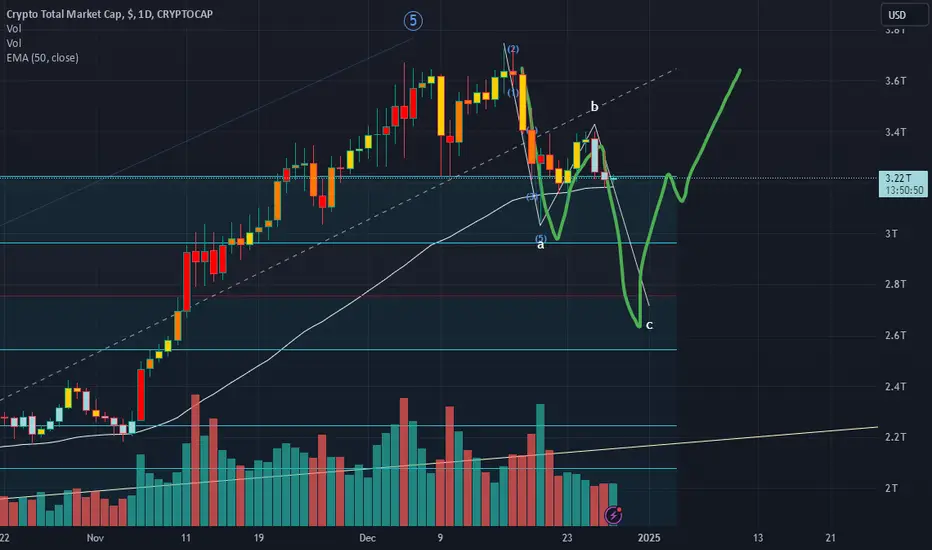
total marketcap updateat this time i can see 2 different scenarios we are at a very important juncture.#1 we are breaking out and will see all coins start to break out.#2 we are in an ABC correction on bigger time frame and will see a break down by Monday if #2 plays out. at this time there inst enough data to make a positive division yet.

#Crypto #total #marketcrashIs there a #cryptocrash around the corner? I am examining this from my conservative count and my biggest concern has ben the numerous amounts of subdivisions seen on month Tf of lesser degrees. The volume of candles is dwindling so it should cause everybody great concern if you are a long term bull!


Crypto Market to Hit $5 Trillion in 2025?The crypto market added an astonishing $1.58 trillion in 2024, and projections for 2025 are even more bullish, with a potential market cap of $5 trillion. While most altcoins are still down over 50%, the next altcoin rally could be the catalyst for explosive growth. Institutional investors are also predicting Bitcoin to hit $150K, further fueling market optimism.
The combination of increasing adoption, institutional interest, and potential altcoin recovery makes this goal achievable. Prepare for the next big wave by identifying undervalued projects and managing your risk effectively. 2025 could be the year of exponential growth—stay ahead of the curve!

Total Crypto Market Capitalization prediction for 2025The basis for the analysis in today's idea about the future of the total capitalization of the crypto market is our idea from 2 years ago, where we assumed that the “bottom” has already been reached and that we will continue to see strong growth. Read it 👇
Since then, the total capitalization of the crypto market has grown 4 times from $800 billion to $3.2 trillion. This is mainly due to the growth of the CRYPTOCAP:BTC price from $16k to the current $95k and its BTC.Dominance index from 39% to the current 58%.
Many altcoins are still depressed, many of them failed to update their ATH, so let's assume that there hasn't been a real altseason yet)
And here's how the capitalization of other financial assets has changed approximately over 2 years:
end of 2022👉end of 2024
SP500 - $33 trillion 👉 $45 trillion
Gold - $11 trillion👉 $18 trillion
Silver - $1 trillion 👉 $1.8 trillion
Cryptocurrencies - $800 billion 👉 $3.2 trillion
Crypto rules, at least in terms of growth!)
In addition, two fundamental events have taken place since then: BTC ETFs and ETH ETFs are gateways for the infusion of large institutional money into the crypto market, but also flags for the regulation of the crypto market.
And then, only modeling in the mix with our fantasies and desires for 2025)
1️⃣ Previous cycles of rapid growth of the crypto market lasted 550 days after the #Bitcoin halving, so we assume that the current one will last at least until the end of October 2025.
2️⃣ The “growth power” of the total capitalization of the crypto market decreased by 6 times with each cycle, which means that in the current cycle it should reach at least $7-8 trillion
3️⃣ But this time, we have a “dark horse” - ETFs, and who knows how many more of them will be approved in the future and how this will affect the crypto market. Moreover, the number of cryptocurrencies is no longer thousands or tens of thousands, but millions. Memecoins are created in 30 seconds and rolled out to a multi-million dollar capitalization in weeks) And it is still commonly believed that the “naive and hungry” retailer with the eternal FOMO syndrome, who buys anything at any price, has not returned to the crypto market.
4️⃣ Therefore, purely hypothetically, simply based on fractal analysis and a combination of fibo levels, we assume that the crypto market can “swing” up to a cosmic $53 trillion
5️⃣ Further, according to the same fractal analysis, the current correction of prices on the crypto market and its total capitalization should not be very long, well, at most another -10% from the current $3.2 trillion to $2.85 +|-
6️⃣ Everything is very fantastic and promising, doesn't it?) Then let's put the icing on the cake and go to celebrate the New Year 2025.
According to our forecast from 2 years ago, the OKX:BTCUSDT price has every chance of reaching $355,000 by the end of 2025 👇

Correction On Cryptos Can Last A bit Longer.
Cryptocurrencies are still in consolidation, and one of the reasons for these pullbacks or slow price action across some coins is the lower volatility caused by the Christmas and New Year holidays. Another key factor contributing to Bitcoin's recent weakness is the sell-off in US stocks at the end of last week. The correlation between Bitcoin and the Nasdaq 100 remains intact, and I believe there’s potential for further weakness in Bitcoin, possibly down to the 90,000 area, especially if stocks continue to consolidate.
What about ALTseasons everyone is desperately waiting on?
In a risk-off environment, even altcoins are unlikely to produce significant gains. It’s extremely difficult, almost impossible to see an ALTseason when there’s both a risk-off sentiment and a declining Bitcoin. For an altseason to emerge, we need a risk-on environment while bitcoin is consolidating...
Grega

MARKETS week ahead: December 30 – January 5Last week in the news
The Holiday season on the Western markets made its impact on lower trading volumes and lower volatility for US Dollar, the price of gold and the crypto market. As for US equities, the previous week was influenced by shifts in US Treasury yields. The 10Y US benchmark yields reached the level of 4,629% after considering Feds narrative over the future course of rate cuts in 2025. The price of gold ended the week relatively steady at the level of $2.621, while BTC had a modestly volatile week, but still testing the $95K to the downside. The week ahead brings another short Holiday, celebrating the end of 2024 and the beginning of 2025, when a relatively calm week should be expected.
Without any significant news from the Western markets, the Japan monetary authorities were in the spotlight during the previous week. Namely, the Japanese Finance Minister Katsunobu Kato noted that the rate increase is still on the table for the BoJ meeting in January. The excessive movements in Yen during the previous period is not welcomed by Japanese monetary authorities, in which sense, an increase in interest rates would support its stabilization. However, the Ministry must take a cautious approach, considering a trajectory from the US economy. A potential hike would make borrowing in Yen more expensive, in which sense, some carry trading positions would have to be closed, which would at the bottom line have a negative impact on the US markets.
Based on analysts' opinion, the big seven companies in the tech industry are going to be in the focus of market interest also in the future. Increasing demand for the AI ecosystem will further support businesses within the tech industry. The so-called “Magnificent seven” stocks are ending this year almost 180% higher, with market capitalization exceeding $3 trillion. During the year, Nvidia became the second most valued company in the US.
Central bank moves in terms of further cut of interest rates is going to be in the market focus also during the year 2025. High inflation was put into control, based on which, both Fed and ECB made their cuts of reference interest rates during 2024. The trend is expected to continue also during 2025, however, at a lower pace. Fed Chair Powell noted at December's FOMC meeting expectations of further 50 bps cut of rates during 2025. On the other side is the European Central Bank, holding onto actual macro data in order to make a further decision on rate cuts. As inflation in the Euro Zone slowed down, a lower rate cut is also expected during 2025.
Crypto market cap
Although December was a tight month for the crypto currencies market, still, it should be considered that crypto coins had one extremely good year, with a few milestones reached. The year 2024 will be marked as the year when the first BTC spot exchange traded fund has been officially approved and started trading on traditional markets. The second important milestone for BTC was its $100K target. BTC is also ending this year with the all-time highest level reached during the year at $107,8K. Turning to the previous week, total crypto market capitalization was decreased by additional 1%, decreasing the cap by $30B. With the start of the Holiday season on Western markets, total daily trading volumes were significantly decreased to the level of $131B on a daily basis, from $397B traded the week before. Total crypto market capitalization increase from the end of the previous year currently stands at $1.592, which represents a 97% surge from the beginning of this year.
BTC closed the previous week at 3% lower from the week before, losing $58B in the market cap. This week ETH was flat, while the rest of altcoins were traded in a relatively mixed manner, as there were both gainers and losers. DASH gained almost 14% in value, while Theta and ZCash increased their market cap by more than 10%, each. This week the value of XRP dropped by 3,3%, LINK was last traded down by 4,7%, while the value of Maker decreased by 6,9%.
As it comes to coins in circulation, few altcoins had a higher increase, including IOTA, with a surge in circulating coins of 0,5%, while XRP increased the number of its circulating coins by 0,3% on a weekly basis. For the second week in a row the number of Tether coins on the market decreased, this week by 0,6%. A drop in the number of coins also had Polygon of 2,2% on a weekly basis.
Crypto futures market
During the previous week both BTC and ETH futures were traded lower compared to the week before. BTC futures were down by more than 2% for all maturities. Futures maturing in December 2025 reached the last price at $103.410, while December 2026 closed the week at the level of $111.930. On a positive side is that investors still perceive positive development for the value of BTC in the future period.
ETH futures were traded lower around 4% for all maturities. Futures maturing in December 2025 closed the week at the level of $3.601, while those maturing a year later were last traded at $3.837. The ETH is still struggling to sustain the $ 4K level on a long run.

$TOTAL - Bearish H&S on 15m The rest of 2024 looks to be bearish for the crypto market. Keeping a close eye on the 0.786 Fib retracement (3.07TUSD). This level is the neckline of a larger H&S formation on the 4h chart.
If the level holds, we are looking at a double bottom and bullish price action should follow.
If the price breaks and falls, there is potential for a 15% - 30% further decline (2.6 - 2.2TUSD).

Gambling vs Crypto: A Thin Line The world of crypto trading and gambling may seem distinct, but they share striking emotional and behavioral resemblances that blur the line between the two. Both arenas evoke the powerful emotions of greed and fear , which can cloud judgment and lead to devastating financial losses . People often enter with dreams of quick success, only to find themselves trapped in cycles of hope and despair.
In both gambling and crypto trading, the lure of fast profits can be overwhelming. The rush of a winning streak in gambling mirrors the exhilaration of catching a rally in a cryptocurrency's price. Conversely, the crushing despair of losing a bet feels eerily similar to watching a crypto investment plummet. This emotional rollercoaster, driven by greed and fear, compels many to make rash decisions, ignoring the risks that come with either activity.
Go All In :
A key resemblance lies in the tendency to "go all in." In gambling, this might mean betting an entire bankroll on one game or spin. In crypto trading, it translates to investing all savings into a single token or using leverage to multiply potential returns. Leverage , which allows traders to borrow money to amplify their positions, is particularly dangerous. While it can lead to massive profits, it often results in catastrophic losses when trades go wrong. Without proper money management, both gamblers and crypto traders can find themselves wiped out in the blink of an eye.
Yet, crypto trading introduces an additional layer of risk that makes it arguably more perilous than gambling. Unlike a casino game where the odds are generally fixed and transparent, the crypto market is rife with uncertainties. Many projects are launched with lofty promises but lack transparency or sound fundamentals. In some cases, unscrupulous teams behind these projects orchestrate " rug pulls ," abruptly vanishing with investors' money. These scams can decimate not just traders' portfolios but also their confidence and dreams.
While both gambling and crypto trading involve risks, the unique dangers of the crypto world—amplified by its unregulated nature and the prevalence of scams—make it a minefield for the unwary. The emotional highs and lows, coupled with the absence of safety nets, mean that the thin line separating gambling and crypto trading is often a perilous one. Understanding these risks and maintaining discipline are crucial to avoiding the pitfalls that lie on either side of this line.
By Monstalian,

total market cap on cryptothis is my thoughts on what we can expect on the total cap. we are still valid on a c-wave down something to be aware of if we dont get a break out.
Crypto Total Market CapThe chart shows the total crypto market cap breaking past a key resistance at around $3.01T, signaling strong bullish momentum. This breakout suggests the market is poised for significant growth, with the potential to reach new highs in the coming months. As confidence builds among investors, this could be a prime opportunity to capitalize on the market's upward trend. Stay disciplined and informed to make the most of this promising phase.

TOTAL ideaThese are the key area im looking at for TOTAL during this bullrun. If I change my mind I will update below this post.

Total to do just 4.6T-5.6T in 2025?hey
it looks we are in some nice healty bull run going into 2025.
Tops could happen in early April or/and early May.
Healty retracement afterwards, and one more bull run towards early November.
Well that is what past shows us, and future will do?
what it wants :)
go go, lets do better then past.
de

Total Market CapTotal Market Cap started a parabolic run from the beginning of 2021 after the breakout and retest in December 2020, which was the 2017 ATH level ($761B).
The breakout at the 2021 ATH level ($3.01T) in December 2024 has been co!mpleted and is being retested!
I think the countdown to the parabolic run has begun for CRYPTOCAP:BTC CRYPTOCAP:ETH and #Altcoins

MARKETS week ahead: December 23 – 29Last week in the news
The Fed cut interest rates by another 25 bps, but Powell`s rhetoric in an after the meeting address to the public did not make markets happy. A correction was strong and immediate. The US equity markets were hit the most, followed by the crypto market. A market correction brought the S&P 500 down to the level of 5.930. BTC reached its lowest weekly level at $ 92K, however, recovered as of the weekend to the level of $97K. The price of gold followed US Dollar volatility, dropping down to the level of $2.622. In line with Feds expectations of a 50 bps cut in 2025, the 10Y US benchmark yields jumped to the levels above the 4,5%.
At a December FOMC meeting the Fed cut interest rates by another 25 bps, which was generally expected. However, markets were not at all happy to hear what followed. The FOMC projections for year 2025 showed inflation expectations to be higher from previously estimated. The PCE inflation indicator is expected to end 2025 at 2,5%, higher from previous estimation of 2,2%. The targeted 2% is expected to reach in 2027. At the same time the Fed expects the jobs market to be cooling, but the GDP forecast was not changed from the previous estimate. As the discounting rate changed, so the markets entered into correction, where US equity markets were hit the most.
On a positive side for US markets is that the Bank of Japan decided to hold interest rates at 0,25% for the third time this year. Considering significant carry trade in Yen, this is positive news that markets will not suffer another shock till the end of this year.
A hit for the European markets during the previous week was a slide of value of Novo Nordisk shares by 20%. This drop came after the Danish drug maker published results for a weight-loss drug that did not meet expectations in a trial. Although the drug was expected to help patients to lose 25% in weight, the trial showed efficiency of 22,7%. It seems a low difference in effect, but might make a huge difference with competition, hence, investors decided to reduce the value of Novo Nordisk.
China is continuing execution of its long term goals to be the leader in the field of electric vehicles in the future period. The news published by Reuters, points to a Chinese company Nio which has introduced its new EV car model, with the aim to compete with Mercedes SMART and BMW Mini electric vehicles. Nio`s EV will have the same price as German carmakers on China's market. Germany's auto industry is already facing difficulties with car sales, where China was one of the main markets, after Europe.
Crypto market cap
It was a hard week on the crypto market. Unfortunately, this was also the last actively trading week for this year, before the Holiday season in the Western markets. So, what actually happened? The Fed managed to spoil Holiday fun and decided to revise its economic projections for the next year. In a fear of inflation which is expected to be persistent, the Fed is expecting to cut interest rates probably two times, in total by 50 bps. This is exactly what markets did not want to hear, considering that now the discount factor is higher, bringing evaluations into a correction. Also, it should be considered that borrowed money will be more expensive, from previous projections, which again might imply less funds for the crypto market. Total crypto market capitalization decreased by 7% on a weekly basis, although the drop in one moment was more than 10%. Friday's market correction erased some of the weekly losses. Daily trading volumes were also higher, to the level of $397B on a daily basis, from $297B traded a week before. Total crypto market capitalization increase from the end of the previous year currently stands at $1.622B, which represents a 99% surge from the beginning of this year.
Bitcoin was the one to drive the market sentiment during the previous week. However, BTC lost “only” 3,5% in value compared to the price from the end of the week before. BTC also lost $71B in its market cap. Still, when it comes to drop in value in relative terms, altcoins were the ones that lost the most during the previous week. The range goes from 10% up to 30% with some specific coins. The majority of altcoin lost somewhere around 20% on average. It could be noted that major coins lost much less in value from other altcoins. In this sense, XRP was down by 6% on a weekly basis, BNB dropped by 6,5%. Surprisingly, or not, ETH dropped by 12,5%, earning $57B from its market cap.
Considering coins in circulation, the increased activity continues. Stablecoin Tether withdrew the number of coins by 0,2%. LINK had an increase in the number of coins on the market by 1,8%, while Filecoin increased its circulating coins by 0,4% this week. The majority of other altcoins had an increase by 0,1% during the week.
Crypto futures market
The spot market was not at all pretty during the previous week, hence, the crypto futures market could not look much better. Both BTC and ETH futures were traded lower for all maturities, in line with spot market sentiment. However, there are also some positive developments, not all looks so bad.
BTC futures fell by more than 5% for all maturities. Still, on a positive side is that futures maturing from April 2025 hold the levels above the $100K. Also, December 2025 ended the week at the level of $105.710, while March 2026 was last traded at $107.990. This is a positive sign that the market still perceives BTC strong in the long run.
ETH futures had a stronger drop on a weekly basis, of around 12,5% on average for all maturities. The prices of futures fell below the $ 4K levels. December 2025 was last traded at $3.721, while March 2026 closed the week at $3.790.

TOTAL is super bullish (1W)TOTAL also appears to have completed a large triangle and entered a bullish phase from the point where we placed the green arrow on the chart.
The structure of this bullish phase is not yet clear, but it is evident that only the first wave of the bullish phase has been completed.
Currently, the price is in the second corrective wave, which will likely conclude in the coming weeks. Afterward, TOTAL is expected to enter the third wave, which is a bullish wave.
We have identified the upcoming targets for TOTAL.
In this corrective wave we are currently in, the market will experience pumps and dumps aimed at liquidity hunting, so you should be cautious with your futures positions.
For risk management, please don't forget stop loss and capital management
Comment if you have any questions
Thank You

TOTAL CRYPTO BULLRUN END Q1 2025The total crypto market capitalization appears to be nearing its peak, as we are now in the final stages of the larger-degree Wave 5. Within this wave, we anticipate a corrective move in the smaller subwave 4 before the final push in subwave 5. This final leg of the larger Wave 5 is projected to drive the market cap to at least $4.5 trillion.

Total ChartAs predicted market gave us a correction and we got supported from our weekly zone. There is a chance it comes to the support once more and have a consolidation for a while and continue to push upwards.
If that happens we can have a discount on already discounted alt coins. So be brave and don't trade with emotions, but the dips and you'll thank me later.
DYOR
Goodluck
