TOTAL 2 :Total two, this candle can be continuous, so if you have a long altcoin position, you can not close it, but at your own risk 🙂
It is not my strategy to open a short position
TOTAL2 trade ideas
TOTAL2 - Sideways PeriodsThree boxes, movements within each are often sideways leading to bull moves
Currently we are experiencing a bull move on TOTAL2.
Lets goo

TOTAL2 - Bullish Above Downtrend A down trend can be drawn using the previous highs peaks
Price has risen above this trend line currently and is finding support above it
This is a bullish scenario with the further breakout upwards just a matter of time to occur.
Daily chart

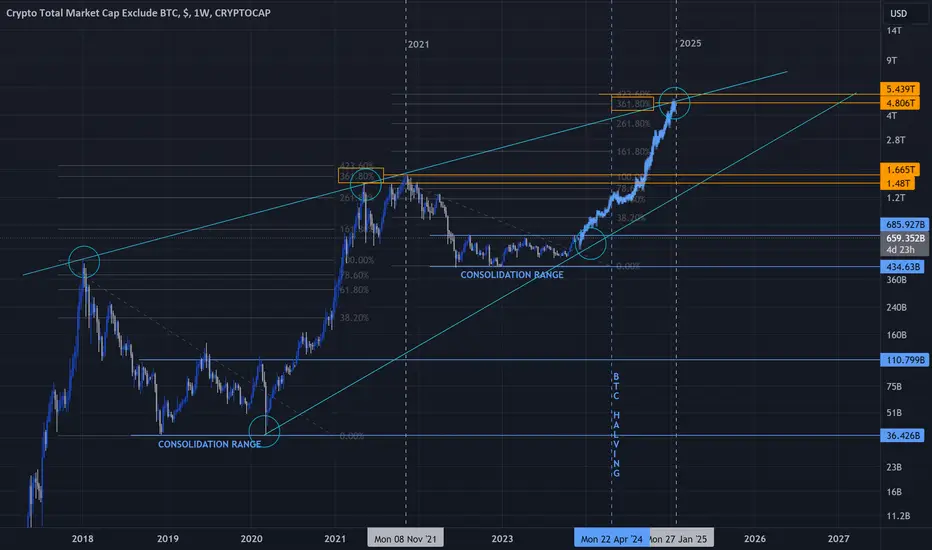
Time is Ticking- Simple as usual, everything in graph.
- BTC Halving is around April 19-2024.
- And of course it will be the main influencer for others altcoins.
- Without TheKing Cryptos are nothing.
- Cryptos Markets in 2021 :
- 1.5T to 1.7T
- Forecast of Cryptos Markets in 2025 :
- 4.8T to 5.5T
- Charge your bag and don't miss the train.
- Play always what you don't need for living.
Happy Tr4Ding !
Altcoins W pattern- Fast update
- All in graphic like always.
- if Altcoins breakout this range.
- the speed of the acceleration could be surprising.
- DYOR " W pattern ".
Happy Tr4Ding !

The new rally of altcoinsThere is a possibility of repeating the repetitive cycle of the altcoins market according to the above chart.

$TOTAL 2 chart is weakening?#TOTAL2 Total Marketcap of #altcoins incl. #eth #sol #bnb #xrp and all #altcoin market cap index has severe weaknesses such as bearish diamond pattern (diamond sends backs the price where it pumped from) and bearish RSI divergence in LTF.
Invalidation: #totalmarketcap 2 , reclaims ~ 1.25 Trillion #usd zone with weekly close.
Not financial advice.

a bandIt has a red resistance band in front of it.
Breaking this resistance band can lead to interesting growth of altcoins

Crypto to launch into the stratosphere- Ethereum ETF approval is one of the most bullish fundamental catalysts in crypto history, very likely THE most bullish event for altcoins in general
- Trump saying publicly, on camera that he will take care of the nation´s 50 million crypto holders is positive and by itself also very, very bullish
- rising wicks imply rising demand but consecutive rising wicks on the 3W time-frame imply serious upside pressure
- first target of the entire crypto market cap is 3T
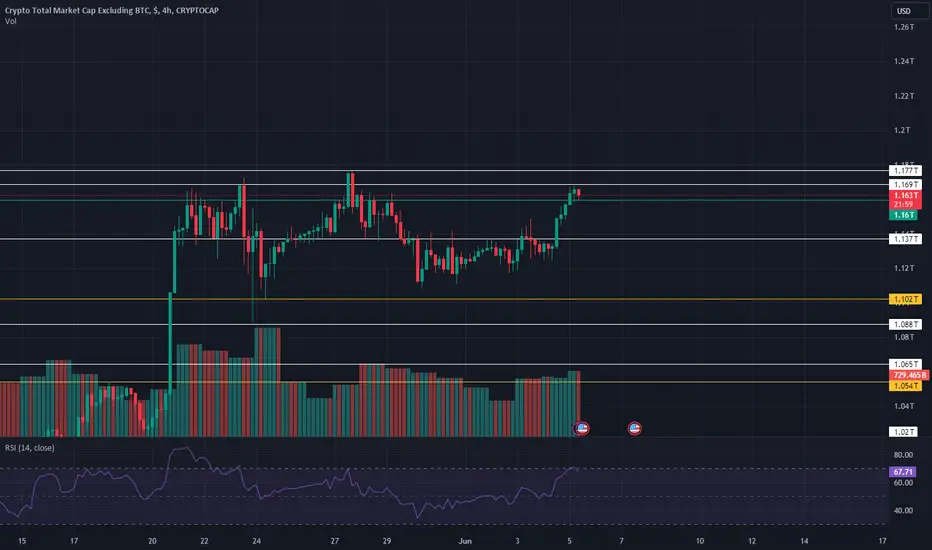
TOTAL2 :Total Two only approves Ethereum and gives why, because Total Three is a complete box
Ethereum moves faster than Total 2, so don't wait for Total 2 to break
Ethereum moves soon after breaking 1.16

TOTAL2 - Monthly Strong Bull Phase BeginsIn each circle the alligator indicator can be seen to be stretched out or "open"
When in a state like this bull action is most common
This is the Monthly timeframe so patience is required for big gains, regardless we will be seeing more green days than red.
BULLISH

TOTAL2 (Crypto Alt) will go +800% in 12 MonthsFrom Dec 2016, TOTAL2 increased +94,000% for 12 months.
From Nov 2020, TOTAL2 increased +1,180% for 12 months.
From June 2024, TOTAL2 will increase ____% for 12 months?
BTC expected to go +200% within 2024.
BTC.D expected to drop within 2024.
= Alt market expected to go more than +200% within 2024 (I am expecting about +300% in 2024)
In 12 months total, I am expecting TOTAL2 to go +800% within 12 months.
Let's see whether history will repeat itself

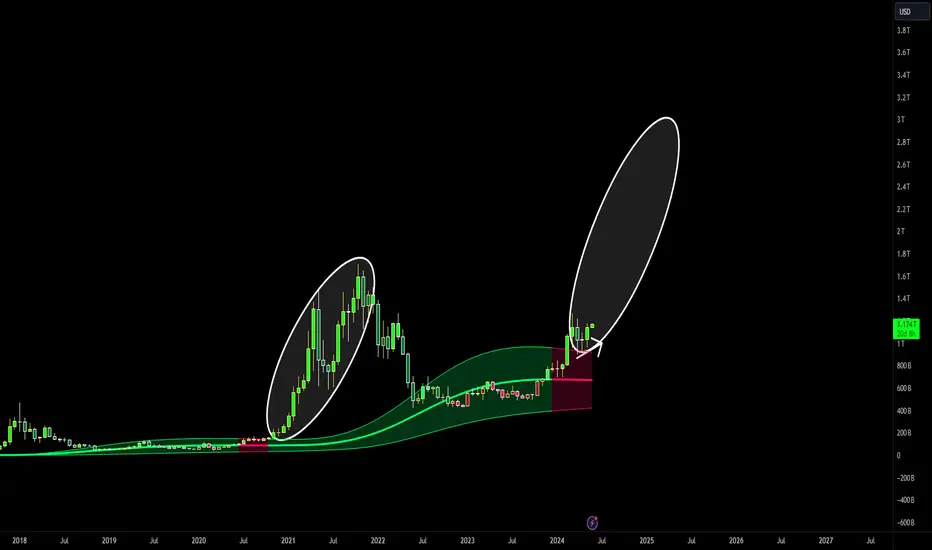
WHY This is ALTSEASON ?? 💥💯 Cycyle 3: Rising of the Altcoins !WHY This is ALTEASON ??
Cycle 3 // Bullrun 3 💥💯
Lets see on Total2 Marketcap
Look closer..
Volume: ✅
Significant volume increases in the bottom zone point to a trend reversal.
Gaussian Channel: ✅ (green)
as with other trend reversals, the channel changed from red to green
Level2: Bullish Area ✅
See on chart
Media Attention: Starts ✅
Ethereum ETF: On the road ✔
BTC Halving: On the road ✔
FED Interest rate cut: On the road ✔
Global Adapt: On the road ✔
...these are the known ones
I would like to approach the subject from different angles.
NVIDIA ? hmm.. Why Nvidia ?
>>Now I will show you the comparison of major altcoin charts with nvidia. this will mean a lot to us.
ETHUSD/NVIDIA
This is Real, Details on the chart.
XRPUSD/NVIDIA
>This chart shows us XRP times
TOTAL2/NVIDIA
> Lets see buy zones
AND JUST NVIDIA
Total2 is now on a bullish eve.
You see the technical levels. We are above the trend midline and this zone is a strong support.
In the back we have mayer multiple bands and gaussin channel in colour.
Analysis plain and simple. now only patience.

LONG RED OR GET REKT!Evening fellas,
I hope you took adv. of this previous drop.
Hopefully you noticed the fact BTC dropped more in % than most alts.
Means that most alts bottomed with their /btc pairs and are ready for gains.
If BTC starts to range here ($56k - 61k) for a few days, a small 10%, dominance could drop, allowing alts to run nicely.
Trade thirsty!

inexperienced retail hodlr/seller, just copy of last chartJust another copy of last chart, not convicted on this, it was just a random path i picked after observing


Alt coin market cap going to 3 TIf you observe Alt coin market cap. There is tremendous room for growth. Still time to enter in best positions in few top Alt coins. Bitcoin can give you profits but the best alts can make you wealthy.

ALTS TOTAL2 Chart Updated TargetsHello traders and holders!
Today we can see the altcoins market getting out..of the choppiness
This is not yet confirmed. Next 2-3 weeks are very important for alts.
Yellow targets are for year 2025
peace✌️💲💲💲💲


TOTAL2 can still touches the local low againCan it be, in yellow, a flag pattern?
Price has just cutted through during downtrend and already touched the target (pink arrow)
But as long price stays down the 200MA (red) and down the blue trend line, it may again touch the local bottom

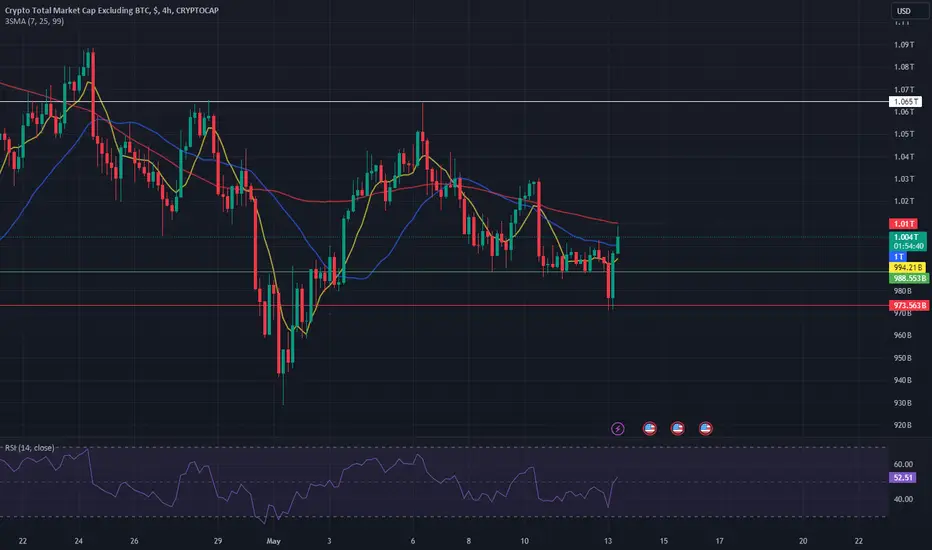
📈 Crypto Total Market Cap Excluding BTC: Bearish Continuation We are going to be looking at this chart through candlestick reading for learning and entertainment purposes.
—TOTAL2 Weekly Chart (Notice the numbers on the candles)
1) This is the peak. The candle closes red. The candle closes as a Doji. Volume starts to decline soon afterward. These are bearish signals.
2) This is the initial market reaction to a new peak being hit, a sudden sell-off.
3) The initial panic reaction is quickly erased but the ensuing candle fails to produce a new high. This is a failure to move forward. Works as bearish confirmation of the peak candle (1).
4) This is the initial move down.
5) This is the breakdown and bearish confirmation.
6) This is a bearish consolidation. See how the action is happening below EMA10. This consolidation will lead to a bearish continuation. A bearish continuation implies a lower low compared to the session 8-April (5). This lower low can find support around EMA100 or 750B, which means a potential 30% drop.
—MACD Bearish cross
The MACD bearish cross supports all the bearish signals mentioned above.
Thanks reading.
If you enjoy the content bless me with your boost/likes.
Leave a comment with any questions, or feel free to comment if you have anything to share.
Namaste.
