The REAL Crypto HALVINGWe are going to have a few weeks of down only and there is nothing you can do about it.
Half of the crypto marketcap is going to vanish in a quick tempo before things start looking bullish.
Buckle up!
TOTAL2 trade ideas

ALTCOINS - Stay away! It appears that the overall market is experiencing a weakening trend. Suppose BTC continues to decline from its current position; the Altcoin market cap is expected to break below its recent uptrend. This could potentially lead to a significant drop in the altcoin market cap, down to around 300B. Given these circumstances, it may be wise for individuals to avoid investing in ALTCOINS for now and instead wait for more favorable market conditions to emerge.
Note:
The US interest rate has reached the same level as it was during the onset of the 2008 Financial Crisis market decline. This should be taken into consideration. Despite this, on Twitter, someone claims almost every other day that BTC will reach 100k soon. However, in my opinion, this is complete nonsense. Given the current state of the financial market, it's not ready for a sustained uptrend.

TOTAL2TOTAL2
Analysis
TOTAL2 is the total market capitalization of cryptocurrencies, excluding the total capitalization of BTC.
The chart clearly shows the formation of a bullish wedge. This is a technical analysis chart pattern that usually heralds a future uptrend.
📐A bullish wedge forms when the price range narrows and trading volumes decrease.
Usually, the exit from the bullish wedge occurs upwards, with a breakout of the upper trend line. This signals a resumption of the growth trend.
It is worth noting that you need to use additional indicators and analyze the news background to confirm the correctness of your forecast. Always trade responsibly and with a cool head.
If you like the idea, don't forget to subscribe and rate like👍

Total capitalization of ALTsPotential inverse Head and Shoulders, in case of breaking up resistance, we will observe pump and growth in the market
Not a financial advice

ALTCOINS - Bullish Weekly OutlookNow that I have shown you the daily outlook on altcoins in my previous post "ALTCOINS - At Critical Support" Lets take a look at the weekly timeframe.
The weekly timeframe also shows us that we could see a significant rally for altcoins as long as this level holds. The first thing to note is altcoins showed strong buying pressure around the $430 billion marketcap which was the top of our 2017 bull market. Old resistance = New Support.
The next thing to note is our descending trendline of resistance from our high of $1.7 T. We recently broke above this trendline in early April and are now retesting it as new support! If this level is to hold we could see a marketcap of $700 billion or as high as $900 billion!

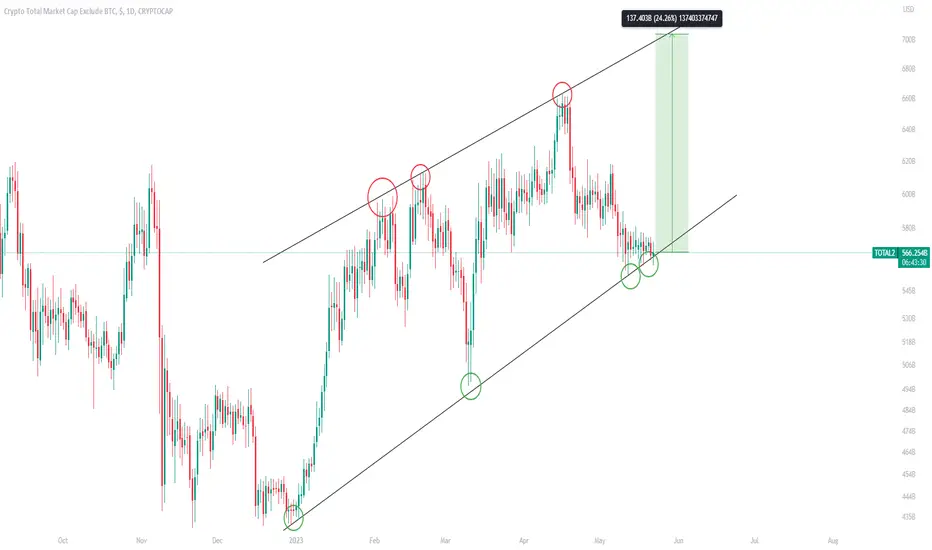
ALTCOINS - At Critical SupportHere we examine the Total Crypto Market Cap excluding BTC. This shows us the market cap of all cryptocurrencies alternative to BTC. This is an important chart as it gives us an idea of when we might see a mini "altseason". Let me stress that altcoins can be extremely volatile in periods of sideways chop for BTC, but if we are expecting BTC to go up (as stated in my last BTC post" we could see a bid on alts as well.
Right now Alts are at critical support around $560 billion. If this level is lost, alts can lose up to $130 billion as they would be set to test their lows around $430 billion. If alts are to hold this level of market cap then alts could gain around $140 billion bringing us to a $700 billion marketcap (+24%) across altcoins.
CRYPTO projection for 2023Starting from june i think Bitcoin will start going down , and will drag market cap to the downside.
Until february 2024 i think market cap of crypto is going to tap in to that 175 billion region.
Things are not looking good for bitcoin right now , i think bitcoin is going to revisit 30k level and then start plummeting to the downside .

TOTAL2 Elliott Waves Analysis (altcoins)Hello friends.
Please support my work by clicking the LIKE button👍(If you liked). Also i will appreciate for ur activity. Thank you!
Everything on the chart.
Looks like we have correction in form of flat(3-3-5). If markup is right soon we should to see upward movement.
Entry: market and lower
Main target zone: 720 - 780B
cancellation of scenario - 500B
ALWAYS follow ur RM .
risk is justified
Good luck everyone!
Follow me on TRADINGView, if you don't want to miss my next analysis or signals.
It's not financial advice.
Dont Forget, always make your own research before to trade my ideas!
Open to any questions and suggestions

#TOTAL2Well, it got rejected. If it goes above 572.637, you can open a long position at 564.169. Open a short position, but the main entry is below 556.867.

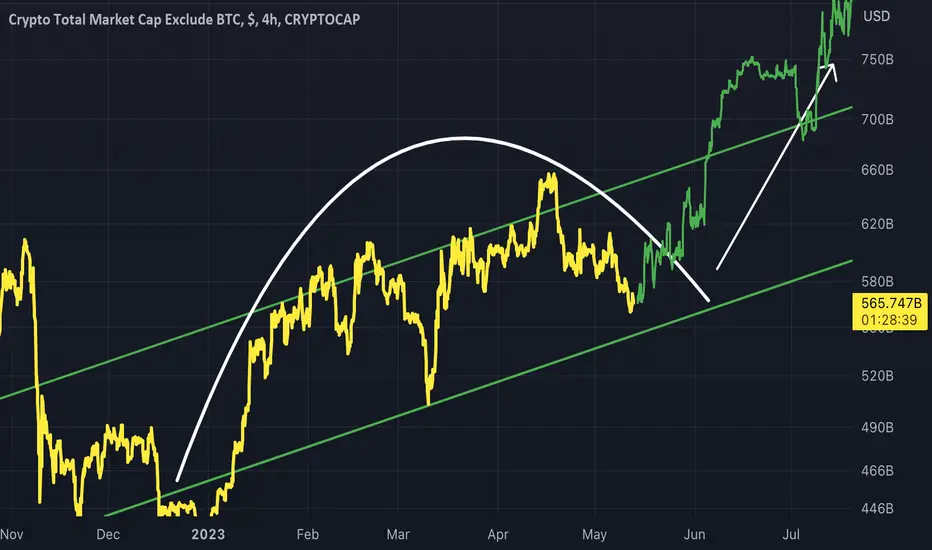
TOTAL2 - Rounded TopA Rounded Top structure on TOTAL2
This rounded top will result in an upward movement once completed within the channel
I have plotted an example upward movement with the bars pattern tool in green

Altcoin Apocalypse: Is This the End of the Crypto Revolution?Unfortunately, Altmarket cap isn't looking promising at the moment as we have just broken out of the head and shoulders neckline. This is a bearish signal for the market.
What can we expect next?
Based on the current price action, it is likely that we will retest the neckline as a resistance level. If the price fails to break above this level, it could confirm the validity of the breakout and lead to a further decline. In such a scenario, we might see the market cap dropping all the way back to the 501B level, which is a significant setback for the altcoin market.
It is crucial to monitor the 500B level closely. This level acts as a key support, and if it is breached, it could trigger a more pronounced downtrend, pushing the market into what some traders refer to as an "oblivion black hole."
To help you navigate these uncertain market conditions, I will provide periodic updates to keep you informed and minimize potential losses. Remember to trade cautiously and make informed decisions based on market analysis.

TOTAL2 Move up within ChannelBars pattern placed shows a bull move up channel towards the top
I do expect a little dip first but then the bulls to return
current update thoughts on the market cap chart

Total 2For the short position below 595, you wanted to open too soon, below 592, for the long position above 598, it will confirm you.

So Bullish I like to look at the longer time frames for buying opportunities. From this prospective one would see that this cycle is still processing. All of the American marketers are polluted with low interest rate money since 2008. I suggest looking the S&P500 with the same time frame.

TOTAL2 Different Top Scenarios The recent bull market pushed price into a higher high scenario.
This shows that there is still movement upwards left in the pump.
While the 2017 one shows a lower high, a normal double top, leading to a strong bear market.
Perhaps the bear market we are seeing now will be shorter due to this factor.

AltCoins (Season) ? Chart Prediction?This chart is becoming look, more relevant ,each day now!
Why? Firstly because the ETH can lead the Altcoins Season Start
But Leaving ETH aside.. this chart is also bullish at the moment
We wait for a clear signal ,similar to what we got in the past
I hope i am wrong with my estimations, and we break out higher and sooner ! (regarding the old All Time High)
Happy Easter Everyone !

Alts pump we have good demand here! We can see clearly where are demand zones and supply. Good luck!

257 Billion Looking at this chart. I see the price going to twoo hundred and fifty seven billion dollars. This could take many months to complete, but nevertheless.

Total2 Altcoin Market Cap 1 week USDTotal2 Altcoin Market Cap 1 week USD
1-2-3 Lets go...
3 different cycles but 3 similar pattern
I think the Altseason is coming soon
be patient

Alts could not brake out the supply zone!Sad but that is reality. See where is demand zone may jump from there.

TOTAL 2 Idea on chart mostly. The short term range broke down brutally and my ideal buy zone looks like it most likely wont hold. The risk reward for me is currently favouring more lows, with the TOTAL chart acting as confluence. Shorted FTM from .53 and looks like more downside is likely. Bounces get sold below resistance which is likely longs covering.

ALT COINS Made a major bullish break-out above the Falling WedgeThe alt coin market (TOTAL2) broke last week above the Falling Wedge of the Bear Cycle that started in mid 2021. Currently we may be seeing a pull-back that may put the 1D MA50 (red trend-line) and 1W MA50 (blue trend-line) to test as Supports.
On the long-term though, this break-out along with the formation of the Inverse Head and Shoulders (IH&S) pattern, targets much higher and more specifically the 2.0 Fibonacci extension at 1.135T.
Note that it was the 1D MA50 crossing below the 1W MA50 in mid February that confirmed the long-term downtrend and similarly, it will most likely be last month's 1D MA50 crossing over the 1W MA50 that confirms the long-term uptrend/ Bull Cycle.
-------------------------------------------------------------------------------
** Please LIKE 👍, FOLLOW ✅, SHARE 🙌 and COMMENT ✍ if you enjoy this idea! Also share your ideas and charts in the comments section below! **
-------------------------------------------------------------------------------
💸💸💸💸💸💸
👇 👇 👇 👇 👇 👇
