Total3 grow up to 750B then fallsTotal3 (market cap excluding BTC and ETH) grow up to 750B
and in 2024 will fall to near the previous floor
@JalilRafiefard
December 22, 2023
TOTAL3 trade ideas

When ALT SEASON starts in cryptocurrency market?Well, Total3 chart is best indicator for alt season and currently trying to enter bull territory.
Once we enter mega pumps will start one after another.

Break & hold 500B and we fly higherIf total 3 breaks and hold 500B altcoins are going to move higher, fast! Get ready, its coming. There is nothing but air until next resistance

$BTC vs $ETH vs $TOTAL3Let's compare CRYPTOCAP:BTC vs CRYPTOCAP:ETH vs CRYPTOCAP:TOTAL 3 (= NO #BTC or #ETH)
These are all showing negative divergence on RSI & $ flow on daily.
(Showing 2b cautious, this is NOT reason for a TRADE)
#ALTCOINS have done VERY WELL, They are currently OVERSOLD & can remain that way for a very long time, just saying.
They did it from 12/2020 - 5/2021
Then peaked 11/2021 after ATH
Please see profile for more info..
Not all charts here.


ALTSEASON as the final of the technical moveHey All!
I expect TOTAL3 growth in the near future In the range of 450-500 billion
Regards,
Eugene

total3 Daily time frame review and analysisIn examining the TOTAL 3 chart, we notice that, like the TOTAL 2 chart, HC XVTD is contrary to the movement of .ETH. BTC. TOTAL. In addition to the fact that it is not even close to the supply area, it is also failing and stabilizing above a supply level, which is an important indicator that with the recent growth of Bit and the analysis of the upward trend in the TOTAL2 chart, we should be more mindful of the occurrence of alt seasons.

second zone for alts total3As expected alts have corrected heavily and I felt the need to add a second blast zone. This area offers much more support on two prior double tops. Stay safe out there gang.

Total 3 Market Cap 1d is bullish It is showing bullish signals, so I hope to continues its magic specially for the FED announcements tomorrow.
We have a a target at the top and it retested the the falling wedge successfully.
All the best insha Allah!

TOTAL3 Is Bullish.Total3 is Bullish it can go higher.There is a order Block Below and Price has Taken the LTF Liquidity.Also makes SnR Liquidity on the Top.There is also a Weekly FVG on the top of the SnR Liquidity. So my expectation is bullish.

Altseason Indicator. Capitalization excluding BTC ETH USDT USDCLogarithm. Time Frame 1 week. Understanding the capitalization and growth potential of altcoins without BTC ETH and top steiblcoins USDT, USDC and DAI gives a brighter and more accurate picture of the timing of the start and development of that long-awaited altcoin season of more pronounced scale than now on 16 10 2023 - at the time of publication 8 12 2023.
1) The capitalization of these assets has long been in a squeeze - consolidation, this is a direct correlation with the accumulation zones. We are conventionally in the final phase of accumulation (almost).
2) Please note that there has been no real capitulation (perhaps there will not be, and if there is, it will be V figuratively, but that is not the point). Very much emphasize your attention to the timing of the length of this phase and past late 2018 and 2020.
3) Also note to your eye that at that time 2018-2020 there was not such a big capitalization outperformance from the rest of the BTC and ETH market. Compare that to the situation now, how much other altcoins are "undervalued" speculatively. You also need to realize that there is a correlation with stablecoins and their huge portion of the overall market compared to the time before.
How to enter these parameters on tradingview? .
In order to capitalize alts from TOTAL3 (initially without capitalization of BTC and ETH) and exclude all large-capitalization stablecoins from it, you need to do the following:
In the ticker entry line in tradingview write:
CRYPTOCAP:TOTAL3-CRYPTOCAP:USDT-CRYPTOCAP:USDC-CRYPTOCAP:DAI .
Accordingly, a chart is created that subtracts the capitalization of the designated stablecoins (USDT, USDC, DAI) from TOTAL 3.

Total 3 altcoins indecisive I called that last total3 washout with the marked candle bodies. This allowed me to sell some of my more recently bought tokens to get a lower entry. I was able to get better DCAs on Link, PYR, ILV, and a few others. The chart now finds itself at an inflection point. Attempting to get back into the greater channel, but resistance is winning. Total3 climbs to that green fib slowly with BTC also on a heavy uptrend. We have been on a bullish supertrend since late October. Our fallback zone is this red dashed line which is a prior weekly double top. My bullish target is the green fib around 500b mcap. This is a 32% upside vs a 23% downside. Stay safe, I am not trading this as I got most of my altcoin entries nearly a year ago at this point. The market is overheated imo.

Santa Rally for Altcoins on the cardsTOTAL3, an indicator of altcoin market capitalisation excluding Bitcoin and Ethereum, has made a significant move🔔.
We've breached and closed above on a weekly timeframe some serious key levels. And are above the Bear Market high.
By surpassing and maintaining above the bear market high on a weekly timeframe.
While this doesn't mean we won't see a pullback in the near future, it does set up some nice space to move leading up to the BTC halving.
It also comes at a timely point in the macro landscape, with the US monetary policymakers this week agreeing that rates will be dropping in 2024. With 3 rate cuts planned at this stage.
These tailwinds, combined with Bitcoin potentially ranging, could see a swell of liquidity returning to the #altcoin markets.
🎅 #SantaRally?

Greater the risk, greater the reward, therefore, alt coins.I often hear that we deserve a greater reward, if we take a greater risk in the crypto market, and I agree. I also agree that I should be rewarded for simply getting out of bed in the morning on the right side of the grass and I also believe that Dua Lipa's thighs could squish my head like a grape. So, in order to avoid such risks, I like to ensure my selection in alt coins exceed the performance of not only BTC and ETH, but more importantly the ETH killer SOL and the TOTAL3 index, and my head, well unfortunately it remains unsquished.
This graph illustrates the results of my risk/reward policy. They also say that past performance is not indicative of future results. Well until I can start to see into the future, make a person's head explode by mere thought or even begin to understand why the SEC thinks it has a right to enforce its policies outside the USA, this is the best I've got.
The Sublime Prince
Toronto, Canada

Alt Coins have a long way upIf we take a fib line from top to bottom, we have not cleared the 0.236 level.
The yellow dotted line is the weekly close on the july 2021, which will have some resistance.
A close above this line will be extremely bullish for an alt coin season
Bitcoin is already sitting at the 0.382 level, and i would think that the alt coins want to catch up.
As it stands, the 3 day is overbought on the rsi, but it looks like we are going to have a strong close at the end of today - im hoping that it closes above the dotted line
Last cycle we didnt manage to close above the 0.236 level on the first attempt, and fought for 2 weeks to get above.
After that, it REALLY was alt season

TOTAL3 Bearish OutlookTOTAL3 Market Cap could drop to 380-375B USD, hopefully not lower.
4H candlestick chart indicates exhaustion and RSI has reached oversold for the first time since 9th october, indicating a downtrend.

Pure TOTAL3: next hot zone is $482BBy Harmonic patterns, we can define the next zone.
Many Fibonacci numbers are concentrated in the $482B area.

ALTCoins Hanging by a ThreadAfter 294 Days of freefalling to a crash landing and 378 Days of sideways PA ....
The ALTCoins may still be looking for a bottom.
Failure to find acceptance into and to break out of Range 3 could potentially lead to a move down to Range 2, with a downward target between the .382/POC Levels (-33% from current PA) and the .618/.66/VAL (-59% from current PA).
Worst case scenario would be a loss of Range 2, which I believe would end with a move to the .88/POC of Range 1.
------------------------------------------------------------------------------------------------------------
While looking at these charts right now in the current economy, its easy to get discouraged...patience is key! Stay positive, there is a lot of potential opportunities to come. Do your due diligence, make a plan, and stick with it !
------------------------------------------------------------------------------------------------------------
I hold spot in serval ALTCoins, and plan to DCA the way down, if indeed we do see a move down to the lower ranges.
Drink more water, exercise and trade responsibly !
*Not financial advise*

TOTAL3Greetings,
TOTAL3 (amongst other tickers) is an incredible useful tool that is provided from @TradingView
TOTAL3 shows the total market capitalization of the top-125 cryptocurrencies, excluding BTC and ETH.
Today we're looking at this puppy on a small time frame, due the amount of volume and change in price action we've been seeing.
On chart provided we can see the two red lines being resistance points (major), these lines were added in many years ago and have not been moved. I just added a dotted yellow line which shows current minor resistance point.
Although i've added 'short' on this post. I will let you decide for yourself.
Remember, nothing is guaranteed, control the controllables.
Mogues

Total3 Chart Analysis: Strong Resistance! 📉⚠️Today, let's turn our attention to the Total3 chart (excluding BTC & ETH), where a compelling narrative unfolds. The chart currently finds itself in a precarious position, trading within the vicinity of a significant resistance zone. Caution is advised, as potential corrections may be on the horizon. Here's an in-depth analysis of the chart dynamics and what to anticipate in the coming sessions. 📊🔍
Analyzing Total3 (Exclude BTC & ETH): Charting the Resistance Zone
Encountering Strong Resistance:
Critical Zone: Total3 is navigating a zone of formidable resistance, marked by historical significance on the charts.
Chart Context: This resistance is crucial as it has played a pivotal role in the past, influencing market dynamics.
The Challenge of Overcoming Resistance:
Testing Bulls' Strength: The current scenario poses a challenge for bulls, as breaking through this resistance demands considerable strength.
Potential for Corrections: The prolonged interaction with this resistance zone raises the likelihood of corrections or a pullback.
Anticipating a Retest:
Trendline Retest: The analysis suggests an imminent retest of the trendline previously breached by Total3.
Validation Check: A successful retest would validate the strength of the breakout, offering insights into the sustainability of the upward trend.
Cautious Approach for Traders:
Risk Management:
Protecting Gains: Traders should consider implementing robust risk management strategies to protect gains.
Volatility Awareness: Acknowledge the potential for increased volatility, especially around the resistance zone.
Watching Trendline Dynamics:
Retest Confirmation: A confirmed retest and subsequent bounce off the trendline would instill confidence in the continuation of the upward trend.
Failure Warning: Conversely, a failure to hold the trendline may signal a shift in market sentiment.
Conclusion:
Total3's encounter with a substantial resistance zone necessitates a cautious approach. Traders should monitor the dynamics closely, with a keen eye on the potential retest of the trendline. The outcome of this interaction will likely provide valuable insights into the market's next moves.
❗️Get my 3 crypto trading indicators for FREE!
Link below🔑

Best case scenario for total3Total3 , best case scenario 800B give or take 50B imo, coincide with pure alpha fib cluster , and mid channel . And then a C wave ,perhaps z flashout inside the accumulation range drawn in black.
This is not a financial advice .
Thank you

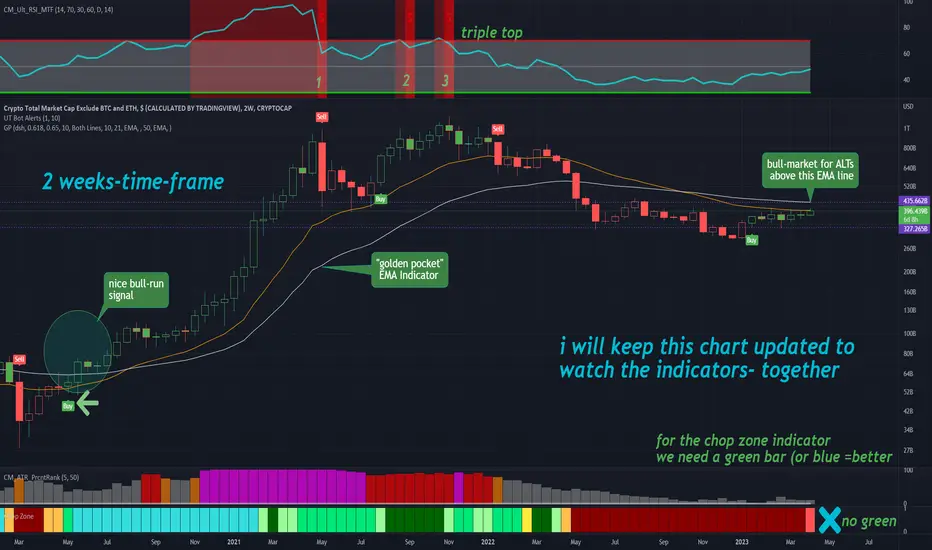
ALTCOINS BullRun Chart Update I found out this interval (two weeks) is working good with this chart (altcoins total3).
We can see in the past we got a very nice signal (a few signals) that alts will enter a bull cycle.
We can only expect for this strategy to work ,and get a similar pattern-signals in the near future (if we are bullish).
If you don't have access to this this indicators (maybe using free version), i will keep updating the situation (good or bad).
Total 3#TOTAL3 is proving us right once again. #TheCryptoCity analysis is just perfect. See how beautifully green candles reached the level of 454b, The rally you are currently watching in #ALTS is because of TOTAL3.
Flipping 454b and now trying to retest it makes TOTAL3 even stronger. We are hoping it will stay above this level and ALTS will keep on going crazy.
We will share some ALTS analysis soon, stay connected and Always trust TheCryptoCity
