TOTAL3 is getting even closer to a breakout?look how the Convergence and
divergence with the Price action
and RSI move together...this is an
example of how charts work...we
have never been this oversold...
big things ahead for the ALT coins.
TOTAL3 trade ideas

Moment of TruthIf history is an indication to guide us in chart analysis, we are at a detrimental moment.
In December 2018, Total3 bottomed at -59.33% from the 200day. Now (if we have bottomed) we had a -54.10% from the 200day (close enough to me).
In 2018, Total3 spent 315 days under the 200day, now we have 273 days under the 200day.
We have 42 days to go which will bring us to early December coinciding with the
FIFA World Cup (The biggest Event in the world) has one of its official sponsors Crypto.com (coincidence?).
My take on all this is according to the following:
1 - Markets tend to surprise the majority of investors, so if the majority is bearish, the market tends to turn bullish.
In my research for the last few months, the majority of crypto space "people" had basically two views on the market:
a] BTC is crashing to 10k or below
b] BTC is having a relief rally while the Alts bleed
In this scenario, the only outcome that would prove the Majority wrong is a strong altcoin season with BTC retracing slowly but not getting close
to put a new ATH.
2 - Crypto Youtubers are always wrong, let me emphasise that, CRYPTO YOUTUBERS ARE ALWAYS WRONG. That is why they need to create new videos every day
so they can fix their analysis and change their theories to try to mirror the facts. Therefore, they are a good thermometer of what the herd will be doing.
Also, most Youtubers, are now cautious after the Terra disaster as lots of them were shilling Terra as the new Ethereum.
On that note, the retail investors are holding tidy their money because of what their cultist YouTubers who most likely have or either view a] or view b], are telling them.
They will wait for the BTC crash below 10k or BTC retracement alone. The majority of YouTubers are scaring people from the altcoin market, all saying BTC is the way to go.
Some YouTubers, still shill the blue ships like ETH, DOT, SOL, Link, ADA, DOGE, Shib and so on. So my take on that is that the majority of the retail will jump into the market
looking to ride the rise of those coins (BTC, ETH, DOT, SOL, Link, ADA, Doge, Shib, etc...). This brings us to an interesting point, if the majority is always wrong, the rise of those
projects is unlikely.
3 - What we call an altcoin season, is the massive rise of low-cap projects, sucking the market cap of BTC and ETH (now we can even say of all major top 5 or 10 blue ship coins).
That happened in 2017/18, therefore, that did not happen in 2021/22. Only a handful of coins reached their full Fibo extension. So we have now, coins that had their full
Bullrun and coins that did not have. My take is that, from the end of October to early February, we can possibly see an altcoin season, as it is the only scenario that will
fulfil the requirement of making the majority wrong.
4 - So this is how it should work: BTC turn bullish in 1 or 2 weeks from now and FOMO starts again. Youtubers start to go nuts and shill BTC like crazy. Some retail investors will either go all-in into BTC
or they will spread their money into ETH, DOT, SOL, Link, ADA, Doge, and Shib, expecting the past performance to repeat. Hence, those projects and BTC will not pump to new ATH, they will
in the most positive view, retrace to 80% of their previous ATH value. Here, some other projects that did not have a bull run yet (E.g. EOS, Litecoin, XRP, etc..), will be pumping hard which
will spark a FOMO into the altcoin market. The investors sitting on BTC, ETH, DOT, SOL, Link, ADA, Doge, Shib, etc... out of frustration will slowly capitulate into the other altcoins
trying to ride the wave. Even some big players will be caught pants down and throw millions into projects with no real value just to ride the wave. This whole money will keep rotating for around 3 months.
5 - After the majority of the top 300 (just guessed that one, could be more or less) coins have had their full fib extension, the whole market will crash, starting the real bear market that will last until about 2024/25.
6 - This scenario presents a BTC.D going down while its price goes up, which is another unpopular view right now as most YouTubers(cultists) are calling for a big pump on BTC dominance.
7 - It is also important to mention that, the SEC is in trouble regarding the XRP lawsuit (I do not have XRP in my portfolio). From my perspective, the SEC is set for a brutal loss that probably will bring confidence to the
the altcoin market fuelling the season, so please do not be surprised if the lawsuit finishes just within the FIFA World Cup timeframe, (coincidence?)
8 - One of the recent modern ways to invalidate someone's ideas/thinking is calling it a "Conspiracy Theory", so right now is common to see people calling other people's ideas/thinking a conspiracy theory just because they don't like it.
This is not a surprise, every person with two neurons should know that we are heading fast to a new type of dictatorship based on absolute control of what you do, enforced by technology (cameras, mobiles, Internet and so on). So it is not unreasonable to think that a bunch of powerful people set these scenarios, FIFA Cup, XRP lawsuit, and Youtubers all saying the same thing. The herd, if pleased in the right way, can be manipulated, this is how it was, how it is and how it will always be. The 1% most likely sit down together to keep or increase their power/money, why wouldn't they?
9 - The herd is louder, bigger, hysterical, violent and dangerous, but they are also lazy, immoral, hypocritical, nonsense and disloyal. If you want freedom, follow the 1%, not the herd.

TOTAL 3: Falling Wedge Projection.TOTAL 3 is represents the Total Marketcap of the entire Crypto Market Excluding ETH and BTC anD right now TOTAL 3 is trading in a small falling wedge that itself is within a bigger Descending Broadening Wedge. If TOTAL 3 can Break, Hook, and Go from the smaller wedge it's Target will then be at the Supply Line of the much bigger Descending Broadening Wedge; Rather or not it will Breakout of the Bigger Wedge and Continue up from there is to be discused when it actually gets there, but for now the Smaller Wedge target is all im looking for.

TOTAL3 Altcoins Altseason?Is it about that time now? We do we got here?
AFter perfectly hitting 0.886, the altcoin market is in a perfect position to get things going.
While holding that level, an impulse from here can do great things
A) Invalidate this (bear looking) flag to the upside
B) Surpass that long downtrend
C) Target 1.272 up to 2.618 ideally into overhead resistance
Hold my beer pls
----
No financial advice, do your own research, don't be stupid

Alt Market Cap Not Looking HealthyAlt Market Cap Not Looking Healthy
The Alt Market cap has recently broken down on market structure and retested key resistance and 200EMA 1hr. Core issue is the consolidation directly below key resistance at 356 which is looking like a dump could be incoming to me to the next supprot level at 342. It could be a little rocky for alts in the short term.

Altseason?The crypto market (Total 3 - Excluding BTC and ETH), is showing a leading expanding diagonal type structure. If we hold these lows than we should move up in the coming days/weeks.


#TOTAL3 #CRYPTO Market Cap to lose over $100 bIllion DollarsWe are in the process of breaking down any hour now!
Inverted chart is shown.
(In my view --- just an educated opinion by a experienced market speculator)
This would account for it being a near 50% haircut on the #crypto market excluding #BTC & #ETH
This last down move could be sickeningly violent and really push out many participants unfortunately.
We all can't make it speculating, that would imply a fake market.
Profit come from other peoples money unfortunately.
What #ALTS are you holding, and i will scan the chart for you upon request.

ALT Market About To BreakALT Market (Excl. BTC & ETH) is looking primed for a breakout with some narrow consolidation forming for almost a month now. Expecting a large break out coming out of this symmetrical triangle. It will be very dependant on the global macro economics and announcements to dictate this next move

Rebounce alt ?We could to except a bounce of the altcoins from here.
It could to be a great support to next resistance.

ALTCOIN Bullish idea !Here is the analysis of Altcoin Market Cap Exclude Etherium Total 3 Making Falling Wedg + making Cup With handle Chart Pattren And Recently price tapped from VAL of tool FRVP finnal W8 for break out and retest and you can see alts in bullish action ......

WEN ALT SEASON Charting TOTAL3 (alt market excluding BTC & ETH) vs both BTC & ETH looking very bullish for ALTS.
TOTAL3/BTC:
2 scenarios in Blue or Green. This is based on Elliot wave theory in which on lower time frames shows correct counts for this leading to breakout. WEN is the question?
TOTAL3/ETH:
Break the red resistance line with a retest could start a face melt on ALTS

Cryptocurrency Marketcap, excluding Bitcoin and Ethereum(TOTAL3)Excluding the market cap of BTC and ETH, we get the TOTAL3 value. As you can see this market cap is just at the January 2018 ATH levels. The current market cap is now around the 363 Billion USD level.
As you can see from the bigger picture this is a journey back to 2018 January. The market lost approximately 4 years and 10 months. This is a huge mountain to climb.

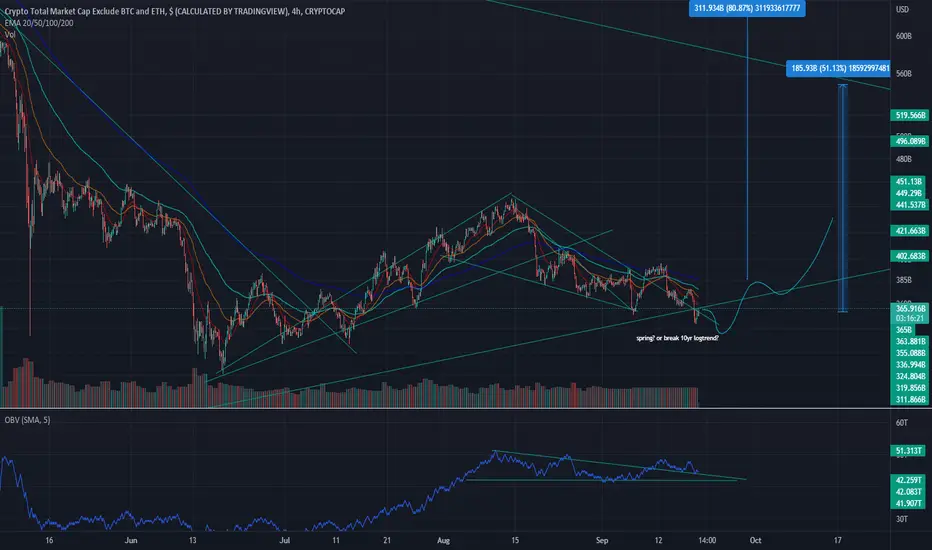
TOTAL3alts mcap no ethereum
looking like a spring to back above trendline
should see some alt releif coming 2 months or so?
otherwise its a long way down under that line..
potential for 50% ish from here if we can stop the selloff..
this is a look at BTC ETH DeFi ALTS & S&P500 2017-Presentthis is a look at BTC ETH DeFi ALTS & S&P500 2017-Present
_(ETH GREEN NTC DARK ORANGE DeFi IS WHITE ALTS dARK pURPLE AND S&P500 IS THAT DARKER PINK)
its funny when some one argues with a, to the death mentality, that "there is no correlation with the S&P500 or other markets. Look, correlation, in it self is subjective esp in the "market context speak" we all use. All money is in some shape form, push pull, all connected. cause and effect. The goal here is to measure or guess the best we can the strength of these, "cause and effects" while anticipating human nature or stampede mentality up or/and down.
As to more direct correlation with S&P500 vs BTC or vs Crypto Market, I would say that crypto is just becoming more main stream (more and more places to trade it) and easier to access and trade. So when the market sentiment is poor and markets "in general" are dropping, well crypto has made it, we are officially one of the markets and have enough liquidly sources to be effected by these same market/financial events. (Interesting point and not sure if directly related here but in general definitely a "Crypto factor" here_ is no limit of trades you can do in a day, food for thought)
not saying that anyone is RITE or WRONG here just that< I for one >have found it more profitable to NOT paint myself into the corner of one way of rigid thinking. In this hustle, it pays to think out side the box and use what works while being willing to adapt and change esp if one day, the same thing no longer works (obsolete)
iVE FOUND 2 THINGS VERY HELPFULL WITH MY TRADING THIS YEAR. bEING WILLING TO THINK OUT SIDE THE BOX, WHILE NOT SPREADING TO THIN. IE NOT TO MANY POSITIONS. (EVERYTHING SOUNDS AMAZING AT TIMES I KNOW. ESP WHEN NEWER TO CRYPTO) Tradermayne is an amazing follow fyi out there in the crypto social media world and really helped my overall trading and understanding of the markets and how I view them. that and not reading the crypto news esp NO T and A opinions until I make my trades or decision not to trade, trade, whatever the plan, for that day... i find to many outside ideas on the market messes up my reads. one thing to get others advice and none of your own opinions or plans if you just, that day week whatever, cant get "that feel" down about the markets.
_2ND IS HAVE A GENERAL PLAN STRATAGY WHATEVER AND STICK TO IT WHILE NOT TRADING JUST "TO TRADE". hAVE A PURPOSE IN YOUR TRADES
_in short, FIND YOUR OWN STYLE THAT WORKS FOR YOUR STRENGHS AND WEEKNESSES. TAKE THE PARTS YOU LEARN AND ADAPT THIS "advice" ETC TO YOUR STYLE BUDGET AND LIFESTYLE (EXAMPLE IF IM BOARD ILL PANIC AND START SWING TRADING JUST TO TRADE BECASUSE I FEEL I SHOULD BE TRADING.FOR ME LESS TRADES I DO USSUALY THE BETTER)
for the present me and mine/THE PLAN is_TO TAKE PROFITS EVERY LEVEL AND CHANCE I/YOU GET. I FEEL THE MARKET HAS ONE MORE SAVAGE DROP IN HER AND IT WILL HAPPEN FAST. WATCH WHEN LONG POSITIONS GET TO LOPSIDED. LIKE RITE NOW WE SEE SHORTS GETTING LOPSIDED AND ONE OF THE MAIN REASONS I SEE A "BEAR MARKET RALLY" IN THE CARDS, SHORT TERM , THEN DUMP AFTER bear market rally TO CLEAR OUT AND rekt REKT THOSE POSITIONS.

TOTAL3 looks prepped for a launch anytime?TOTAL 3 weekly chart:
The Long yellow rectangle support box may
be the most important support in the entire
Market as a whole. When there is around 19,000
Alt-coin projects relying on BTC holding and this
huge monster support box holding, this is Do or
Die...Im confident in the coming 300 days,
we will see all time highs in the TOTAL 3 market.
The Green $2.674 Trillion is my Super bullish
prediction coming from measurements. and the
smaller yellow rectangles are the falling bearish
support boxes....lets hope we dont see the candles
fall lower. The RSI has never been this OVERSOLD, we honestly should be moving up
bc we are in uncharted territories and sentiment should change.

clear wolfe wave printingthe total market cap for the alts has a good chance to rally after these beautiful wolfe wave pattern .


🔥 Worst Case Scenario For Alt-Coins: Huge Risk PotentialTo start of the discussion, I want to stress that history rarely repeats itself, but it often rhymes. BTC has, thus far, lost around 85% of its value from top to bottom after every bull-cycle thus far. Can the same be said for alts?
In the previous cycle, the total altcoin marketcap (which is the total marketcap minus ETH and BTC) lost around 92% of its total value, which translates to every altcoin losing around 92% of its value on average.
Since BTC follows a boom & bust cycle with the bust being around -85%, there's a reason to believe that alts will do a similar thing. In that case, alts have another huge 70% drop ahead of them. Naturally, this would be my absolute worst case scenario for alts which could only occur when there's a total meltdown of the stock markets (like 2008).
On the other hand, I doubt it will ever get this far. There's a lot of decent alts around and investors are not flocking to BTC as fast as they did in previous cycles, hence why the BTC dominance is still this low. Nevertheless, it never hurts to explore different potential scenario's.

watch btc.d for down or up trend ie btc.d dumnps market pumpsthe bottom screen is the market cap or spot price of Eth_dark green line btc_orange line and alts _purple line
middle screen u have thicker white line DeFi dominance thiner white line DeFi spot price or market cap
AMONG OTHER FACTORS THAT ORANGE TREND LINE MIDDLE SCREEN IS btc.dOMINANCE. WE NEED IT TO DROP a few other small things to but in short we need btc.d to fall off
that middle screen is a mess but if u see btc.dominance oarange line drops and plays with white line or DeFi market cap (money getting loaded up via eth and weth ie getting ready or entering market) then you see the market up trend as btc .d falls off and the rest of the market takes control. the same will be true for down trend but reversed.
i do like how btc dominance fell off and market went short term green .... u can see earlier the opposite is true. as BTC.D gains strength it leads the way dragging the market down as the indicator rises above the other crypto indicators in the middle screen
ps sorry so messy and ill find a better way to explain this indicator HGM 0Ut_

watch btc.d for down or up trend ie btc.d dumnps market pumpsAMONG OTHER FACTORS THAT ORANGE TREND LINE MIDDLE SCREEN IS btc.dOMINANCE. WE NEED IT TO DROP a few other small things to but in short we need btc.d to fall off
i do like how btc dominance fell off and market went short term green .... u can see earlier the opposite is true. as BTC.D gains strength it leads the way dragging the market down as the indicator rises above the other crypto indicators in the middle screen

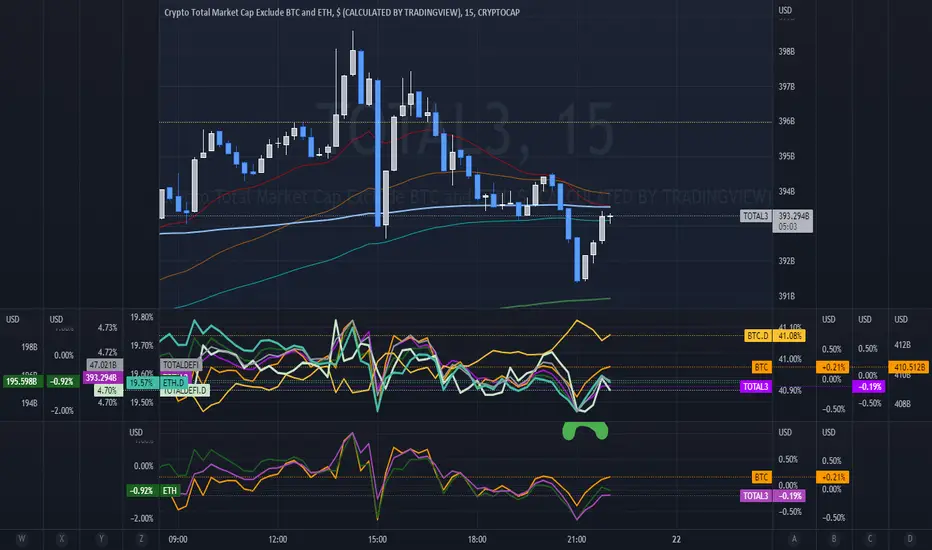
TOTAL3 chart "ALTs" shorter time frame lookTOTAL3 = (Total 3 chart or crypto market cap minus BTC n ETH ie ALTs)
I like how the middle indicator is dragging down that orange line or BTC.Dominance... we need the market to spread money out not HODL it in the main liquidity spots like BTC n BTC backed holdings like stable coins n n in some cases 3 or 4 steps out of crypto exchanges etc.
in short for this TOTAL3 chart we need to smash 420 to 460 could run at least short term if we see this chart break 460s n run to 550s
for that to happen we would need to see_
/BTC 22500 to 2400
/ETH 1660s to 1735
n want to see decisive break
through 1750 at that ie eth the key the gateway, the on n off ramp into the crypto alt game and beyond
/rejections or negative look at these levels singles short term esp.....> G3Ts 0Ut...
TOTAL 3 weekly still looking bullish overallTOTAL 3 weekly chart:
The Long yellow rectangle support box may
be the most important support in the entire
Market as a whole. When there is around 19,000
Alt-coin projects relying on BTC holding and this
huge monster support box holding, this is Do or
Die...Im confident in the coming 300 days,
we will see all time highs in the TOTAL 3 market.
The Green $2.674 Trillion is my Super bullish
prediction coming from measurements. and the
smaller yellow rectangles are the falling bearish
support boxes....lets hope we dont see the candles
fall lower. The RSI has never been this OVERSOLD, we honestly should be moving up
bc we are in uncharted territories and sentiment should change.
