Total 3 - Weekly Wave Count Total 3 - Weekly Wave Count
here we see the 382 pull back target. we want to especially combine the monthly chart for the candlestick close.
we want to see very good follow through and momentum as we hold this key 382 wave 4 support level.
TOTAL3 trade ideas

Total 3 - Monthly See how we are weeker without the big 2 (BTC and ETH)
keep in mind total3 chart is the total crypto market excluding bitcoin and eth.
which means you should be looking for alts that are more bullish. you'll know its more bullish if the monthly support is NOT breached and is holding above it.

Washing machineAltcoins are an incredibly dangerous market
Lucrative when you get in early
Punishing if you get in late
Regardelss of the quality of the team or particular project
These things are a speculative gold mine if properly understood but extremeley dangerous if misunderstood
Required understanding includes human/market psycology on a multiple timeframes and an understanding of physical systems, networks and financial tools aswell as a grasp on exponential and logscale maths, drastic % swings.
Beyond this as an investoor you should be careful when and how you approach this early marketplace, understand the halving cycles, the bull bear market portfolios/ the ratio of btc/eth/alts and the speculative frenzy that is the time to take profits.

Altcoin MC - on planExactly what I wanted to see here: a finished macro C correction. One last push to form the 5th wave of the last Y. Very optimistic times ahead.
Similar structure to Rona crash, except that one was way faster. Also, drawdown on both is almost the same in %.

WEEKLY UPDATE AND PROJECTION ABOUT ALL THE MARKETS 13 JUNE 2022Hi trader, weekly update which is more of our trade plan for the week and pls follow through and be guided.
breakdown: dollar index. btc , Stocks
tradehubng

TOTAL 3 weekly chart is sitting the biggest support in history.TOTAL 3 weekly chart:
The Long yellow rectangle support box may
be the most important support in the entire
Market as a whole. When there is around 19,000
Alt-coin projects relying on BTC holding and this
huge monster support box holding, this is Do or
Die...Im confident in the coming 300 days,
we will see all time highs in the TOTAL 3 market.
The Green $2.674 Trillion is my Super bullish
prediction coming from measurements. and the
smaller yellow rectangles are the falling bearish
support boxes....lets hope we dont see the candles
fall lower. The RSI has never been this OVERSOLD, we honestly should be moving up
bc we are in uncharted territories and sentiment should change.

TOTAL 3 TARGET 1 METTarget 2 is about to play out, called this months ago.
Hope this shows you the influencers are mugging you off when they are teaching you how to trade :)
Market Psychology is the most important thing, emotional intelligence.
@mohanee for the great scripts :-)

The TOTAL CRYPTO-CAP Is Building A Massive Broadening-Wedge!Hello,
Welcome to this analysis about the Total Cryptocurrency-Market-Cap excluding Bitcoin and Ethereum on the 2-day timeframe perspective. As the Cryptocurrency Market showed up with the heavy bearish declines it is now testing crucial levels and potential reversal potentials that can be eyed. In this case, it is necessary that the market shows up with the right price-action-determinations that the market can shift in an appropriate direction. Besides the fundamental and indicational factors, the technical aspects are also pivotal to consider. In this case, now I discovered an interesting formation developing within the total Cryptocurrency-Market-Cap that has the potential to finalize when the market shows up with the genuine developments that can shape its destinies rightly.
Formational Structures:
As when looking at my chart we can watch there how the total Cryptocurrency-Market-Cap is now approaching a crucial support-zone within the lower boundary of this massive broadening-wedge-formation the market is forming here. In this case the total Cryptocurrency Market-Cap is also testing the 600-EMA marked in orange which is major support for the symbol in this case. When considering the broader perspective the total Cryptocurrency Market-Cap is developing this paramount broadening-wedge-formation, which when rightly completed can point to bright futures for the market to set up. Furthermore, the total Cryptocurrency Market-Cap is building the local descending-wedge which when completed can lead to an initial reversal.
Upcoming Determinations:
Taking all these factors into the consideration here, the most determining factor is how the total Cryptocurrency Market-Cap manages to complete the local descending-wedge-formation because if this wedge should be completed with a substantial breakout and continued volatility this will be one step into the right direction. If the fortunate case settles and the total Cryptocurrency Market-Cap continues with great and solid volatility once the breakout happened the second confirmation is developed once the market breaks out above the upper boundary of the broadening-wedge-formation as it is seen in my chart, if the market shows up with the sophisticated breakout then this is likely to point to further expansion destinies.
In this manner, thank you for watching the analysis, all the best!
"The high destiny of the market is to explicate, rather than to speculate."
Information provided is only educational and should not be used to take action in the markets.

TRADE PLAN FOR ALL CRYPTO ASSETSHello traders, a look into the total3 excluding btc and eth. bearishness ahead , we should expect more downside.
tradehubng.

Total3 for sell or buy altcoinsBe patient like a hunter
otherwise you'll be hunted
To buy zill usdt currency after upward failure
For sales position ftmusdt and bit coin

ALTS in the biggest bleed everHistorically, buying at RSI levels this low has been an amazing opportunity.
ALTS - and especially cosmos assets - were hit harder, because a big chunk of liquidity was established in UST - which collapsed to near 0.
IBC fundamentals are still strong.

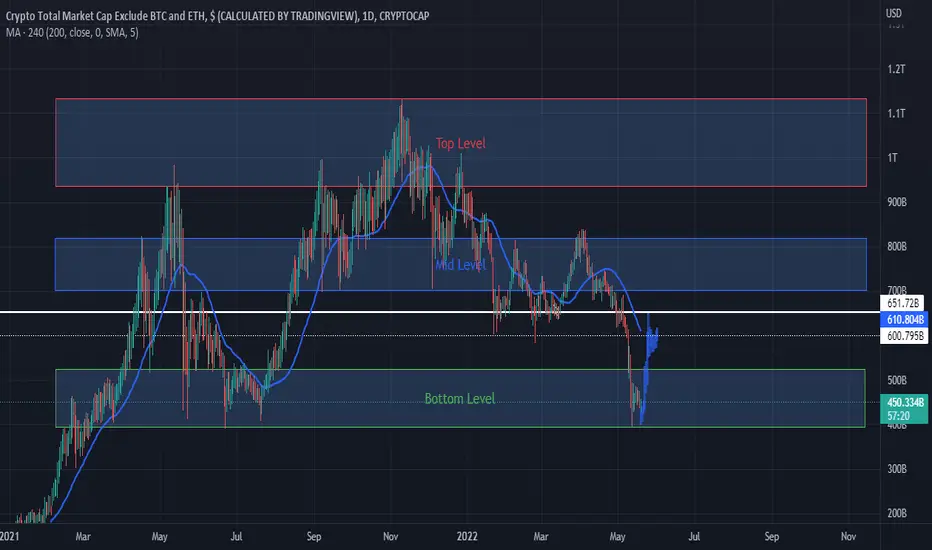
Altcoins on the brink!!This chart excludes BTC and ETH, it is just the altcoin market cap.
They are sitting on a relatively strong support but a drop below will be devastating as there is not much support until approx 100 billion.
If they hold her and make move higher to 505 to 510 billion Then I think a big move can follow to into the 2 plus trillion mark but at this point its far stretch.
The good news is the RSI did go to
the Corona dump lows and has taken a bounce, but lets see where it leads.
A move above 500 billion and hold is very positive and could lead to strong rally later this year or next year.


TOTAL3 BottomWill see this happening, as the bottom reached.
Disclaimer, this is pure only a prediction/speculation.
Trade safely.
Are altcoins primed for a move higher?This is a chart of altcoins excluding BTC and ETH. Holding the support @ approximately 470 Billion is key to this move. As we see right now we have dipped below but we need a close to be confirmed. Let's keep an eye on this as a cheat sheet to the near future.
Not financial advice.

TOTAL3 - Alt Season Could Be Just Around The CornerIn a previous idea i've compared eth price with what btc did in may- aug 2017. TOTAL3 (crypto m. cap excluding btc and eth) looks even more similar than eth does. We see clear initial fall in the summer, then barely setting new highs, before turning down, heading into the lows, maybe go even lower a bit. We should expect HUGE reversal to the upside. This is because one vital element is missing here. We haven't altseason for nearly 80% of all the altcoins. Many of which haven't even rally 1/3 of what they did in a previous cycle, even though they are listed on all major exchanges, and have a use case. (XRP, DASH, EOS, XMR, ZEC, IOTA...)
I expect one final flush to come, then euphoria...
I am not a financial advisor so non of this should be taken as a financial advise. Be well.
CRYPTOCAP:TOTAL3
BITSTAMP:BTCUSD

TOTAL3 - BEARISH RETESTRelief rally.
Likely bounce back forming a bearish retest.
Support becomes resistance.

TOTAL3 - BEARISH RETESTSupport flips into resistance.
If it breaks we might see a triple top formation.

TOTAL 3 My Idea This is the TOTAL3 index which displays the Total Crypto Market Capitalization excluding Bitcoin and Ethereum

Hopefully we can hold this main trend.Looking at the TOTAL charts aren't too good for TA IMO but it helps put things in perspective, I'm hoping we can bounce and stay above the main trend however I'm pretty confident we don't, whether its a move fueled my liquidations or panic either way I don't think we have enough support. I know a'lot of us are hurting and further downside isn't what we need right now but we must be prepared. My portfolio is in absolute ruins but we must remain bullish long term. My buy area is just a general area of where I am going to look for to top off my alt bags. I didn't take profits as I should've but if you did this chart may help you find an area to buy back at. I know times are tough and if you guys need someone to talk to i'm here for yall.


TOTAL3: CRYPTO TOTAL MARKET CAP EXCLUDE BTC AND ETHTotal3 is falling to its targets
1: around 401B
2: 160B
NOTICE:
THIS IS NOT A FINANCIAL ADVICE

