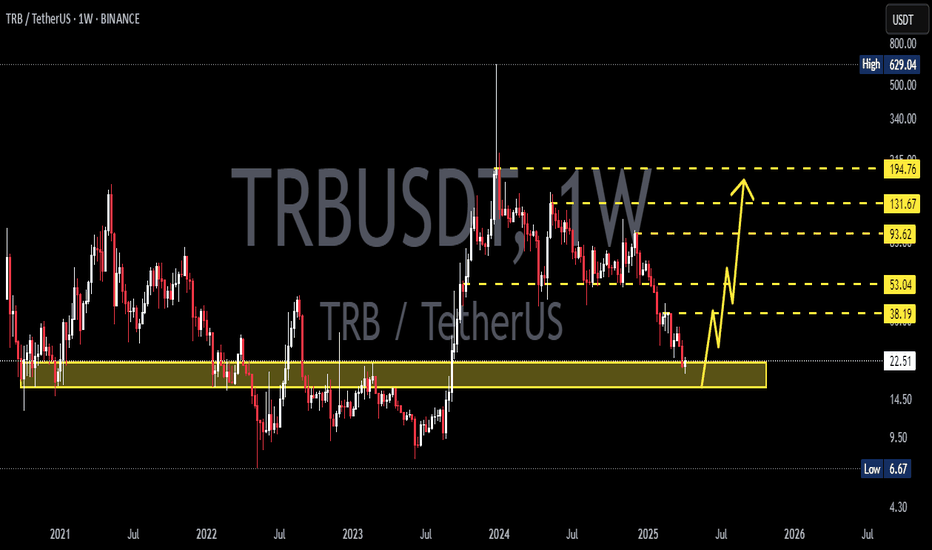
$TRB/USDT Targeted setup $TRB/USDT – Targeted Setup
Clear descending wedge breakout
Retest of the resistance zone holding as support
Bullish structure forming with higher lows
- Entry zone: CMP
- Target: $98
- Stop-loss: $26
This is a clean breakout-retest setup, with momentum favouring bulls.
As long as $29.98 holds
TRB Back Inside Macro Range — Accumulation Likely?TRB has re-entered a long-standing macro range between $9.93 and $44.24, a zone it previously consolidated in for over a year. Current price action and volume behavior suggest we could be in for another extended accumulation phase.
Key Highlights:
Macro Range Reclaimed: Weekly candle closes confir
#TRB/USDT#TRB
The price is moving within a descending channel on the 1-hour frame, adhering well to it, and is heading for a strong breakout and retest.
We are seeing a bounce from the lower boundary of the descending channel, which is support at 30.84.
We have a downtrend on the RSI indicator that is abou
Technical Analysis: TRB/USDT – 1D Timeframe📌 Technical Analysis: TRB/USDT – 1D Timeframe
🟢 Reversal Pattern: Inverse Head and Shoulders
A classic Inverse Head and Shoulders pattern is clearly visible on the chart, which typically signals the end of a downtrend and the beginning of a strong upward movement.
Head: Formed near the strong sup
TRBUSDT Breakout from Falling Wedge — Next Stop $32+?🕊️ TRBUSDT breaks out of a multi-month falling wedge pattern with clean structure and increasing volume.
✅ Entry: $26.90 - 24.00
🔻 Invalidation: Below $22.50
🎯 Targets:
TP1: $32.63
TP2: $40.10
TP3: $48.95
The 100 EMA overhead may act as resistance, so watch how price reacts near $32.
Are you
TRB/USDT(UPDATE)Hello friends
Given the price drop, you can see that buyers supported the price on good support and were able to build a higher ceiling.
Now we have identified important and practical support areas for you to buy in steps and with capital management.
Price targets have also been identified...
*
See all ideas
Summarizing what the indicators are suggesting.
Oscillators
Neutral
SellBuy
Strong sellStrong buy
Strong sellSellNeutralBuyStrong buy
Oscillators
Neutral
SellBuy
Strong sellStrong buy
Strong sellSellNeutralBuyStrong buy
Summary
Neutral
SellBuy
Strong sellStrong buy
Strong sellSellNeutralBuyStrong buy
Summary
Neutral
SellBuy
Strong sellStrong buy
Strong sellSellNeutralBuyStrong buy
Summary
Neutral
SellBuy
Strong sellStrong buy
Strong sellSellNeutralBuyStrong buy
Moving Averages
Neutral
SellBuy
Strong sellStrong buy
Strong sellSellNeutralBuyStrong buy
Moving Averages
Neutral
SellBuy
Strong sellStrong buy
Strong sellSellNeutralBuyStrong buy
Displays a symbol's price movements over previous years to identify recurring trends.


