TRUMP: Advanced Trading Strategy For 6,666% Instant ProfitsThe higher low is in and support is being confirmed now as I write this; patience is key.
It is a waiting game. This whole trading experience, venture or adventure... It is all a waiting game.
The better you get at waiting the best you can do.
You see, when the market is bland, boring and sideway

What Happened To OFFICIAL TRUMP? No More Bullish Action? Read...Did you give up already?
If you did you are not playing the game right. Patience is key.
The initial bullish breakout is in so the next bullish wave is confirmed; but, the initial bullish breakout is corrected and ends in a higher low. This retrace can last a few days just as it can last a few week

TRUMP Forming Major Reversal Within Bullish Wave StructureTRUMPUSDT has completed a substantial corrective phase, culminating in a pronounced low within a high-probability buy-back zone between 8.25 and 9.81 This accumulation area aligns with critical Fibonacci retracement levels and historical structural support, suggesting the end of a major wave cycle l

OFFICIAL TRUMP Exact Levels Predicted, Next Target (Explained)The higher low is in and this will lead to a higher high.
As TRUMPUSDT moves up, there will be no resistance until the action reaches $25.35. This is the exact number for the next stop.
After a target is reached, there is always a retrace. Just as it happened after 26-April. The retrace ends in a

elliott wave $TRUMPelliott wave impulse patterns 12345
From the fluid structure that will continue
You can point out where it is against the rules impulse patterns.
I expect the price is now in wave 2 and will enter 3 4 5 until the end of the cycle with the price above the start of wave b which is over 48$ +.

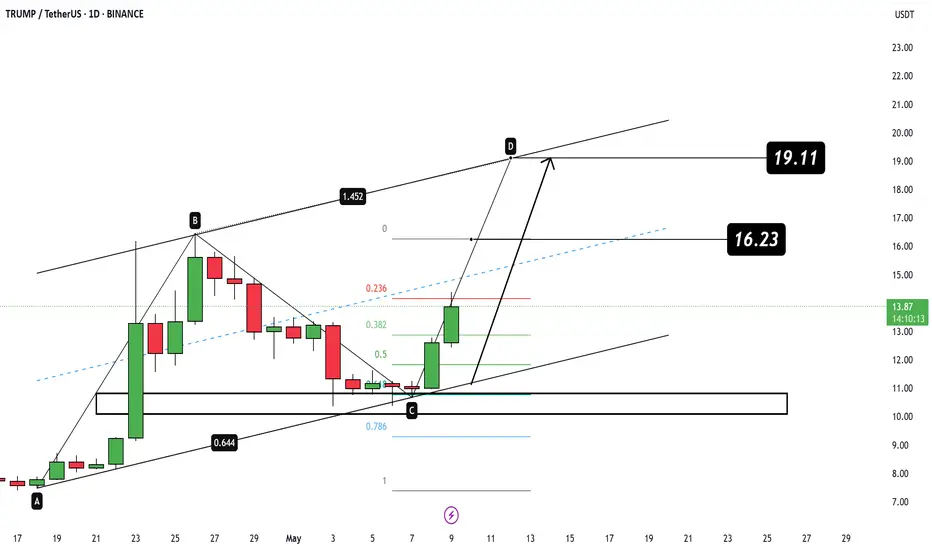
TRUMPUSDT Technical Setup TARGET 20$
The price has successfully bounced from the key demand zone (area C) forming a potential bullish continuation pattern within the channel.
ABCD harmonic structure in play
Strong bounce from the 0.618–0.786 Fibonacci zone
Next resistances and profit targets:
🎯 T1: $16.23
🎯 T2: $19.11
If bullish
Buy OPP.Hello all. I'm not a crypto trader but for the firs time I'm going to trade. does anyone have an idea about?

TRUMPUSDT BUY/LONGBy utilizing Fibonacci retracement levels, historical patterns, , we can formulate a hypothesis that the market might follow a similar trajectory if bullish sentiment prevails.

TRUMPUSDT – Daily Technical AnalysisTRUMPUSDT – Daily Technical Analysis
The price has reached a key daily support level at $10, showing potential signs of a bullish reversal.
If the support holds, we may see a move toward the resistance area around $14, offering a decent upside opportunity.
In a more bearish scenario, the price co

$TRUMPUSDT Breakout Alert!$TRUMP has officially broken above its descending trendline after holding firm support around $11.8. The price also reclaims the 100 EMA (orange line), signaling strength and potential for a trend reversal.
📈 Technical Highlights:
Downtrend breakout confirmed ✅
Retest of resistance turned support

See all ideas
Summarizing what the indicators are suggesting.
Oscillators
Neutral
SellBuy
Strong sellStrong buy
Strong sellSellNeutralBuyStrong buy
Oscillators
Neutral
SellBuy
Strong sellStrong buy
Strong sellSellNeutralBuyStrong buy
Summary
Neutral
SellBuy
Strong sellStrong buy
Strong sellSellNeutralBuyStrong buy
Summary
Neutral
SellBuy
Strong sellStrong buy
Strong sellSellNeutralBuyStrong buy
Summary
Neutral
SellBuy
Strong sellStrong buy
Strong sellSellNeutralBuyStrong buy
Moving Averages
Neutral
SellBuy
Strong sellStrong buy
Strong sellSellNeutralBuyStrong buy
Moving Averages
Neutral
SellBuy
Strong sellStrong buy
Strong sellSellNeutralBuyStrong buy