What Happened To OFFICIAL TRUMP? No More Bullish Action? Read...Did you give up already?
If you did you are not playing the game right. Patience is key.
The initial bullish breakout is in so the next bullish wave is confirmed; but, the initial bullish breakout is corrected and ends in a higher low. This retrace can last a few days just as it can last a few weeks, it is random the market chooses how big is this wait.
If the whales learn that participants are anxious and desperate, the retrace and higher low will take longer so that people will fold and they can buy more at the lows.
If the bots track your trading and see that you are likely to fold if the next rise is delayed by 3-5 more days, then the bots will not start buying until people sell at low prices. The moment you sell the next rise starts to develop almost instantly. Patience is key is what I say.
How long it takes it doesn't matter that's not how it works. The way it works is that you buy with a long-term mindset, "I will wait for as long as it is necessary for my money to grow." Once in, you hold. That's it, nothing more can be done.
Prediction: Just watch! TRUMPUSDT will grow from a higher low. The last low was the bottom and the current retrace, literally five days, is nothing more than bullish consolidation. After some time, a small wait, we will have a higher high. That is how it works. The market never moves straight down but neither straight up. It fluctuates... Doing zig-zags... And that's what you see on the chart.
Be patient, Trump will grow.
Just set it and forget it, comeback when prices are up.
Namaste.
TRUMPUSDT.P trade ideas

TRUMP: Advanced Trading Strategy For 6,666% Instant ProfitsThe higher low is in and support is being confirmed now as I write this; patience is key.
It is a waiting game. This whole trading experience, venture or adventure... It is all a waiting game.
The better you get at waiting the best you can do.
You see, when the market is bland, boring and sideways this can last for a long while. When the market starts crashing or rising everything can happen within a day.
In order to catch the rise, we have to be in and ready to wait.
In order to avoid the crash, we have to set our sell orders on target before the rise takes place. Something like buying in, setting the orders high up (never stop-loss) and then waiting for the market to take care of the rest.
I know it can be boring sometimes and at other times doubt can even creep up. This is not bad nor is there anything wrong with you if this happens, this is normal but you shouldn't worry if you are ready to hold.
The market can go up slowly for 3 months and you wouldn't mind the fact that it is growing if the price moves from $10 to $13 in three months. Then on the fourth month, there is an advance from $13 to $50 and wow!
But if the market drops slowly from $10 to $7 within 3 months we start to become anxious and scared, why? Then, on the fourth month there is an advance from $7 to $50 and wow!
You see? It is all psychological you know. When the market was rising slowly, there was no difference, no secured profits and yet you didn't mind having to wait. But when the market moves lower, you might want to secure a losing trade.
Both the up and the down produce $$$ changes on paper only, nothing changes when it comes to the amount of coins you bought and hold.
If the coins are going to be worth more down the road, six months from now, say, 500% more; this should be an easy hold.
Ignore the short-term, ignore the noise hold strong.
You can do it and you are doing it, for doing this you will be paid and when you get paid you will be happy with the results.
I should give you my strategy once more: Buy and hold.
Thanks a lot for your continued support.
Bitcoin and the Altcoins market is set to grow really, really strong in the coming months.
Just be prepared to wait, it will be worth every day, every minute every second once you get your reward.
Actually, I like to wait. I can study and exercise—prepare—while the market goes through its consolidation phase. I can plan.
Once the new high—All-Time High—is in and the bullish wave is over, I will be prepared to pocket huge profits because I planning and studying today.
Thank you for reading.
Namaste.

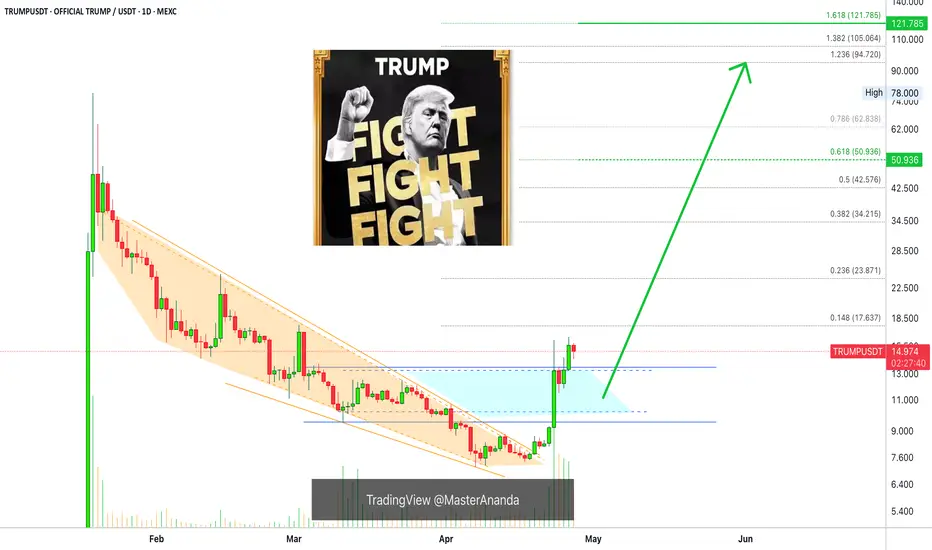
TRUMP Forming Major Reversal Within Bullish Wave StructureTRUMPUSDT has completed a substantial corrective phase, culminating in a pronounced low within a high-probability buy-back zone between 8.25 and 9.81 This accumulation area aligns with critical Fibonacci retracement levels and historical structural support, suggesting the end of a major wave cycle likely Wave 2 or Wave B.
Current price action signals the emergence of a new impulsive phase, with price initiating a potential Wave 3 advance. Immediate resistance resides around 16.43–16.51, a key internal supply zone. A confirmed breakout above this area would validate the bullish continuation, opening the path toward the external supply region near 45.65.
If the bullish momentum sustains beyond that, higher Fibonacci expansion levels project extended targets toward the 87.90 zone consistent with the terminal points of a larger Wave 5 within the macro Wave formation.
Maintaining structural integrity above the key demand zone is essential to uphold the bullish thesis. Failure to defend this zone could expose the market to deeper corrective retracements.
However, as long as price remains above 7.14, the bias remains favorably bullish with clearly defined invalidation levels and high-reward potential.

TRUMPUSDT BUY/LONGBy utilizing Fibonacci retracement levels, historical patterns, , we can formulate a hypothesis that the market might follow a similar trajectory if bullish sentiment prevails.


OFFICIAL TRUMP Update —Your Guide Through Light & DarkIt gets better and better. Yesterday TRUMPUSDT produced the highest session close since 3-March. Think about it... The bottom is fully in and confirmed and now almost two months of bearish action have been completed obliterated. The action is happening now the same as if it were early February 2025.
Another interesting fact is that almost two months of bearish action has been deleted but the chart is only a little over 3 months old. The bears are no more we are in the bullish zone.
This is important and a strong confirmation.
TRUMPUSDT started trading when the market was bearish and moving within a strong corrective phase. The correction for the last major 2024 bullish wave.
Corrections are tough I agree and the market bleeds but they end and once they end the action turns the other way and that's what you are seeing today.
There is no doubt here, nothing to fear, the rise won't stop it is only getting started. Make no mistakes.
How far up TRUMPUSDT will grow is only speculation but you can expect a new All-Time High for sure. And that's easy for a Cryptocurrency project and one with so much buyers, holders, attention and market support.
This is a simple update mentioning the highest close in months, the bottom is in and bullish continuation confirmed. Keep holding and you win. Keep buying, double-win. Only sell when the market reaches new All-Time High and is full green.
Right now is the time to buy and hold, when prices are low. Only when prices are high we take the profits and move on.
Trading is meant to make money. To make money, you have to let go of your position once the market grows.
Prepare now. Plan ahead of time.
You will do great. You have my support.
Thanks a lot for your continued support.
I will be your guidance through the light and through the dark.
Namaste.
Buy OPP.Hello all. I'm not a crypto trader but for the firs time I'm going to trade. does anyone have an idea about?

TRUMPUSDTWe can attempt to buy TRUMPUSDT from specified level as it make HL , also there is no bearish divergence occur indicate that it moves upward.


elliott wave $TRUMPelliott wave impulse patterns 12345
From the fluid structure that will continue
You can point out where it is against the rules impulse patterns.
I expect the price is now in wave 2 and will enter 3 4 5 until the end of the cycle with the price above the start of wave b which is over 48$ +.

Breakout+Support+Fib = 20% Trump upside coming. Targeting $17Hello and greetings to all the crypto enthusiasts, ✌
All previous targets were nailed ✅! Now, let’s dive into a full analysis of the upcoming price potential for Trump's official 🔍📈.
Trump's official has broken out of its descending channel to the upside, indicating a potential bullish reversal. A bounce from the Fibonacci retracement level and daily support suggests upward momentum could resume. I'm targeting a minimum 20% move toward the $17 level, which aligns with a major trendline resistance.📚🙌
🧨 Our team's main opinion is: 🧨
Trump broke its downtrend, and with support from key Fibonacci and daily levels, it could climb 20% toward the $17 trendline resistance.📚🎇
Give me some energy !!
✨We invest hours crafting valuable ideas, and your support means everything—feel free to ask questions in the comments! 😊💬
Cheers, Mad Whale. 🐋

TRUMPUSDT – Daily Technical AnalysisTRUMPUSDT – Daily Technical Analysis
The price has reached a key daily support level at $10, showing potential signs of a bullish reversal.
If the support holds, we may see a move toward the resistance area around $14, offering a decent upside opportunity.
In a more bearish scenario, the price could extend its correction to the $9 support zone, which may serve as a stronger foundation for the next upward impulse.
🟢 Key Support Levels: $10 (daily), $9 (secondary support)
🔴 Resistance Zone: $14
Stay tuned for more technical insights and updates.


TRUMP Update!TRUMP Update:
TRUMP is currently sitting at the 21 MA support. If it holds strong, we are likely to see a rebound. There is another support around $13.6, but it may weaken if the price breaks down below the 21 MA.
The RSI is forming a bearish divergence, suggesting that a short-term correction is likely.
Strategy:
~ Entering a short position at CMP to $15.6.
~ Stop loss: $16.5.
~ Leverage: 5x to 10x.
~ Target: $11.5 to $12.
Note: Always do your own research and analysis before investing.
Regards,
Dexter.

Breaking: $TRUMP Set to Go Parabolic Amidst Golden Cross PatternThe price of Trump coin is set to go parabolic with an anticipated 120% surge on the horizon amid forming a golden cross pattern- a pattern formed when the 50-day MA crosses above the 200-day MA resorted to a trend reversal.
Further solidifying the bullish thesis is the fact that $TRUMP coin has broken a bullish pennant earlier on surging 70% for the past 5 days. With the RSI at 46 and the anticipated Trump’s private dinner for TRUMP $TRUMP token holders, this Polit-Fi memecoin on Solana could be the catalyst for the next bull run.
While already down 9% for the past 24 hours, this is a market shake-off to, accumulate liquidity for the big pump up. However, should $TRUMP coin experience selling pressure, the possible retracement level will be the $11.55 support pivot.
OFFICIAL TRUMP Price Data
The OFFICIAL TRUMP price today is $13.69 USD with a 24-hour trading volume of $1,162,628,325 USD. OFFICIAL TRUMP is down 9.58% in the last 24 hours. The current CoinMarketCap ranking is #35, with a market cap of $2,738,579,157 USD. It has a circulating supply of 199,999,397 TRUMP coins and a max. supply of 999,999,993 TRUMP coins.

TRUMP weekly trading planIn this idea I marked the important levels for this week and considered a few scenarios of price performance
The price is in a sideways correction and has formed an important support and it is not desirable to break it
Write a comment with your coins & hit the like button and I will make an analysis for you
The author's opinion may differ from yours,
Consider your risks.
Wish you successful trades ! mura

TRUMP/USDTKey Level Zone: 12.750 - 13.500
HMT v8.1 detected. The setup looks promising, supported by a previous upward/downward trend with increasing volume and momentum, presenting an excellent reward-to-risk opportunity.
HMT (High Momentum Trending):
HMT is based on trend, momentum, volume, and market structure across multiple timeframes. It highlights setups with strong potential for upward movement and higher rewards.
Whenever I spot a signal for my own trading, I’ll share it. Please note that conducting a comprehensive analysis on a single timeframe chart can be quite challenging and sometimes confusing. I appreciate your understanding of the effort involved.
Important Note :
Role of Key Levels:
- These zones are critical for analyzing price trends. If the key level zone holds, the price may continue trending in the expected direction. However, momentum may increase or decrease based on subsequent patterns.
- Breakouts: If the key level zone breaks, it signals a stop-out. For reversal traders, this presents an opportunity to consider switching direction, as the price often retests these zones, which may act as strong support-turned-resistance (or vice versa).
My Trading Rules
Risk Management
- Maximum risk per trade: 2.5%.
- Leverage: 5x.
Exit Strategy
Profit-Taking:
- Sell at least 70% on the 3rd wave up (LTF Wave 5).
- Typically, sell 50% during a high-volume spike.
- Adjust stop-loss to breakeven once the trade achieves a 1.5:1 reward-to-risk ratio.
- If the market shows signs of losing momentum or divergence, ill will exit at breakeven.
The market is highly dynamic and constantly changing. HMT signals and target profit (TP) levels are based on the current price and movement, but market conditions can shift instantly, so it is crucial to remain adaptable and follow the market's movement.
If you find this signal/analysis meaningful, kindly like and share it.
Thank you for your support~
Sharing this with love!
HMT v2.0:
- Major update to the Momentum indicator
- Reduced false signals from inaccurate momentum detection
- New screener with improved accuracy and fewer signals
HMT v3.0:
- Added liquidity factor to enhance trend continuation
- Improved potential for momentum-based plays
- Increased winning probability by reducing entries during peaks
HMT v3.1:
- Enhanced entry confirmation for improved reward-to-risk ratios
HMT v4.0:
- Incorporated buying and selling pressure in lower timeframes to enhance the probability of trending moves while optimizing entry timing and scaling
HMT v4.1:
- Enhanced take-profit (TP) target by incorporating market structure analysis
HMT v5 :
Date: 23/01/2025
- Refined wave analysis for trending conditions
- Incorporated lower timeframe (LTF) momentum to strengthen trend reliability
- Re-aligned and re-balanced entry conditions for improved accuracy
HMT v6 :
Date : 15/02/2025
- Integrated strong accumulation activity into in-depth wave analysis
HMT v7 :
Date : 20/03/2025
- Refined wave analysis along with accumulation and market sentiment
HMT v8 :
Date : 16/04/2025
- Fully restructured strategy logic
HMT v8.1 :
Date : 18/04/2025
- Refined Take Profit (TP) logic to be more conservative for improved win consistency

Will the growth on TRUMP continue ?In this video I marked the important levels in this video for this week and considered a few scenarios of price performance
This week the important level is $12, if the price bounces off it or breaks it and shows a fake breakout, we may see a rise to target 1 and 2
Write a comment with your coins & hit the like button and I will make an analysis for you
The author's opinion may differ from yours,
Consider your risks.
Wish you successful trades! MURA

Now the market is over-extended: short to 10.70Based on Technical Indicators: MACD, RSI. And Trend Analysis: Fib Extension and Fib Retracement

Trump Going GreatI shared it in my last update.
So far its going as planned.
Expecting continuation higher.

Is Trump's official Set for a 20% Rally to $18.95?Hello and greetings to all the crypto enthusiasts, ✌
All previous targets were nailed ✅! Now, let’s dive into a full analysis of the upcoming price potential for Trump's official 🔍📈.
I successfully shorted Trump at key levels with precision and later identified the bottom near the $8 zone. Following a strategic accumulation, I now anticipate at least 20% additional upside. My primary price target is set at $18.95.📚🙌
🧨 Our team's main opinion is: 🧨
I shorted Trump perfectly, bought near $8, and now see at least 20% upside toward my main $18.95 target.📚🎇
Give me some energy !!
✨We invest hours crafting valuable ideas, and your support means everything—feel free to ask questions in the comments! 😊💬
Cheers, Mad Whale. 🐋

TRUMP COIN: BOTTOM CONFIRMEDTRUMP COIN: BOTTOM CONFIRMED
Engulfing candle together with confirmed demand volume.
Wait for backtest and up!
.
US STOCKS- WALL STREET DREAM- LET'S THE MARKET SPEAK!

Trump Getting Ready Again ? TRUMP Getting ready for another leg up soon?
I think break and hold above 15.3 will trigger some more upside.
