OFFICIAL TRUMP Exact Levels Predicted, Next Target (Explained)The higher low is in and this will lead to a higher high.
As TRUMPUSDT moves up, there will be no resistance until the action reaches $25.35. This is the exact number for the next stop.
After a target is reached, there is always a retrace. Just as it happened after 26-April. The retrace ends in a higher low and the higher low ends by producing a continuation of the bullish move and trend.
After $25.35 and a small retrace, TRUMPUSDT will continue growing to reach $34.61. The market never moves straight up nor straight down, it fluctuates, patience is key.
There is no need to buy and sell at each target, the best and easiest way to earn big money is to buy at support and hold long-term. When prices are high enough, one can easily sell and collect profits.
On a bigger and broader perspective, the three targets on the chart will be taken out as part of the 3rd wave of the current bullish impulse. This will lead to a retrace, wave 4, and this will then lead to additional growth and higher prices, wave 5.
Wave 5 will lead to a strong correction and this strong correction to a higher low based on the broader structure. This higher low will resume to produce an advance that will end up in a bull run phase and a new All-Time High.
After the All-Time High comes the long-term correction also known as bear market. The next bear market won't be as bad as the previous one. Compared to the 2022 bear market and the transition period, it will be fast and small. We are set for an entire decade of mostly growth. Still, allow for the usual fluctuations and variations. If you hold focusing on the long-term, you can't go wrong. Right now, you should be buying like it is the end of the world. The world won't end, but low prices won't be available for too long.
When strong bullish action starts we wonder, "Why didn't I buy when prices were low?"
Just recently, between 7 and 22 April, TRUMPUSDT was trading very, very low. While the initial bullish breakout is in, it is still early.
Thanks a lot for your continued support.
Namaste.
TRUMPUSDT.P trade ideas

TRUMP: Advanced Trading Strategy For 6,666% Instant ProfitsThe higher low is in and support is being confirmed now as I write this; patience is key.
It is a waiting game. This whole trading experience, venture or adventure... It is all a waiting game.
The better you get at waiting the best you can do.
You see, when the market is bland, boring and sideways this can last for a long while. When the market starts crashing or rising everything can happen within a day.
In order to catch the rise, we have to be in and ready to wait.
In order to avoid the crash, we have to set our sell orders on target before the rise takes place. Something like buying in, setting the orders high up (never stop-loss) and then waiting for the market to take care of the rest.
I know it can be boring sometimes and at other times doubt can even creep up. This is not bad nor is there anything wrong with you if this happens, this is normal but you shouldn't worry if you are ready to hold.
The market can go up slowly for 3 months and you wouldn't mind the fact that it is growing if the price moves from $10 to $13 in three months. Then on the fourth month, there is an advance from $13 to $50 and wow!
But if the market drops slowly from $10 to $7 within 3 months we start to become anxious and scared, why? Then, on the fourth month there is an advance from $7 to $50 and wow!
You see? It is all psychological you know. When the market was rising slowly, there was no difference, no secured profits and yet you didn't mind having to wait. But when the market moves lower, you might want to secure a losing trade.
Both the up and the down produce $$$ changes on paper only, nothing changes when it comes to the amount of coins you bought and hold.
If the coins are going to be worth more down the road, six months from now, say, 500% more; this should be an easy hold.
Ignore the short-term, ignore the noise hold strong.
You can do it and you are doing it, for doing this you will be paid and when you get paid you will be happy with the results.
I should give you my strategy once more: Buy and hold.
Thanks a lot for your continued support.
Bitcoin and the Altcoins market is set to grow really, really strong in the coming months.
Just be prepared to wait, it will be worth every day, every minute every second once you get your reward.
Actually, I like to wait. I can study and exercise—prepare—while the market goes through its consolidation phase. I can plan.
Once the new high—All-Time High—is in and the bullish wave is over, I will be prepared to pocket huge profits because I planning and studying today.
Thank you for reading.
Namaste.

TRUMP Forming Major Reversal Within Bullish Wave StructureTRUMPUSDT has completed a substantial corrective phase, culminating in a pronounced low within a high-probability buy-back zone between 8.25 and 9.81 This accumulation area aligns with critical Fibonacci retracement levels and historical structural support, suggesting the end of a major wave cycle likely Wave 2 or Wave B.
Current price action signals the emergence of a new impulsive phase, with price initiating a potential Wave 3 advance. Immediate resistance resides around 16.43–16.51, a key internal supply zone. A confirmed breakout above this area would validate the bullish continuation, opening the path toward the external supply region near 45.65.
If the bullish momentum sustains beyond that, higher Fibonacci expansion levels project extended targets toward the 87.90 zone consistent with the terminal points of a larger Wave 5 within the macro Wave formation.
Maintaining structural integrity above the key demand zone is essential to uphold the bullish thesis. Failure to defend this zone could expose the market to deeper corrective retracements.
However, as long as price remains above 7.14, the bias remains favorably bullish with clearly defined invalidation levels and high-reward potential.

elliott wave $TRUMPelliott wave impulse patterns 12345
From the fluid structure that will continue
You can point out where it is against the rules impulse patterns.
I expect the price is now in wave 2 and will enter 3 4 5 until the end of the cycle with the price above the start of wave b which is over 48$ +.

What Happened To OFFICIAL TRUMP? No More Bullish Action? Read...Did you give up already?
If you did you are not playing the game right. Patience is key.
The initial bullish breakout is in so the next bullish wave is confirmed; but, the initial bullish breakout is corrected and ends in a higher low. This retrace can last a few days just as it can last a few weeks, it is random the market chooses how big is this wait.
If the whales learn that participants are anxious and desperate, the retrace and higher low will take longer so that people will fold and they can buy more at the lows.
If the bots track your trading and see that you are likely to fold if the next rise is delayed by 3-5 more days, then the bots will not start buying until people sell at low prices. The moment you sell the next rise starts to develop almost instantly. Patience is key is what I say.
How long it takes it doesn't matter that's not how it works. The way it works is that you buy with a long-term mindset, "I will wait for as long as it is necessary for my money to grow." Once in, you hold. That's it, nothing more can be done.
Prediction: Just watch! TRUMPUSDT will grow from a higher low. The last low was the bottom and the current retrace, literally five days, is nothing more than bullish consolidation. After some time, a small wait, we will have a higher high. That is how it works. The market never moves straight down but neither straight up. It fluctuates... Doing zig-zags... And that's what you see on the chart.
Be patient, Trump will grow.
Just set it and forget it, comeback when prices are up.
Namaste.

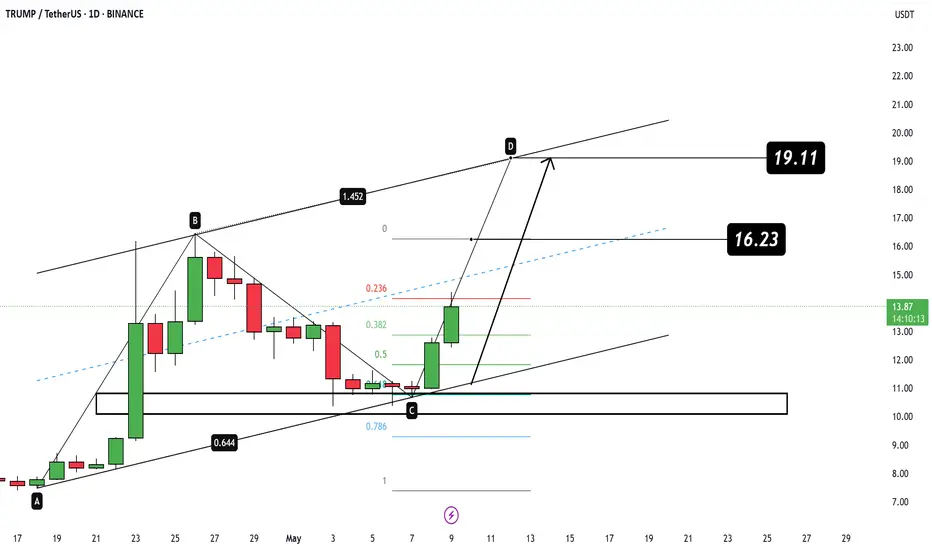
TRUMPUSDT Technical Setup TARGET 20$
The price has successfully bounced from the key demand zone (area C) forming a potential bullish continuation pattern within the channel.
ABCD harmonic structure in play
Strong bounce from the 0.618–0.786 Fibonacci zone
Next resistances and profit targets:
🎯 T1: $16.23
🎯 T2: $19.11
If bullish momentum holds, price is likely to head toward point D at the upper boundary of the channel.
TRUMPUSDT – Daily Technical AnalysisTRUMPUSDT – Daily Technical Analysis
The price has reached a key daily support level at $10, showing potential signs of a bullish reversal.
If the support holds, we may see a move toward the resistance area around $14, offering a decent upside opportunity.
In a more bearish scenario, the price could extend its correction to the $9 support zone, which may serve as a stronger foundation for the next upward impulse.
🟢 Key Support Levels: $10 (daily), $9 (secondary support)
🔴 Resistance Zone: $14
Stay tuned for more technical insights and updates.

$TRUMPUSDT Breakout Alert!$TRUMP has officially broken above its descending trendline after holding firm support around $11.8. The price also reclaims the 100 EMA (orange line), signaling strength and potential for a trend reversal.
📈 Technical Highlights:
Downtrend breakout confirmed ✅
Retest of resistance turned support around $13.3 ✅
Targets in sight:
• TP1: $16.52
• TP2: $21.04
• TP3: $26.35
This breakout setup remains valid as long as TRUMPUSDT holds above $13.3. A clean trendline flip often leads to explosive follow-throughs.

TRUMPUSDT BUY/LONGBy utilizing Fibonacci retracement levels, historical patterns, , we can formulate a hypothesis that the market might follow a similar trajectory if bullish sentiment prevails.

Buy OPP.Hello all. I'm not a crypto trader but for the firs time I'm going to trade. does anyone have an idea about?

Trump USdt
**"The Art of the Day Trade"**
One sunny Tuesday morning, Donald J. Trump decided he’d conquered enough—real estate, reality TV, the presidency—and it was time for the next frontier: **day trading**.
“I understand markets better than anyone,” he told himself in the mirror, adjusting a red tie longer than the Nasdaq ticker.
Armed with a triple espresso and a Twitter account still mysteriously active, he downloaded a trading app called “Stonks4U.” He liked it because the logo was a bald eagle holding a dollar sign.
His first move? Buy 10,000 shares of **ToasterCoin**, a cryptocurrency that claimed to revolutionize breakfast. “Huge potential. Best toast tech. Everyone's talking about it,” he said, ignoring the whitepaper, which was mostly just a recipe for French toast and a picture of Elon Musk in a chef hat.
At 9:45 AM, he saw a Reddit post titled “SELL TOASTERCOIN BEFORE IT BURNS.” He panicked.
“Fake news!” he shouted at the screen. “We’re HOLDING. I invented holding. It’s called 'diamond hands', look it up.”
By 10:15 AM, he’d also bought shares in something called **Quantum Ferret Technologies**, mistaking it for a defense contractor. It was, in fact, a Twitch streamer who reviews cheese.
His portfolio plummeted faster than a lead balloon in a black hole. “It’s all rigged,” he proclaimed, pacing the room. “This is worse than the Emmy voters in 2004!”
Then, at exactly 3:59 PM, one of his holdings—a little-known stock called “Covfefe Energy”—mysteriously surged 900% after he accidentally tweeted “\$CVFE to the moon” instead of “coffee.”
The stock soared. Reddit exploded. Financial reporters were baffled. Trump leaned back in his chair, sipping Diet Coke like a seasoned market guru.
“I call that a **strategic typo**,” he smirked.
By 4:01 PM, he was banned from three trading platforms, but up \$12 million.
“Best trader. Everybody says so,” he whispered proudly, already eyeing up Dogecoin again.
(ALLEGEDLY)

$TRUMP 5X LONG Long $TRUMP to $140.
If you think the president will let his meme coin fail, stay poor.
Reminds me of CRYPTOCAP:PEPE in its early days

trumpusdt.30mAnalysis of the TrumpUSD pair on the half-hour timeframe.
The analysis relies on trend analysis and support and resistance.
The bullish scenario is the strongest if the conditions are met.

TRUMP and Key ResistanceAfter pumping aroun 10%, now on resistance level, if we can break we can see price around 15 soon


TRUMP weekly trading planIn this idea I marked the important levels for this week and considered a few scenarios of price performance
The price is in a sideways correction and has formed an important support and it is not desirable to break it
Write a comment with your coins & hit the like button and I will make an analysis for you
The author's opinion may differ from yours,
Consider your risks.
Wish you successful trades ! mura

Breakout+Support+Fib = 20% Trump upside coming. Targeting $17Hello and greetings to all the crypto enthusiasts, ✌
All previous targets were nailed ✅! Now, let’s dive into a full analysis of the upcoming price potential for Trump's official 🔍📈.
Trump's official has broken out of its descending channel to the upside, indicating a potential bullish reversal. A bounce from the Fibonacci retracement level and daily support suggests upward momentum could resume. I'm targeting a minimum 20% move toward the $17 level, which aligns with a major trendline resistance.📚🙌
🧨 Our team's main opinion is: 🧨
Trump broke its downtrend, and with support from key Fibonacci and daily levels, it could climb 20% toward the $17 trendline resistance.📚🎇
Give me some energy !!
✨We invest hours crafting valuable ideas, and your support means everything—feel free to ask questions in the comments! 😊💬
Cheers, Mad Whale. 🐋


TRUMPUSDTWe can attempt to buy TRUMPUSDT from specified level as it make HL , also there is no bearish divergence occur indicate that it moves upward.

Buy Trade Strategy for TRUMP: Riding Political Narrative MomentuDescription:
This trading idea is centered on TRUMP, a meme-based cryptocurrency that draws its value and visibility from political sentiment, particularly surrounding former U.S. President Donald Trump. TRUMP is part of the emerging class of politically themed tokens that gain traction through social media engagement, public discourse, and news cycles related to major political events. The token’s popularity tends to surge during election seasons or political controversies, making it a high-risk, high-reward asset tied to speculation and community-driven hype rather than traditional utility.
While TRUMP offers potential for short-term gains amid political attention and virality, it lacks strong fundamentals or technological innovations compared to major crypto projects. Its volatility is amplified by sentiment and social trends, meaning its price movements can be unpredictable and disconnected from broader market indicators.
Disclaimer:
This trading idea is provided for educational purposes only and does not constitute financial advice. Trading cryptocurrencies like TRUMP is highly speculative and carries substantial risk, including the potential loss of your entire investment. Always do your own research, assess your risk tolerance, and consult with a licensed financial advisor before making investment decisions. Past performance is not indicative of future results.

Trump baller mode loading BYBIT:TRUMPUSDT
Trump coin has nowhere to go but up.
As the most popular meme right now, any loosening of financial conditions will ensure a parabolic move for this memecoin.
I'm looking at a target level of 500$ when we reach peak insanity.
Buckle up for the wild ride!

TRUMP/USDTKey Level Zone: 12.750 - 13.500
HMT v8.1 detected. The setup looks promising, supported by a previous upward/downward trend with increasing volume and momentum, presenting an excellent reward-to-risk opportunity.
HMT (High Momentum Trending):
HMT is based on trend, momentum, volume, and market structure across multiple timeframes. It highlights setups with strong potential for upward movement and higher rewards.
Whenever I spot a signal for my own trading, I’ll share it. Please note that conducting a comprehensive analysis on a single timeframe chart can be quite challenging and sometimes confusing. I appreciate your understanding of the effort involved.
Important Note :
Role of Key Levels:
- These zones are critical for analyzing price trends. If the key level zone holds, the price may continue trending in the expected direction. However, momentum may increase or decrease based on subsequent patterns.
- Breakouts: If the key level zone breaks, it signals a stop-out. For reversal traders, this presents an opportunity to consider switching direction, as the price often retests these zones, which may act as strong support-turned-resistance (or vice versa).
My Trading Rules
Risk Management
- Maximum risk per trade: 2.5%.
- Leverage: 5x.
Exit Strategy
Profit-Taking:
- Sell at least 70% on the 3rd wave up (LTF Wave 5).
- Typically, sell 50% during a high-volume spike.
- Adjust stop-loss to breakeven once the trade achieves a 1.5:1 reward-to-risk ratio.
- If the market shows signs of losing momentum or divergence, ill will exit at breakeven.
The market is highly dynamic and constantly changing. HMT signals and target profit (TP) levels are based on the current price and movement, but market conditions can shift instantly, so it is crucial to remain adaptable and follow the market's movement.
If you find this signal/analysis meaningful, kindly like and share it.
Thank you for your support~
Sharing this with love!
HMT v2.0:
- Major update to the Momentum indicator
- Reduced false signals from inaccurate momentum detection
- New screener with improved accuracy and fewer signals
HMT v3.0:
- Added liquidity factor to enhance trend continuation
- Improved potential for momentum-based plays
- Increased winning probability by reducing entries during peaks
HMT v3.1:
- Enhanced entry confirmation for improved reward-to-risk ratios
HMT v4.0:
- Incorporated buying and selling pressure in lower timeframes to enhance the probability of trending moves while optimizing entry timing and scaling
HMT v4.1:
- Enhanced take-profit (TP) target by incorporating market structure analysis
HMT v5 :
Date: 23/01/2025
- Refined wave analysis for trending conditions
- Incorporated lower timeframe (LTF) momentum to strengthen trend reliability
- Re-aligned and re-balanced entry conditions for improved accuracy
HMT v6 :
Date : 15/02/2025
- Integrated strong accumulation activity into in-depth wave analysis
HMT v7 :
Date : 20/03/2025
- Refined wave analysis along with accumulation and market sentiment
HMT v8 :
Date : 16/04/2025
- Fully restructured strategy logic
HMT v8.1 :
Date : 18/04/2025
- Refined Take Profit (TP) logic to be more conservative for improved win consistency
