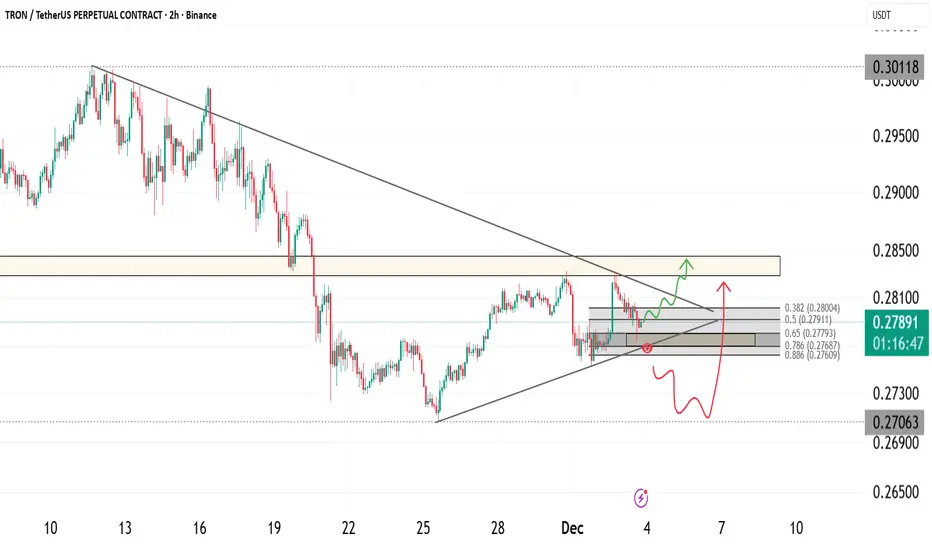
TRX Approaching Key Breakout Zone as Structure TightensTRX is approaching a critical decision point inside a compressing structure where price is being held between diagonal resistance and a rising support line. The market has printed a clean series of higher lows while repeatedly testing the same resistance, suggesting growing pressure beneath the pri
TRXUSDT 1D#TRX has broken above the falling wedge on the daily chart. The RSI and MACD both suggest continued upward momentum, but for now, #TRX is facing the daily SMA50. In case of a breakout above the SMA50, the potential targets are:
🎯 $0.3075
🎯 $0.3188
🎯 $0.3301
🎯 $0.3462
🎯 $0.3667
⚠️ Always remember t

Trxusdt long setupIf you backtest the entire history of TRXUSDT using Smart Honey 2.0, you will see that there were 4 similar situations. From this, I conclude that TRX price will rise to the yellow line in the near future
Settings for smart honey 2.0
tp = 1.5
sensitivity = 2.7

TRX/USD — Trying to Break the Downtrend TRX/USD has been under pressure since August, losing up to 26%, yet compared to other L1 assets the decline remains relatively mild. Over the past weeks, the pair stabilized around 0.27, forming a minor rebound structure. The key question now: can TRX reclaim its trend, or is this just a relief boun

FireHoseReel | TRX Technical Outlook After Resistance Break🔥 Welcome to FireHoseReel!
Let’s jump into the TRX market structure analysis.
👀 TRX – 4H Overview
TRX has successfully broken above the $0.2824 resistance and is now pushing higher.
Over the past 24 hours, TRX trading volume has dropped by 20%.
📊 Volume Analysis
Watch the volume closely on the cha

Tron (TRX): Important Trend Holder Has Been Broken | 200EMATRX has been respecting its trend for a long time, but now we finally got a clean breakdown of that structure. Buyers tried to re-secure the zone, but so far the reaction isn’t convincing.
Right now the chart favors the sell side — unless buyers manage to reclaim the EMAs and push back above the br

TRX/USDT BREAK OUT I'm looking for Tron to break out to the upside shortly. Currently at a crucial support level and breaking out of the down trend. If we can get above the EMAs, I see a big bounce to the upside.

Long trade
15min
📘 TRXUSDT.P – Trade Journal Entry (15-Min Chart)
Sat 22nd Nov 25 — 3:00 pm — NY Session PM
Buyside Trade
🟦 TRADE SUMMARY (Tab 1 — Blue)
Pair: TRXUSDT.P
Direction: Buyside Trade
Date: Sat 22nd Nov 25
Time: 3:00 pm
Session: NY Session PM
Timeframe: 15m
🟩 TRADE PARAMETERS (Tab 2 — Green Tran

CLOSE THE POSITIONthe bubble is getting emptied and we cannot risk staying in the position.
im closing the position so should you i will explain the reason:
the chart till now had to start moving , since it didnt this means the bubble of over sold has been emptied and now the market is most likely to continue movin
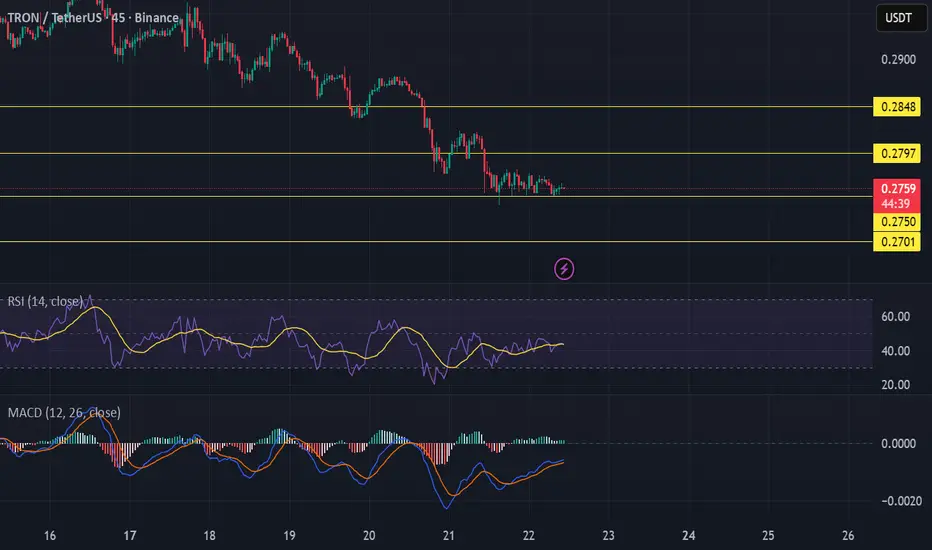
SIGNAL TRXUSDT LONG position
USE 1:1 RR ratio
SL.0.2701
you can close on 0.2848
or we can wait to see how far it can go
but in that case you gotta follow me so we move up the sl step by step
lets hunt it

See all ideas
Summarizing what the indicators are suggesting.
Oscillators
Neutral
SellBuy
Strong sellStrong buy
Strong sellSellNeutralBuyStrong buy
Oscillators
Neutral
SellBuy
Strong sellStrong buy
Strong sellSellNeutralBuyStrong buy
Summary
Neutral
SellBuy
Strong sellStrong buy
Strong sellSellNeutralBuyStrong buy
Summary
Neutral
SellBuy
Strong sellStrong buy
Strong sellSellNeutralBuyStrong buy
Summary
Neutral
SellBuy
Strong sellStrong buy
Strong sellSellNeutralBuyStrong buy
Moving Averages
Neutral
SellBuy
Strong sellStrong buy
Strong sellSellNeutralBuyStrong buy
Moving Averages
Neutral
SellBuy
Strong sellStrong buy
Strong sellSellNeutralBuyStrong buy
Displays a symbol's price movements over previous years to identify recurring trends.