TRX/USDT - Breakout PatternThe TRX/USDT pair on the M30 timeframe presents a potential Buying opportunity due to a recent breakout. This suggests a shift in momentum towards the upside in the coming Hours.
Key Points:
Buy Entry: Consider entering a Long position around close to the breakout level. This offers an entry point near the perceived shift in momentum.
Target Levels:
1st Support – 0.2762
2nd Support – 0.2804
🎁 Please hit the like button and
🎁 Leave a comment to support for My Post !
Your likes and comments are incredibly motivating and will encourage me to share more analysis with you.
Best Regards, KABHI_TA_TRADING
Thank you.
TRXUSDT.P trade ideas

TRON - Is Sun so to the Sun or to the Moon?TRXUSDT - SOOOOOO, WHAT IF? WHAT If NOT? This time you tell me whats going to happen and why? Just I can say if u short then what if it goes to blue line? If you long? What if it tests Mid's Low? Dont say me why i am not giving you a short or a long call, i am showing you the path, you have to walk alone

Fresh Demand Zones Hold the Key - Don't Get Caught in the Hype! TRXUSDT: Fresh Demand Zones Hold the Key - Don't Get Caught in the Hype! 🔑📉
Key Insights:
Ignore the Big Rally: Using the recent major upswing for analysis may not yield actionable insights.
Fresh Demand Matters: Focusing on the first untested fresh demand zone gives a stronger foundation for entries.
Low Time Frame Strategy: When price reaches these zones, shift to lower time frames and look for upward market structure breaks. This approach leads to better risk-to-reward ratios and higher success rates.
Why This Works?
Fresh zones often attract institutional interest, making them ideal for precision entries. By combining these zones with lower time frame analysis, you minimize risk and maximize reward.
Pro Tip: Don’t let emotions take over during large price moves—stick to the plan, and let the chart guide you.
Enjoyed this insight? Boost, comment, and follow for more strategies to dominate the charts! 🚀
Let me tell you, folks, this is amazing. Nobody does analysis like I do. Believe me. If this helps you, don't forget to boost and comment! It’s a big deal, motivates me to share even more winning insights with you. Tremendous insights.
I keep my charts the best, clean, simple, and clear. You know it, I know it, clarity leads to better decisions. No question about it. My approach? Built on years of tremendous experience. Incredible track record. I don’t claim to know it all, but I spot high-probability setups like nobody else. Trust me.
Want to learn how to use the heatmap, cumulative volume delta, and volume footprint techniques I use to determine demand regions with stunning accuracy? Send me a private message—totally free, folks. That’s right. I help anyone who wants it, absolutely no charge. Unbelievable value.
Here’s the list, long list, great list, of some of my previous incredible analyses. Each one, a winner:
🎯 ZENUSDT.P: Patience & Profitability | %230 Reaction from the Sniper Entry
🐶 DOGEUSDT.P: Next Move
🎨 RENDERUSDT.P: Opportunity of the Month
💎 ETHUSDT.P: Where to Retrace
🟢 BNBUSDT.P: Potential Surge
📊 BTC Dominance: Reaction Zone
🌊 WAVESUSDT.P: Demand Zone Potential
🟣 UNIUSDT.P: Long-Term Trade
🔵 XRPUSDT.P: Entry Zones
🔗 LINKUSDT.P: Follow The River
📈 BTCUSDT.P: Two Key Demand Zones
🟩 POLUSDT: Bullish Momentum
🌟 PENDLEUSDT.P: Where Opportunity Meets Precision
🔥 BTCUSDT.P: Liquidation of Highly Leveraged Longs
🌊 SOLUSDT.P: SOL's Dip - Your Opportunity
🐸 1000PEPEUSDT.P: Prime Bounce Zone Unlocked
🚀 ETHUSDT.P: Set to Explode - Don't Miss This Game Changer
🤖 IQUSDT: Smart Plan
⚡️ PONDUSDT: A Trade Not Taken Is Better Than a Losing One
💼 STMXUSDT: 2 Buying Areas
🐢 TURBOUSDT: Buy Zones and Buyer Presence
🌍 ICPUSDT.P: Massive Upside Potential | Check the Trade Update For Seeing Results
🟠 IDEXUSDT: Spot Buy Area | %26 Profit if You Trade with MSB
📌 USUALUSDT: Buyers Are Active + %70 Profit in Total
🌟 FORTHUSDT: Sniper Entry +%26 Reaction
🐳 QKCUSDT: Sniper Entry +%57 Reaction
📊 BTC.D: Retest of Key Area Highly Likely
And that’s just the start. The list goes on and on, folks. It’s a tremendous list, the best. I stopped adding because, frankly, it’s tiring. So many wins. People are amazed. You can check my profile and see for yourself, winning moves, all the time. Believe me, nobody does it better.

TRXUSDT: Support-Resistance Flip with a Perfect Blue Box TRXUSDT: Support-Resistance Flip with a Perfect Blue Box 🎯
Listen, folks, TRXUSDT is showing a classic support-resistance flip , and we’ve got a great blue box to work with. This is where opportunity meets preparation, and those who act smartly could capitalize big time.
Why This Matters:
Support-Resistance Flip: A textbook setup, signaling a potential strong reaction.
Blue Box Precision: Carefully placed using CDV, liquidity heatmaps, volume profiles, and volume footprints for maximum accuracy.
Potential for Upside: If buyers hold this zone, it’s game on for TRX.
Pro Tip: Pay attention to this area and watch for confirmation—upward market structure breaks in lower time frames can provide the green light for action.
Want to learn how I identify these high-precision zones? DM me, and I’ll teach you about CDV, liquidity heatmaps, volume profiles, and volume footprints.
Boost, comment, and follow if you find this helpful. Let’s win together, and remember—discipline and strategy always pay off! 💪
Let me tell you, folks, this is amazing. Nobody does analysis like I do. Believe me. If this helps you, don't forget to boost and comment! It’s a big deal, motivates me to share even more winning insights with you. Tremendous insights.
I keep my charts the best, clean, simple, and clear. You know it, I know it, clarity leads to better decisions. No question about it. My approach? Built on years of tremendous experience. Incredible track record. I don’t claim to know it all, but I spot high-probability setups like nobody else. Trust me.
Want to learn how to use the heatmap, cumulative volume delta, and volume footprint techniques I use to determine demand regions with stunning accuracy? Send me a private message—totally free, folks. That’s right. I help anyone who wants it, absolutely no charge. Unbelievable value.
Here’s the list, long list, great list, of some of my previous incredible analyses. Each one, a winner:
🎯 ZENUSDT.P: Patience & Profitability | %230 Reaction from the Sniper Entry
🐶 DOGEUSDT.P: Next Move
🎨 RENDERUSDT.P: Opportunity of the Month
💎 ETHUSDT.P: Where to Retrace
🟢 BNBUSDT.P: Potential Surge
📊 BTC Dominance: Reaction Zone
🌊 WAVESUSDT.P: Demand Zone Potential
🟣 UNIUSDT.P: Long-Term Trade
🔵 XRPUSDT.P: Entry Zones
🔗 LINKUSDT.P: Follow The River
📈 BTCUSDT.P: Two Key Demand Zones
🟩 POLUSDT: Bullish Momentum
🌟 PENDLEUSDT.P: Where Opportunity Meets Precision
🔥 BTCUSDT.P: Liquidation of Highly Leveraged Longs
🌊 SOLUSDT.P: SOL's Dip - Your Opportunity
🐸 1000PEPEUSDT.P: Prime Bounce Zone Unlocked
🚀 ETHUSDT.P: Set to Explode - Don't Miss This Game Changer
🤖 IQUSDT: Smart Plan
⚡️ PONDUSDT: A Trade Not Taken Is Better Than a Losing One
💼 STMXUSDT: 2 Buying Areas
🐢 TURBOUSDT: Buy Zones and Buyer Presence
🌍 ICPUSDT.P: Massive Upside Potential | Check the Trade Update For Seeing Results
🟠 IDEXUSDT: Spot Buy Area | %26 Profit if You Trade with MSB
📌 USUALUSDT: Buyers Are Active + %70 Profit in Total
🌟 FORTHUSDT: Sniper Entry +%26 Reaction
🐳 QKCUSDT: Sniper Entry +%57 Reaction
📊 BTC.D: Retest of Key Area Highly Likely
And that’s just the start. The list goes on and on, folks. It’s a tremendous list, the best. I stopped adding because, frankly, it’s tiring. So many wins. People are amazed. You can check my profile and see for yourself, winning moves, all the time. Believe me, nobody does it better.

#TRX/USDT Ready to go higher#TRX
The price is moving in a descending channel on the 1-hour frame and sticking to it well
We have a bounce from the lower limit of the descending channel, this support is at 0.2500
We have a downtrend on the RSI indicator that is about to be broken, which supports the rise
We have a trend to stabilize above the moving average 100
Entry price 0.2530
First target 0.2572
Second target 0.2607
Third target 0.2647

TRXUSDT VERYY SMOL SCELPSMOL SCALP FOR TRC AS SHOWED OKAY? May go beyond the stipulated area but have marked it upto the purple line!


Tron (TRX): Possible Breakout Incoming!Tron coin seems to be going for a breakout, where upon getting a proper break and a confirmation, we might see 6-17% of markup price growth.
We are keeping our attention at the current resistance zone, where we are looking for a break to happen!!
Swallow Team

I Cannot Short This !!! situation+next targets.The price is within an ascending wedge and this can be a bullish signal for TRON. However, we need to wait for this wedge to be broken and then wait for the price to rise. Currently, the price can be bearish because more funds have been injected into Bitcoin to allow Bitcoin to find more stability in the coming days.
Give me some energy !!
✨We spend hours finding potential opportunities and writing useful ideas, we would be happy if you support us.
Best regards CobraVanguard.💚
_ _ _ _ __ _ _ _ _ _ _ _ _ _ _ _ _ _ _ _ _ _ _ _ _ _ _ _ _ _ _ _
✅Thank you, and for more ideas, hit ❤️Like❤️ and 🌟Follow🌟!
⚠️Things can change...
The markets are always changing and even with all these signals, the market changes tend to be strong and fast!!

TRON (TRX) on the Road to $0.64? An Analysis for the Community🚀 TRON (TRX) on the Road to $0.64? An Analysis for the Community 🚀
TRON (TRX) is showing strong signs of a potential price surge, with a realistic target of $0.64 based on Fibonacci levels and technical indicators. Here’s why TRX looks bullish heading into 2025:
1️⃣ Technical Analysis
The current chart analysis reveals:
Fibonacci Level 1.618 highlights $0.64 as a possible target.
Strong support levels at $0.24 and $0.28 are holding firm, paving the way for further growth.
The price is following a clear uptrend and has recently broken key resistance levels.
2️⃣ Fundamental Strength
TRON's ecosystem continues to expand at a rapid pace:
Partnership with Bitget: TRON recently announced a collaboration with Bitget, one of the leading cryptocurrency exchanges. This partnership boosts global adoption and liquidity for TRX.
Leading in dApps: TRON remains one of the top blockchains for decentralized applications and smart contracts.
3️⃣ Positive Market Momentum
USDT-TRC20 Dominance: TRON continues to gain strength globally, driven by the rising adoption of USDT on the TRC-20 network, which offers faster and cheaper transactions compared to alternatives.
Bull Market Catalysts: As the broader crypto market enters a bullish phase, TRON is uniquely positioned to benefit, thanks to its established presence across all major exchanges and its robust ecosystem.
4️⃣ Why $0.64?
Analysts believe the combination of increased network utility, growing adoption of TRC-20 USDT, and TRON’s technical strength could push the price to $0.64. While the crypto markets are inherently volatile, TRON has historically demonstrated its ability to rally quickly.
What’s Your Take?
What are your thoughts on the partnership between TRON and Bitget?
Do you believe $0.64 is achievable in 2025?
Share your opinions with the community! 🌐
📢 Disclaimer: This is not financial advice. Please do your own research before making investment decisions!

TRX May Resume Bullish Movement SoonTRX May Resume Bullish Movement Soon
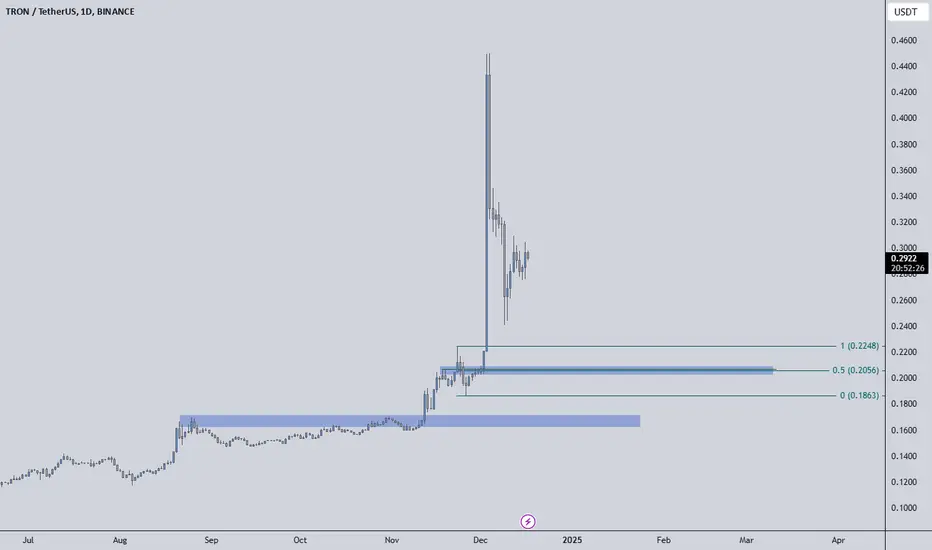
TRX completed a Bullish Harmonic Pattern and we can also see an interesting price reaction near 0.224.
The accumulation during these days looks very good again and the next upward wave should start soon.
The first resistance is expected near 0.265 and the second resistance near 0.2900.
Also, since TRX is discussed several times for price manipulation, this should support our bullish movement.
You can find more details in the chart!
Thank you!

TRX HODLERS - $0.5 ! but needs some smol shortsI know what i say and i know when i say its going to go 0.5, jiust a news it its. expecting a bit of 0.192 to allow more buyers but as i am holding it so ill put shorts now and i am evident long lol

TRX looing bearish As per DOW analysis it is making LH and LL.
as per charts it can possibly hit LL at 0.15

TRX/USDT TRON BULLHello friends
The TRX/USDT chart has created a good opportunity for buying
Monitor the chart according to the shape and compliance with financial management and enter the purchase with confirmation.
SL: 0.23266 (Risk ~ 2%)
Gain > 44%
R/R : 22 !!!

Lingrid | TRXUSDT buying Opportunity from the SUPPORT zoneThe price perfectly fulfilled my last idea. It hit the target level. The recent sell-off in the entire crypto market, led by BTC, had a significant impact on altcoins as well. BINANCE:TRXUSDT has pulled back toward a key support level and the upper border of an upward channel. A fake break of the round number at 0.300 suggests that there was not enough strength for the price to maintain momentum above this level, leading to a rollback. With the price now having rebounded off the trendline and the support level around 0.250, there is potential for a recovery. If the support holds, I expect the market to slowly move upward toward the resistance zones. My goal is resistance zone around 0.2880
Traders, if you liked this idea or if you have your own opinion about it, write in the comments. I will be glad 👩💻

TRON's TRX Extended's Extended, THE PATH OF RICHNESS - $0.5SO as mentioned in this now hodlers were good holding but at this present point of time this looks insanely good to buy. Ideal smol buyers can buy for scalp to follow the green line, Pfft, i bought it from 0.31 LOL and targets mentioned

TRX Another pump is on the wayThis is not an asset which i would analyse daily or even monthly but, what i see is a pattern which have the potential for another rise, i mean i never say anything is 100% definitive to happen but, for what i see, it is what it is

TRXUSDT Buy Signal for TRX/USDT
✅ Suggestion: I recommend buying this asset right now in the live market (Spot).
🎯 Target Prices:
1️⃣ 0.3051
2️⃣ 0.3102
📊 I am also expecting a 7% growth in the spot market. 🚀
💬 To manage this signal accurately and access more signals:
1️⃣ Follow my TradingView page 📊
2️⃣ Send me a private message for further guidance.
💎 Let’s profit together! 💰

TRXUSDT %150 DAILY VOLUME SPIKE | BE CAREFUL NO BUYERS YET1. Volume Spike Context
A 150% volume increase is significant, but without buyers stepping in, this can mean:
Absorption: Large orders are filling on the sell side, suppressing upward movement.
Liquidity Sweep: Price is testing a key zone to trigger liquidity (e.g., stop-losses or limit orders).
2. Blue Box Zones
When price approaches your predefined blue boxes:
Observe how price reacts in those zones on lower timeframes (e.g., 1-minute or 5-minute):
Is price consolidating (building a base)?
Are there sharp rejections (wicks, tight ranges)?
Is price forming higher lows (signs of buyers stepping in)?
3. Upward Breakout Triggers
To evaluate upward breakouts:
Focus on price structure:
A clear break above recent highs on lower timeframes.
Watch for a clean candle close above the range to confirm buyers have control.
Ensure the breakout is not a fakeout:
Price should not immediately drop back into the range after breaking above.
Look for a retest of the breakout level that holds as support.
4.Volume Behavior at Blue Boxes
Even without indicators, you can observe volume visually:
If large volume candles appear near the blue boxes and price holds → buyers may be absorbing supply.
If price starts moving up with minimal retracement → potential for continuation.
#TRX: Harnessing Decentralized Content PowerDescription:
This trading idea revolves around TRX (Tron), the native token of the TRON blockchain, a platform designed to decentralize the internet by enabling creators to share content directly with audiences. TRX supports a range of applications, including decentralized finance (DeFi), gaming, and NFTs, leveraging TRON's high transaction speeds and low costs. With strategic partnerships and growing adoption in the blockchain space, TRX has become a key player in the push toward a decentralized web ecosystem.
Despite its strong fundamentals, the cryptocurrency market remains highly volatile, and external factors such as regulatory developments, market sentiment, and global economic conditions can significantly impact TRX's price movements. Investors are advised to approach with caution and implement proper risk management strategies.
Disclaimer:
This trading idea is intended for educational purposes only and does not constitute financial advice. Trading cryptocurrencies like TRX carries substantial risk, including the possibility of a complete loss of capital. Always conduct your own research, evaluate your financial situation, and consult a professional advisor before making any investment decisions. Past performance is not indicative of future results.

TRX Is Getting Ready for Another Bullish WaveTRX Is Getting Ready for Another Bullish Wave
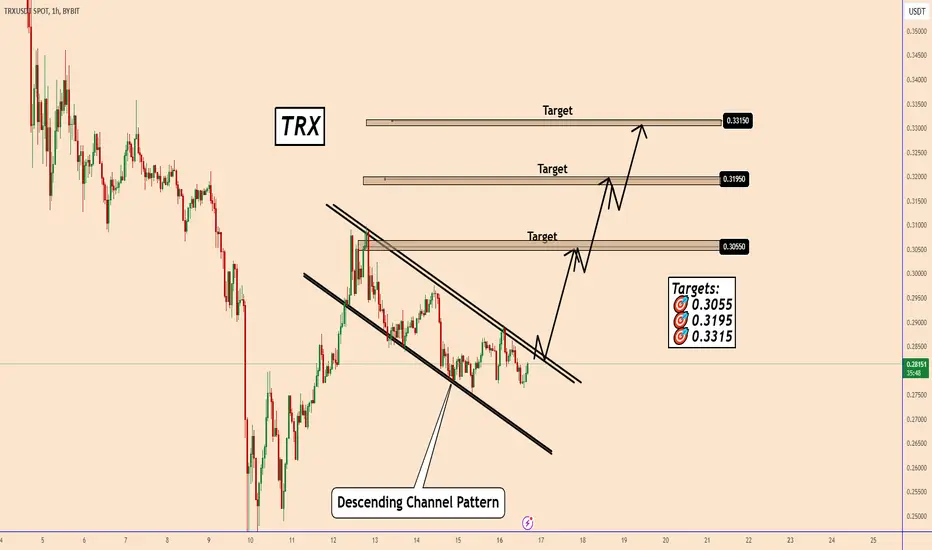
Tron looks like it has completed a bullish channel pattern. It has performed well so far, and considering TRX has been strong for a long time, I believe it can bounce again.
If the price breaks through the pattern, it will begin the bullish wave as shown in the chart.
Targets: 🎯 0.3055 🎯 0.3195 🎯 0.3315
You may find more details in the chart!
Thank you and Good Luck!
❤️PS: Please support with a like or comment if you find this analysis useful for your trading day❤️
$0.268: Tron TRX Last Stand?Tron is currently trading below the resistance at $0.297, the area characterised by slow and choppy price action.
1. A bounce from the nearby support level at $0.268 could suggest renewed buying interest, setting the stage for a potential move toward $0.297 (Dashed Green Projection).
2. A break and close above this level would indicate bullish strength, opening the path toward the next resistance at $0.339, followed by $0.377, providing room for a broader recovery (Solid Green Projection).
3. Conversely, if TRX fails to hold $0.268, it would indicate increasing bearish momentum, likely triggering a decline toward the key support zone at $0.226 (Red Projection).

TRX Bullish wedgeTRX forming a beautiful bullish wedge, 21 EMA moving toward trendline resistance to create a support for TRX, along with a small bullflag in its region of support and resistance, TRX is priming to blow this week, ill be taking entries on the break out but at the moment just short term to the 200MA congrats to those who won on Supra! I got a few wins, to see more charts in the future follow me!
