Tron (TRX): Possible Breakdown From EMAs (keep an eye for sure)Tron caught our attentions with a nice struggle happening near EMAs, which could result in a massive breakdown and movement to lower zones, calming unfilled FVGs.
Swallow Team
TRXUSDT.PS trade ideas

Need to check if the rise can continueHello, traders.
If you "Follow", you can always get new information quickly.
Please click "Boost" as well.
Have a nice day today.
-------------------------------------
(1M chart)
It fell near the Fibonacci ratio 1 (0.13571) and touched near 0.10447 and is currently maintaining the price.
-
(1W chart)
The key is which section it deviates from among the support or resistance sections shown on the chart.
The current medium- to long-term trend is maintaining an uptrend, but if it falls below 0.10447, it is judged that it is likely to turn into a downtrend.
-
(1D chart)
Therefore, the key is whether the price can be maintained by rising above the sell line of the superTrend indicator.
If not, you should check for support near the box section of the HA-Low indicator on the 1D chart.
You should check whether the price can be maintained by rising above the Fibonacci ratio of 0.786 (0.11732).
The key is whether the price can be formed by maintaining the bottom section near the HA-Low indicator on the 1D chart.
-
Have a good time.
Thank you.
--------------------------------------------------
- Big picture
It is expected that a full-scale uptrend will begin when it rises above 29K.
The section that is expected to be touched in the next bull market is 81K-95K.
#BTCUSD 12M
1st: 44234.54
2nd: 61383.23
3rd: 89126.41
101875.70-106275.10 (overshooting)
4th: 13401.28
151166.97-157451.83 (overshooting)
5th: 178910.15
These are points where resistance is likely to occur in the future.
We need to check if these points can be broken upward.
We need to check the movement when this section is touched because I think a new trend can be created in the overshooting section.
#BTCUSD 1M
If the major uptrend continues until 2025, it is expected to start forming a pull back pattern after rising to around 57014.33.
1st: 43833.05
2nd: 32992.55
-----------------

TXR doing its own thing againTRX did follow BTC flush of market on FR 10 days ago, but since then has been in an uptrend while entire CRYPTO Market pulled back.
Focus LONG on TRX.

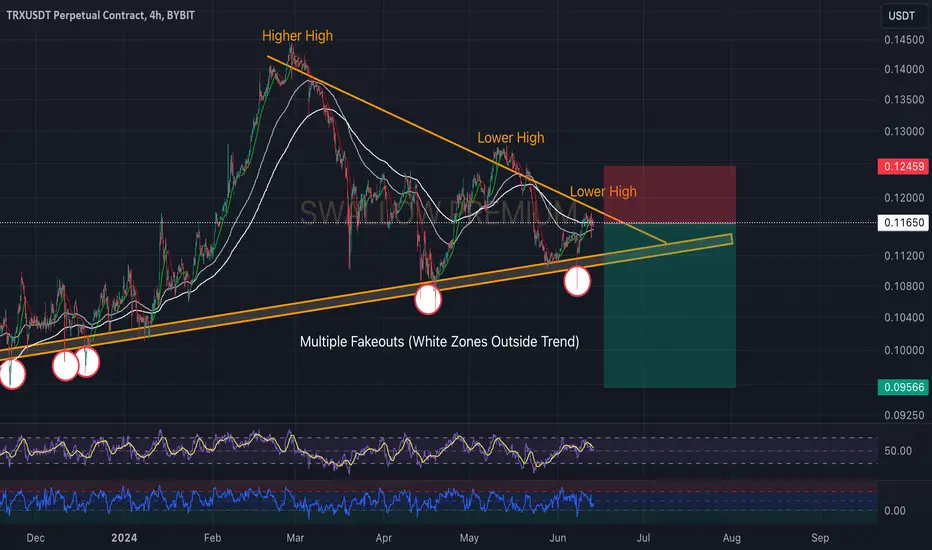
Tron (TRX): Keeping an Eye on That Trend / Possible Breakdown???Tron is on the upper side of the triangle formation (where the EMAs are currently).
We are looking for the price to move inside that end zone there and potentially show us a breakdown from there, which would start strong downward movement!
RSI and Bollinger Bands seem to be reaching for movement to lower zones so let's see!
Swallow Team
TRXUSDT- Symmetrical Triangle pattern#TRX/USDT
A symmetrical triangle pattern is observed on the TRXUSDT 4-hour chart💁♂️
Three bullish price targets are provided after breakout: $0.11780, $0.12051, and $0.12361🎯

TRXUSDT 4HSymmetrical triangle pattern on the #TRX 4H timeframe. Price can pump from here. Targets are:
$0.11896
$0.12229
$0.12767

TRX Defies Market Trends: Key Levels and Strategic Insights🔍TRX (Tron) is showing unique behavior amidst market volatility. Here's a detailed analysis to guide your trading decisions.
📆Coin of the Day: TRX (Tron)
About the Project:
TRX is the native cryptocurrency of the Tron network, used for transaction fees on the TRC20 network. It is widely staked, contributing to its relatively stable price movements.
🧩Technical Analysis
4-Hour Timeframe
This analysis focuses on shorter-term trends, identifying critical levels and potential scenarios.
📉Support and Resistance:
Key Supports:
0.11569 (0.382 Fibonacci level) - recently established support after a breakout.
0.11494
0.11104
Key Resistances:
0.11873 (0.618 Fibonacci level)
0.12740 (major resistance and potential trigger for long positions)
📈Bullish Scenario:
Fibonacci Golden Zone: TRX is currently within a major supply zone, which overlaps with the 0.618 Fibonacci level. Breaking above this area could indicate strong bullish momentum.
Targets: Key resistance levels to watch are 0.11873, 0.12438, and 0.12740 (trigger for significant long positions).
📉Bearish Scenario:
Break Below Key Support: If TRX fails to maintain above 0.11569, it could signal a bearish reversal.
Targets: The next support levels are at 0.11494 and 0.11104.
📊Volume and RSI:
Volume Analysis: Recent volume spikes suggest increasing interest, which is critical for sustaining upward momentum.
RSI Analysis:
Current RSI: 61.50, indicating bullish momentum but approaching overbought territory.
💡Key Triggers:
For Long Positions:
Entry Trigger: Break and hold above 0.11873.
Strategy: Open a position on the hold of this level, targeting 0.12438 and 0.12740. Use tight stop-loss orders to manage risk.
For Short Positions:
Entry Trigger: Break and retest below 0.11569.
Strategy: Open a position if the price confirms a break below this level, targeting 0.11494 and 0.11104. Adjust stop-loss orders accordingly.
👨💻Trading Positions
Long Position
Entry Trigger: Hold above 0.11873 with confirmation from RSI and volume.
Strategy: Open a position on the hold of this level, targeting 0.12438 and 0.12740. Use tight stop-loss orders to manage risk.
Short Position
Entry Trigger: Break and retest below 0.11569.
Strategy: Open a position if the price confirms a break below this level, targeting 0.11494 and 0.11104. Adjust stop-loss orders accordingly.
📝TRX is demonstrating unique resilience compared to the broader market trends. Traders should closely monitor key levels and volume to determine potential entries and exits. RSI and volume trends will provide additional insights into momentum shifts.
🧠💼Always remember the inherent risks in futures trading, with the potential for margin calls if risk management is neglected. Stick to strict capital management principles and use stop-loss orders, ensuring an initial target with a risk-to-reward ratio of 2.
🫶If you found this analysis helpful and want to support me, please boost this analysis. Feel free to leave a comment or suggest a coin you'd like me to analyze next.

TRX Swing Long Due to relative strong vs. overall market, long to 0.06158
Due to relative strong vs. overall market, long to 0.06158

TRONUSDT - All set to take a flightTRONUSDT After completing ABCD Pattern and making strong Divergence and recently breaking the accumulation phase is all set to take a flight. Be ready !

Tron (TRX): About To Breakout!Tron is looking nice after forming a small cup there (bounce NR2 zone).
We are looking for a potential breakout from the neckline zone and a re-test of local upper resistance from where we expect to see some kind of rejection.
Although setup looks good for a while, we are still keeping an eye on it, as we might see a weakening to kick in and a failed attempt to breakout from the neckline zone, which would mean a sideways or downward movement.
Swallow Team

TRXUSDT Elliott wave countAbove 0.10475 we are looking to the upside for wave ((5)).
Equality between waves ((1)) and ((3)) could signal an extended wave ((5)).
From the guidelines of alternations, wave ((2)) a running flat correction may signal wave ((4)) ended as a zigzag correction.
Price bounced into the 0.382 fib retracement as usually a wave 4 do it.
Log scale used!!

TRX always dos its own thing 3D INV HS ? TRX , one of my SPOT holds is looking for 3D HL.
its in a 4 h rounding bottom on eof my "cumulate" patterns, that moved and now is looking for a 4h HL,
you can try and buy that backtest and risk off of the rounding bottom low.
don´t overcomplicate your trading !
I have 3 indicators,. VOL RSI and EMA12.
Priceaction is king and we are not in preschool drawing class!
draw IN what you ,must but get on with it ;)
Get great at TA and then trade fast! It takes ME 2 m to plan a trade and 2 m to put in the orders.
respect your stops and sizing !
enjoy

TRX signal#TRON :small_red_triangle_down: moves in an ascending channel in the daily time frame and is in correction mode in the 4-hour time frame.
The price is close to the $0.11120-$0.10520 support area, which is a strong demand area.
Its long-term trend is upward, and the short-term trend is downward. To stabilize the upward trend in the 4-hour time frame, the price must break the dynamic resistance.

TRX ( TRON ) tm:1hHello traders.
I hope you doing well.
These areas are based on my personal strategy and I will share it with you.
Open a sell position on the supply area or open a buy position on the demand area.
Your entry point, stop loss, and target point are based on money management and the amount of money in your trading account.
But I promise you that by trading in the areas of my trading strategy, you will definitely make a profit, because these areas, although they seem simple, are my experience of 8 years of learning and trading.
I hope you will achieve maximum continuous profit with me by using supply and demand areas.
Good luck traders.
Mohammad Goodarzi

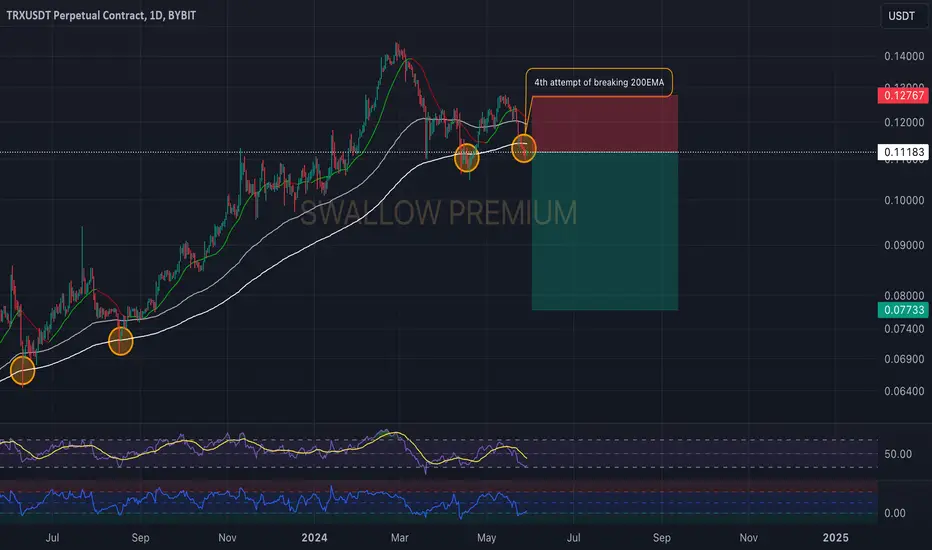
Tron (TRX): 200EMA Been Broken!Tron is yet again at 200EMA trying to break this 4th time.
We are looking for a successful breakdown here, which would result in a strong downward movement!
Swallow Team
TRX limit orders ?TRX to bounce off ascending grind line ?
Also interception at prior support level on to the ascending grind lines
Go long if you get a hammer off this level?

Technical Analysis of TRX/USDT Chart (Tron/Tether) Key Levels in the Chart:
1. **Support Areas (Green Zones):**
- Near the $0.080 level: This zone acts as a strong support, with price reacting to this area multiple times.
- Near the $0.060 level: Another strong support zone that has held up the price in the past.
2. **Resistance Areas (Red Zones):**
- Near the $0.120 level: This area has acted as a significant resistance where the price has struggled to break through.
- Near the $0.180 level: Another resistance zone which the price has tested but not broken.
3. **Liquidity Levels (LIQ):**
- **Daily Liquidity Levels:**
- $0.03330: A lower level of liquidity on a daily scale indicating potential buy orders.
- **Weekly Liquidity Levels:**
- $0.01431: A weekly liquidity level indicating potential buy orders.
- $0.22890: A weekly liquidity level indicating potential sell orders.
Other Key Points:
- **Change of Character (Choch):**
- The first Choch occurred near the $0.020 level, indicating a trend change from bearish to bullish.
- A potential second Choch is marked around the $0.060 level, indicating a potential trend change.
- **Break of Structure (Bos):**
- The first Bos occurred near the $0.030 level, indicating a break of resistance and the start of a bullish trend.
- The second Bos is marked near the $0.16767 level, indicating a potential break of resistance.
Technical Pattern:
- **Consolidation:**
- The price has shown periods of consolidation between the marked support and resistance zones.
- This consolidation indicates indecision and potential build-up for a significant move.
Trend Analysis:
1. **Bullish Scenario:**
- If the price breaks above the $0.180 resistance level, it could move towards the $0.22890 weekly liquidity level.
- Target levels in this scenario:
- $0.180 (Resistance Area)
- $0.22890 (Weekly Liquidity Level)
2. **Bearish Scenario:**
- If the price breaks below the $0.080 support level, it may move towards the $0.060 support area, and potentially lower towards the $0.03330 daily liquidity level.
- Target levels in this scenario:
- $0.080 (Support Area)
- $0.060 (Support Area)
- $0.03330 (Daily Liquidity Level)
Volume Analysis:
- **Volume:**
- Volume analysis indicates decreasing volume during consolidation, suggesting a lack of strong momentum. An increase in volume on a breakout could confirm the start of a new trend.
Conclusion:
The TRX/USDT chart indicates a consolidation phase with potential for significant moves upon breakout from key levels. Traders should watch for breakouts from the marked support and resistance zones to identify potential trends. Support and resistance levels are crucial for decision-making, as their breakage can signify important market movements.

TRXUSDT COULD PUMP A BITHey, what's up fellow traders i think i found something that i can share with you. Though nothing is guaranteed here but i guess this gonna happen.... DYOR

TRX long ALL trading ideas have entry point + stop loss + take profit + Risk level.
hello Traders, here is the full analysis for this pair, let me know in the comment section below if you have any questions, the entry will be taken only if all rules of the strategies will be satisfied. I suggest you keep this pair on your watchlist and see if the rules of your strategy are satisfied. Please also refer to the Important Risk Notice linked below.
Disclaimer

TRON BUYon the higher timeframe there is a breakout on Tron
We are at a major key level in the market, we have a corrective push to the downside now I'm expecting buys to the upside

TRX: On the Verge of Breakout - Will Resistance Hold?TRX is going for a re-test at $0.12352, which could allow gathering strength to breach the $0.12809 resistance.
A successful breakout of $0.12809 could catapult TRX towards the $0.13549 mark.
A decline beneath $0.11969, the key daily support, will amplify bearish pressures to $0.10416.

TRX - Inverse head and shoulder - Breakout ImminentBINANCE:TRXUSDT (6H CHART) Technical Analysis Update
TRX is currently trading at $0.12346 and has formed a inverse head and shoulder pattern. Price is currently around the resistance line, if see a resistance breakout then we have potential for a good LONG Trade.
I will wait till we have a confirmed breakout of the resistance and enter the long trade only after that.
Entry level: $ 0.12461 (Candle Close above this)
Stop Loss Level: $ 0.11752
TakeProfit 1: $ 0.12778
TakeProfit 2: $ 0.13172
TakeProfit 3: $ 0.13764
TakeProfit 4: $ 0.14398
Max Leverage: 5x
Position Size: 1-2% of capital
Don't forget to keep stop loss.
Follow Our TradingView Account for More Technical Analysis Updates, | Like, Share and Comment Your thoughts.
Cheers
GreenCrypto

TRX Daily Signalling a drop for CryptoLooking at $0.108 for a buy on TRX here, and a Short on Daily close confirmation
