Will TRX Hold Above $0.2466 or Drop to $0.18 Before a Rally?
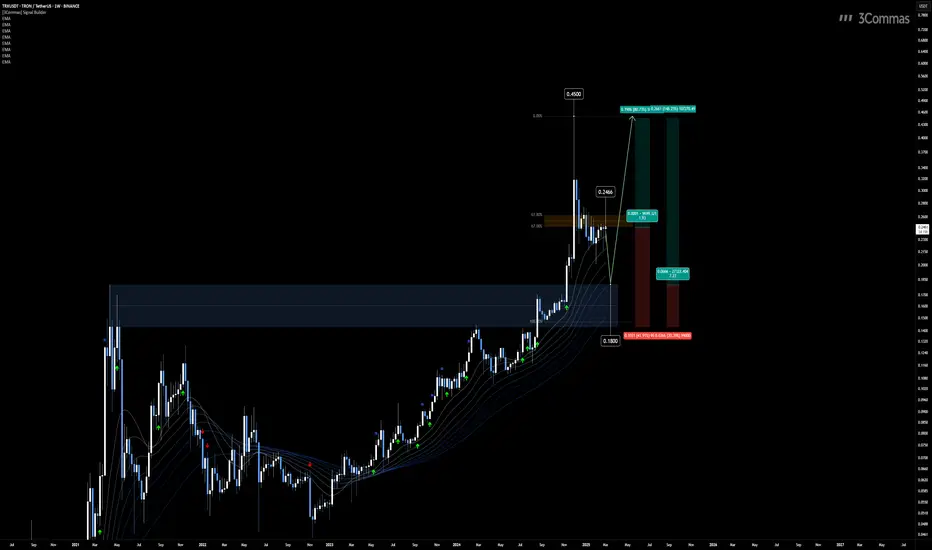
The BINANCE:TRXUSDT BINANCE:TRXUSD chart on the 1W timeframe maintains a bullish structure despite the recent retracement. The EMA ribbon remains upward-sloping, and the price is showing signs of rejection from this zone, reinforcing the broader uptrend.
Two potential entry zones stand out for a continuation to the upside. The first is $0.2466, aligning with the golden Fibonacci retracement zone, a key level where buyers may step in. The second is $0.18, a significant support level where the price previously broke through a major historical high. Both areas offer favorable setups targeting $0.45, the next major resistance level.
The market’s reaction at these key levels will determine the next move. A strong bounce could confirm a continuation toward $0.45, while a breakdown of these supports could shift the momentum.
👨🏻💻💭 Which entry do you favor? Will TRX hold above $0.2466 or revisit $0.18 before its next leg up? Let’s discuss your outlook!
__
The information and publications within the 3Commas TradingView account are not meant to be and do not constitute financial, investment, trading, or other types of advice or recommendations supplied or endorsed by 3Commas and any of the parties acting on behalf of 3Commas, including its employees, contractors, ambassadors, etc.
TRXUSDT.PS trade ideas
Tron coin shortI just now opened a short position on Tron. The market seems high and its at a resistance. Due for a correction and possibly a full blown reversal....today has been quite bullish but just going with the PA. I think its more probable to fall lower

TRX at the Edge: Bounce or Break?TRX is trading at 0.2256, presenting a mixed picture with both bullish and bearish signals. The 50-period moving average (MA) is above the 200-period MA, pointing to a longer-term uptrend, but the price is currently below both MAs, reflecting recent weakness. The Relative Strength Index (RSI) sits at 45, which is neutral territory, while the Moving Average Convergence Divergence (MACD) shows a bearish crossover, suggesting potential downward pressure. Key support levels are at 0.221 and 0.2141, with resistance at 0.232 and 0.240. The price is nearing the support at 0.221, which could trigger a bounce if it holds firm. A break below might see it drop to 0.2141, whereas a push above 0.232 could target 0.240. If TRX lingers between 0.221 and 0.232, it might consolidate until a decisive breakout occurs.
Looking at the broader market, Bitcoin’s current mixed signals could impact TRX, as it often follows Bitcoin’s lead. However, Tron’s growing network activity and adoption might offer some independent support, potentially softening the blow from any market-wide pullbacks. Volume remains steady for now, but a noticeable increase could signal the next move, keep an eye out for a surge on either a bounce from support or a breakdown below it.
For trading: Set alerts at 0.221 and 0.232 to track potential reversals or breakouts. It’s smart to wait for confirmation, like a 4H candle closing outside these levels, before jumping in. Given the market’s volatility, use stop-losses to manage risk, and stay tuned to Bitcoin’s price action and any Tron-related news, as these could steer TRX’s next steps.

TRXUSDT: Is a Major Sell-Off Incoming? Yello, Paradisers! Is #TRXUSDT about to face a sharp rejection? The price is struggling at a critical level and with buyers failing to push through, the risk of a deeper correction is growing fast. A breakdown below key support levels could trigger a much larger move downward.
💎The bullish momentum is fading, and a clear bearish shift is in play. The break of the ascending trendline combined with a probable rejection from the Bearish Order Block and Supply Zone at $0.2376 – $0.2425, reinforces strong downside momentum. TRX is now trading below both the 50 EMA and 200 EMA, further confirming a bearish outlook.
💎If sellers maintain control, #TRON could drop toward the $0.2160 demand zone as the next key support. A deeper correction could take the price to $0.2072, where strong buyers might attempt to step in.
💎Unless TRX breaks above $0.2490, the bearish continuation remains the dominant play. The recent candlestick action shows strong rejection from the imbalance zone,with long upper wicks a clear sign of aggressive selling pressure.
Bearish bias still in control! Be ready, Paradisers!
MyCryptoParadise
iFeel the success 🌴

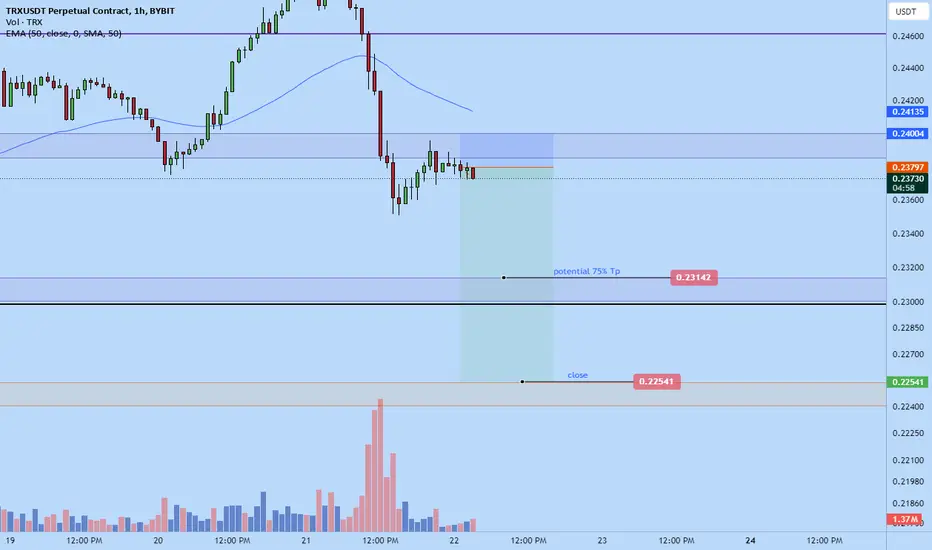
Tron short back to $0.23142Trx short.
Given trade plays out. Am looking to potentially take 75% profit at $0.23142 area. Right now am going o bed and I'll leave tp open just in case...I don't know...maybe we get a bigger than normal drop.
I don't think if big drop it will wick up fast as I anticipate if could fall all the way down to $0.2254 area so having tp open should be fine.
I think this trade has a very high probability to work out like 80-90% chance, just a matter of timing the entry.
LongAccording to the analysis of the waves and the help of the Gann method, it can be expected that the price will return to the green zone again.
This is my personal opinion. Please don't use it as your trading criteria. Good luck

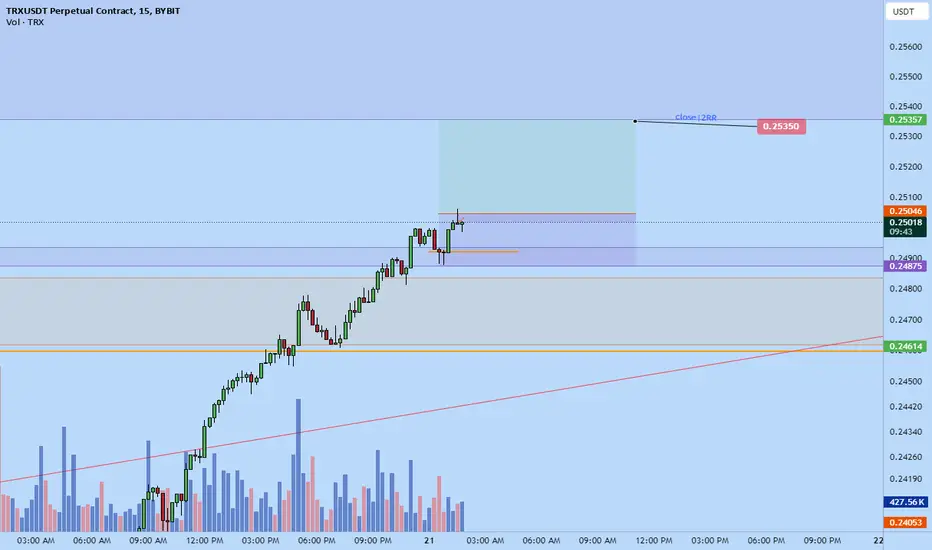
Tron to $0.25350 continued pushI just entered a long position on TRON . If anyone interested. It's at a better price now than my entry a while ago.
Price is quite high and I would avoid if it was any other pair but trx based on the PA I observed tends to push very aggressive at times ...slow but aggressive extended impulsive push.

TRON is going to the MOON? TRX Weekly forecast & Trading IdeasMidterm forecast:
While the price is above the support 0.17000, resumption of uptrend is expected.
We make sure when the resistance at 0.27260 breaks.
If the support at 0.17000 is broken, the short-term forecast -resumption of uptrend- will be invalid.
Technical analysis:
A trough is formed in daily chart at 0.20100 on 02/03/2025, so more gains to resistance(s) 0.24740, 0.25800 and maximum to Major Resistance (0.27260) is expected.
Take Profits:
0.24740
0.25800
0.27260
0.30099
0.33299
0.45000
__________________________________________________________________
❤️ If you find this helpful and want more FREE forecasts in TradingView,
. . . . . . . . Hit the 'BOOST' button 👍
. . . . . . . . . . . Drop some feedback in the comments below! (e.g., What did you find most useful? How can we improve?)
🙏 Your support is appreciated!
Now, it's your turn!
Be sure to leave a comment; let us know how you see this opportunity and forecast.
Have a successful week,
ForecastCity Support Team

TRX/USDTAs part of the correction, work was done on liquidity and the complete filling of the weekly FVG. Growth targets:
Target 1 = 0.27
Target 2 = 0.32
Target 3 = 0.40

TRX HOURLY TIMEFRAME UPDATE (ON DEMAND)❤️ THIS POST AND I WILL SHARE NEXT 10X GEM COIN
#TRX HOURLY TIMEFRAME UPDATE (ON DEMAND)
TRX tokens were ERC-20-based tokens deployed on Ethereum, but a year later they were moved to their own network.
ANY THOUGHTS ON CRYPTOCAP:TRX ?

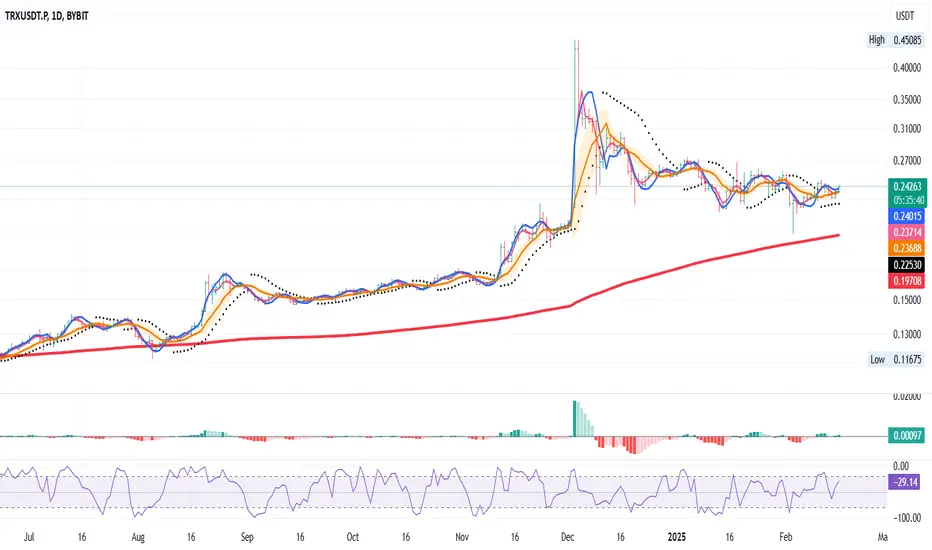
Long Entry Signal for TRX/USDT - Trading System Confirmation
Based on our custom trading system rules, we have a confirmed entry signal for TRX/USDT today:
MLR Crosses SMA: The Moving Regression Line (MLR) in blue has crossed above the Simple Moving Average (SMA) in pink, indicating a shift towards a bullish trend.
MLR Crosses BB Center Line: The MLR has also crossed over the Bollinger Bands Center Line in orange, further confirming the bullish momentum.
PSAR Flips: The Parabolic SAR (PSAR), shown by black dots, has flipped to green, signaling a bullish trend as it follows the MLR.
Price Above 200-period MA: The current price is above the 200-period Moving Average in red, confirming a long-term bullish trend.
Entry Strategy:
Action: Enter a long position on TRX/USDT based on these signals.
Risk Management:
Trailing Stop: Immediately set your trailing stop at the current PSAR level, which will adjust dynamically with price movements.
Standard Exit Strategy:
Exit: Monitor for when the MLR crosses back below the SMA. This crossover will signal a potential end to the bullish trend and an opportunity to exit the position.
This signal presents a potential trading opportunity according to our system's parameters. Remember, always consider additional analysis and risk management practices before making trading decisions.
That is it
Disclaimer: This idea is for educational purposes only and should not be considered financial advice. Always do your own research or consult with a financial advisor before trading.
TXR Completes Bullish Wedge PatternTXR Completes Bullish Wedge Pattern
Recently, TXR completed a bullish wedge pattern. Following a price decline to 0.2300, a strong bounce indicated that bullish momentum remains high.
The breakout from the pattern looks promising, increasing the likelihood that TXR will test the top of the structure it occupied in recent weeks, as shown in the chart.
Key resistance areas: 0.2450 and 0.2560
You may find more details in the chart!
Thank you and Good Luck!
❤️PS: Please support with a like or comment if you find this analysis useful for your trading day❤️

Is TRX ready to ascend?Hello dears, I think trx can see higher numbers in the coming days. But before that, it needs to collect some liquidity: liquidity from the form of artificial stop-losses. As you can see in the chart, if the price enters a correction phase, the price range of 0.2320 is where you should look for signals for long trades. If the price crosses $0.23, the above analysis will be invalid.
Disclaimer: Trading in financial markets is risky and this analysis should not be used as a trading criterion. Naturally, the trader will be responsible for any potential profits or losses.

Lingrid | TRXUSDT Bullish Setup. Potential Buying OpportunityThe price perfectly fulfilled my last idea. The market exhibited a false breakout below the prior support level of 0.2170, essentially breaching the December low before subsequently rebounding. Price then surpassed the 0.2300 level, a previously respected resistance. On the weekly chart, a long-tailed candlestick formed, suggesting a potential price movement towards the resistance zone around 0.27000. I anticipate a retest of the channel border, as historical price action demonstrates multiple bullish reversals from this area. My goal is resistance zone around 0.2535
Traders, if you liked this idea or if you have your own opinion about it, write in the comments. I will be glad 👩💻

trx next bull**TRX Next Bull: Riding the Wave of Innovation and Growth**
As one of the most dynamic cryptocurrencies in the digital asset space, **TRON (TRX)** continues to capture the attention of investors, developers, and blockchain enthusiasts worldwide. With its mission to decentralize the web and empower content creators, TRX is poised for its next bull run—a surge driven by technological advancements, strategic partnerships, and an ever-expanding ecosystem.
### Why TRX Could Be the Next Big Winner:
1. **Scalability and Speed**: TRON's high throughput and low transaction fees make it a preferred platform for decentralized applications (dApps), DeFi projects, and NFT marketplaces. Its ability to process thousands of transactions per second positions it as a leader in scalability.
2. **Growing Ecosystem**: From gaming and entertainment to finance and social media, TRX powers a diverse range of use cases. The rise of TRON-based dApps like BitTorrent, Sun Network, and JustLend showcases its versatility and adoption potential.
3. **Strategic Partnerships**: TRON has consistently forged alliances with global brands and institutions, enhancing its reach and credibility. These collaborations are instrumental in driving mainstream adoption and utility for TRX.
4. **Community Support**: Backed by a passionate and engaged community, TRX benefits from grassroots support that fuels innovation and adoption. This strong network effect amplifies its influence in the crypto sphere.
5. **Regulatory Clarity**: As regulatory frameworks around cryptocurrencies evolve, TRON's compliance-focused approach ensures it remains at the forefront of legitimacy and trust.
6. **Bullish Market Sentiment**: With increasing interest in blockchain technology and cryptocurrencies, TRX stands ready to capitalize on favorable market trends. Analysts predict renewed investor confidence could propel TRX to new heights.
### What to Watch For:
- **Upcoming Upgrades**: Keep an eye on TRON’s roadmap for enhancements such as improved consensus mechanisms or Layer-2 solutions.
- **Adoption Metrics**: Monitor user growth, transaction volumes, and dApp activity to gauge momentum.
- **Market Catalysts**: Major announcements, institutional investments, or integrations into real-world industries could ignite the next bullish phase.
The future looks bright for TRX as it cements its role in shaping the decentralized internet. Whether you're a seasoned investor or a newcomer exploring opportunities, TRX’s next bull run might just be the perfect time to join the revolution. Stay informed, stay agile, and get ready to ride the wave of innovation with TRON! 🚀

Tron (TRX): Sellers Sending Price Back To The Roots of $0.21Despite a steep downward movement on bigger timeframes, sellers are not showing any remorse here as well, where they keep on pushing and pushing price back down.
If this kind of pressure continues, our next point of interest is going to be the $0.21 area, but if we see a proper recovery, not just some liq move, then we have also placed a possible target zone for upward movement once a certain zone is secured!
Swallow Team

Tron (TRX): Possible Pump Incoming? Tron coin is moving on its own flow where buyers have recently recovered a few zones and price seems like it might push to upper zones now.
We have 2 targets here, one is short-term and the other is mid-term and those targets will be optimal as long as buyers hold the 100EMA zone.
Swallow Team

Tron (TRX): Possible Fill of CME Gap This WeekTron coin seems decent for a potential upward movement to follow anytime from here. After having a decent dump during the weekends, the price left a pretty big CME gap, which we might be going to fill.
We are looking for an BoS to form after what we are going to look for upward movement so eyes wide open!!
Swallow Team

Buy time: When supported around 0.2209
Hello, traders.
If you "Follow", you can always get new information quickly.
Please click "Boost".
Have a nice day today.
-------------------------------------
(TRXUSDT 1D chart)
The chart was broken due to the surge on December 3rd.
-
The Fibonacci ratio 1.902 (0.2135) ~ 2 (0.2217), where the surge began, is an important support and resistance area.
Also, the M-Signal indicator on the 1W chart is passing around 0.2209, showing the role of important support and resistance.
If the price is maintained around the 5EMA+StErr indicator and rises above the MS-Signal indicator, there is a high possibility that it will turn into a short-term uptrend.
However, since a high boundary zone is formed in the 0.2543-0.27 section, it is important to see whether this section can be broken upward.
Therefore, if possible, I think it would be good to buy when the MS-Signal indicator approaches 0.2209 and shows support near 0.2209.
The reason is that it plays the role of a trend reversal based on the MS-Signal (M-Signal on the 1D chart) indicator.
In other words, it plays the role of support and resistance.
-
If it falls based on the Fibonacci ratio 1.902(0.2135) ~ 2(0.2217) section,
1st: Fibonacci ratio 1.618(0.1888) ~ 0.1967
2nd: 0.1567-0.1712
You need to check whether there is support near the 1st and 2nd sections above.
-
Thank you for reading to the end.
I hope you have a successful trade.
--------------------------------------------------
- Big picture
I used TradingView's INDEX chart to check the entire section of BTC.
(BTCUSD 12M chart)
Looking at the big picture, it seems to have been maintaining an upward trend following a pattern since 2015.
In other words, it is a pattern that maintains a 3-year uptrend and faces a 1-year downtrend.
Accordingly, the upward trend is expected to continue until 2025.
-
(LOG chart)
As you can see from the LOG chart, the upward trend is decreasing.
Accordingly, the 46K-48K range is expected to be a very important support and resistance range from a long-term perspective.
Therefore, we do not expect to see prices below 44K-48K in the future.
-
The Fibonacci ratio on the left is the Fibonacci ratio of the upward trend that started in 2015.
In other words, it is the Fibonacci ratio of the first wave of the upward wave.
The Fibonacci ratio on the right is the Fibonacci ratio of the upward trend that started in 2019.
Therefore, it is expected that this Fibonacci ratio will be used until 2026.
-
No matter what anyone says, the chart has already been created and is already moving.
It is up to you to decide how to view and respond to this.
When the ATH is updated, there are no support and resistance points, so the Fibonacci ratio can be used appropriately.
However, although the Fibonacci ratio is useful for chart analysis, it is ambiguous when used as support and resistance.
This is because the user must directly select the important selection points required to create Fibonacci.
Therefore, since it is expressed differently depending on how the user specifies the selection points, it can be useful for chart analysis, but it can be seen as ambiguous when used for trading strategies.
1st : 44234.54
2nd : 61383.23
3rd : 89126.41
101875.70-106275.10 (Overshooting)
4th : 134018.28
151166.97-157451.83 (Overshooting)
5th : 178910.15
-----------------

trxust pending whales order to be filledWhenever price pumped suddenly after a huge sell off the whales enters in the market with huge orders but few gets filled and few left behind. Then MM pushes price to fill that remaining orders, I have marked 50% of that wick where I expect have limit orders and we will buy with them.

TRX/USDT 1H: Distribution in Premium Zone – Downside to $0.2150?TRX/USDT 1H: Analysis
🚀 Follow me on TradingView if you respect our charts! 📈 Daily updates!
Market Condition:
Price consolidating at $0.2220, maintaining a bearish bias with a distribution pattern evident.
RSI at 42.17 showing hidden bearish divergence, aligning with continued selling pressure.
Market Makers actively distributing within the $0.2230-$0.2250 zone.
Key Levels:
Resistance: $0.2250 (Fair Value Gap - FVG).
Support: $0.2200 (weekly low).
Critical Support: $0.2150 (major liquidity level).
Trade Setup:
Entry Zone: $0.2230-$0.2240.
Targets:
T1: $0.2200 (near-term support).
T2: $0.2150 (critical liquidity level).
Stop Loss: Above $0.2265 (clear invalidation).
Risk Score:
8/10 – Tight range offers favorable R:R, but high risk due to volatility near key levels.
MM Behavior:
Distribution phase evident at premium levels ($0.2230-$0.2250).
Likely targeting liquidity below $0.2200, with potential sweep of lows before any meaningful reversal.
Recommendation:
Wait for entry at resistance levels between $0.2230-$0.2240. Avoid chasing current price.
Maintain tight stops at $0.2265 to limit risk.
Downside bias suggests further movement toward $0.2150 before potential reversal.
Confidence Level:
7/10 – Bearish structure supports further downside, but key levels require monitoring for reversals.
🚀 Follow me on TradingView if you respect our charts! 📈 Daily updates!

Tron (TRX): 200 EMA Been Working Too Well / Might Break Soon!Tron coin has been respecting that 200 EMA way too much, where now we are expecting to see a change in character soon and a break of EMA, which would then result in a smaller downward movement for the coin.
More in-depth info is in the video—enjoy!
Swallow Team
