Next year TURBO can hit 0,70 and more !!This Chart show how high can Turbo go next year until June 25.
TURBOUSDT trade ideas

Turbo = A small drop and really good rallyHello Everyone. My name is Omid and I'm a newbie trainer in crypto market.
I use nds strategy for my predictions
For Turbo my prediction is that as you can see at the moment we might have a slight correction down to 0.0086 and after that with proper volume we definitely gonna have a rally to drawn targets
NOTE: I'm gonna wait till drop happen then will buy . The long position is for showing boundaries only .
wish everyone great luck

TURBO BREAKOUT ALERT: READY FOR A 150-160% SURGE!Hey everyone!
If you’re finding value in this analysis, don’t forget to hit that 👍 and follow for more updates!
TURBO is showing strong momentum! It’s breaking out of a bull flag formation on the 4-hour chart and has successfully retested the pattern, signaling readiness for a potential 150-160% rally. Accumulate some now and consider adding on any dips.
Entry Range: $0.0092 - $0.0099
Target: 150-160% gain
Stop Loss: $0.0084
This setup shows a powerful bullish trend for TURBO Coin! What are your thoughts on its potential? Share your analysis and insights in the comments below!

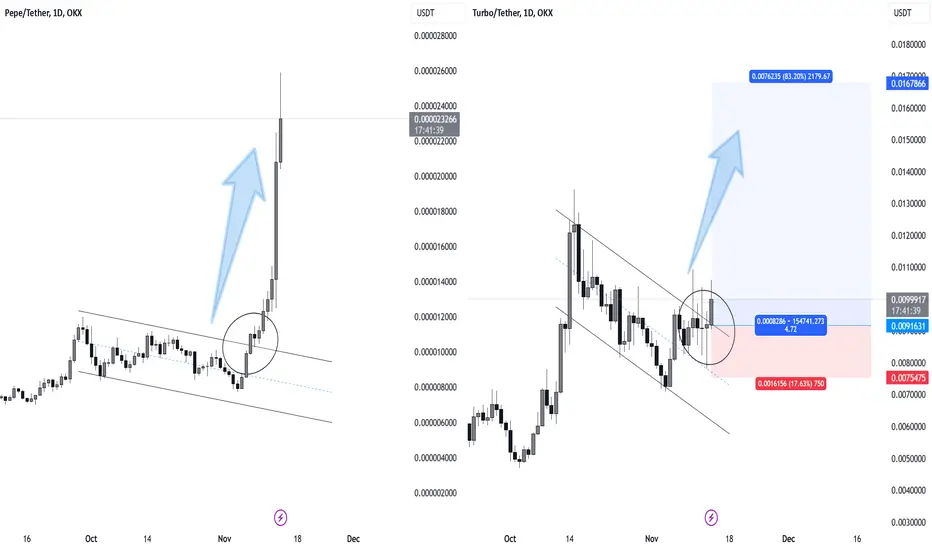
TURBO/USDT Analysis$TURBO/USDT Analysis :
Following the strong rally of $PEPE/USDT, which broke out of a descending channel and surged upwards, there are signs that $TURBO/USDT could follow a similar bullish trajectory.
Entry Level : The current price around 0.0091631
Target Levels : The next target is set at 0.0167866
MYX:TURBO is expected to follow a similar bullish pattern to CRYPTOCAP:PEPE after its breakout from the descending channel. This presents a strong upside opportunity if the buying interest continues with similar momentum.
Inverse Head and Shoulder confirmed!!!!inverse head and shoulder is now confirmed,
TP1 around .0108
TP2 around .0126
TP3 .0138
SL below .008
trade active.

Turbo/Usdt - Trade Plan - 4HR TFDaily pull back phase, over all bullish structure, below liquidity swept, waiting for 15 min choch to shift to enter in the trade.
NFA - Dyor
this is my personal trade plan.

turbo usdt turbo usdt Going like the last scenario, 400% in two weeks... inside the channel
trade save
good luck ..


Turbo updateNot sure how to show my previous idea, but take a look at it. Price hit exactly my POI. We are on the way back up, to possible 0.02 cents, but there’s no really telling how far it could shoot, as there’s nothing to the left after recent swing high, before this short down trend

Turbo new ATHTurbo looks like its preparing for a new ATH. Falling wedge has been broken, looks like its retesting and then will prepare to go up to around 0.018. Would be a massive move and a beautifull timing if BTC goes to 80K as well.
Falling wedge^
No FA!
DYOR!

#TURBO/USDT#TURBO
The price is moving in a descending channel on the 1-hour frame and sticking to it well
We have a bounce from the lower limit of the descending channel, this support is at 0.007070
We have an upward trend, the RSI indicator is about to break, which supports the rise
We have a trend to stabilize above the moving average 100
Entry price 0.007540
First target 0.008144
Second target 0.008680
Third target 0.009430

TURBO BOOST - TRADE PLAN + TECHNICAL ANALYSISPrice Levels and Trend Analysis:
The chart shows significant support and resistance levels:
Resistance zones around 0.0130, 0.0110, and 0.0090 USDT.
Support zones around 0.0070 and 0.0060 USDT.
The overall trend has been bearish, with the price declining from its previous high near 0.0130 USDT to its current level around 0.0077 USDT.
Recently, the price seems to be consolidating near the support level of 0.0070 USDT, potentially forming a base for a rebound.
Volume Analysis:
Volume shows mixed signals with some high spikes, but these don't seem to have led to a sustained upward movement, indicating weak buying pressure.
The latest increase in volume is worth watching; if buying volume increases, it could signal potential accumulation around the support area.
Indicator Analysis:
VMC Cipher B: Shows potential bullish divergence as the momentum oscillators signal reduced selling pressure. If momentum continues to turn positive, it may indicate an upcoming bullish reversal.
RSI (14): Currently around 44.62, which is below the neutral 50 line, indicating bearish momentum but nearing oversold territory.
Stochastic RSI: Oversold, around 37.95, with a slight upward turn, which may indicate a potential bounce if it continues to move up.
HMA Histogram: Shows a mild shift towards green, suggesting a potential reversal if it continues.
Current Market Sentiment:
The indicators show early signs of a bullish reversal, though confirmation is necessary. This could mean a potential bounce from the 0.0070 support level in the short term.
Professional Trading Plan for TURBO/USDT:
Entry Strategy:
Aggressive Entry: Enter at the current price (0.0077 USDT) with a tight stop loss, based on the early signals of a reversal and potential for a bounce from the support level.
Conservative Entry: Wait for a confirmed breakout above the 0.0080 level with strong volume to signal strength.
Stop Loss:
Place a stop loss slightly below the 0.0070 support level, around 0.0068 USDT, to limit downside risk in case of further declines.
Target Levels:
Short-term Target: 0.0090 USDT (near the first resistance level).
Medium-term Target: 0.0110 USDT if momentum continues.
Long-term Target: 0.0130 USDT, aligning with the upper resistance level from the chart.
Risk Management:
Use no more than 1-2% of capital on this trade due to the potential volatility and early nature of the reversal signals.
Consider adjusting the stop loss to breakeven once the price reaches 0.0090 to secure partial profits.
Trade Management:
Monitor the VMC Cipher B and RSI for continued bullish momentum. If momentum weakens near resistance levels, consider taking partial profits.
Re-evaluate if the price breaks below 0.0070, as it would invalidate the bullish setup and signal potential for further downside.
TURBO/USDT is showing early signs of a potential bounce from support at 0.0070. A cautious approach with tight risk management is recommended. Look for increased buying volume and confirmation from momentum indicators before taking more aggressive positions.

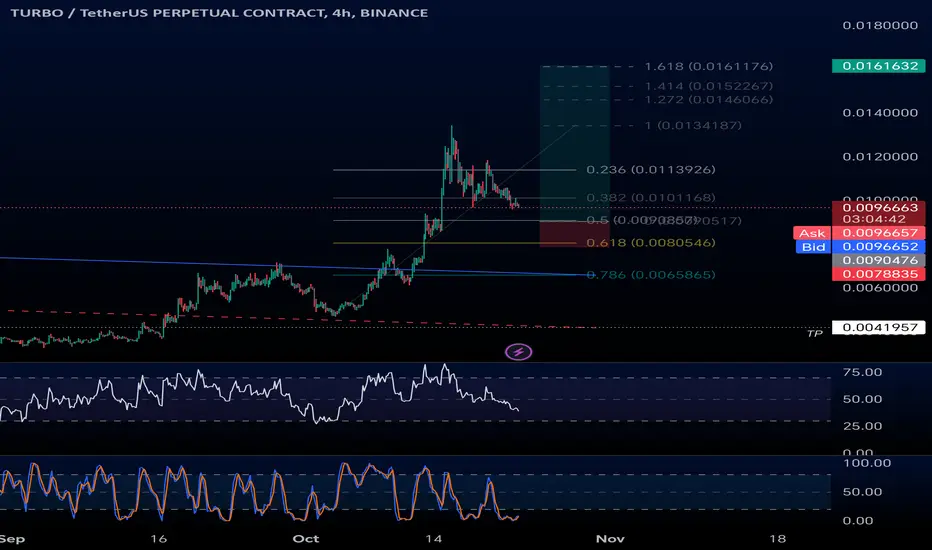
Potential Upside for TURBO/USDT: Fibonacci Levels in Sight
The price action on TURBO/USDT shows promising bullish momentum, with a key support level at 0.0070. For the uptrend to continue, a strong rebound from this level is essential. Currently, the EMA ribbon is also bullish, indicating underlying momentum and providing dynamic support as the price moves upwards.
Using Fibonacci extensions, we identify potential upside targets at 0.0155 and 0.0210, offering attractive levels for profit-taking. If the price maintains support at 0.0070, it could gain momentum towards these Fibonacci extensions, marking significant growth potential.
👨🏻💻💭 Ready to catch the next wave? 📈 Share your thoughts below and let’s boost this idea together!
_________________________________________________________________
The information and publications within the 3Commas TradingView account are not meant to be and do not constitute financial, investment, trading, or other types of advice or recommendations supplied or endorsed by 3Commas and any of the parties acting on behalf of 3Commas, including its employees, contractors, ambassadors, etc.

Turbo/usdtbelow is a demand zone of a HTF, currently playing a dangerous play of a short setup of a retracement.

TURBO is Set to Run Hard Soon!TURBO is Set to Run Hard Soon! 🚀
The bi-weekly chart is screaming a buy, and it’s currently sitting above the most recent order block. This one has massive upside potential, currently at a $400M market cap. We could see a solid 5x from current prices, which is very promising! There’s even a 45x target, but that feels a bit out of reach—though it’s definitely ambitious!
The meme cycle is firing up strongly, and we can’t let this opportunity slip by. We need to capitalize now, as the narrative and momentum are validating our entries.
Let’s get ready! 💪

do you agree with me?The overall trend is upward and it is on a very good support, the possibility of an increase is high
Just because we are rejecting from the midline of the channel, it can cause the channel to break from the bottom
⚠️ Do capital management to survive ⚠️

Run it back TURBO?It seems this memecoin is taking its last breath before running out of fuel. We’re now in the final 5th wave, with an anticipated lower-degree wave 2 pullback. This pullback could bring a 2x to 3x pump—or more—if Bitcoin delivers a god candle.

TURBOUSDT: Ready for a Breakout After Healthy Retracement!!TURBOUSDT has retraced to a previous support level following a failed pennant pattern breakout. However, the recent price action shows a strong attempt to break out again, supported by increasing volume. If TURBO successfully breaks above the pennant, we can expect a significant upward movement. Keep an eye on key levels for entry and potential targets as momentum builds. This could be the opportunity traders have been waiting for!
TURBOUSDT Currently trading at $0.0055
Buy level: Above $0.0055
Stop loss: Below $0.0044
TP1: $0.0071
TP2: $0.0085
TP3: $0.01
TP4: $0.015
TP5: $0.02
Max Leverage 3x
Follow Our Tradingview Account for More Technical Analysis Updates, | Like, Share and Comment Your thoughts

#TURBO/USDT#TURBO
The price is moving in a descending channel on the 4-hour frame and sticking to it well
We have a bounce from the lower limit of the descending channel and we are now touching this support at a price of 0.0092200
We have a downtrend on the RSI indicator that is about to be broken, which supports the rise
We have a trend to stabilize above the moving average 100
Entry price 0.009552
First target 0.010277
Second target 0.011034
Third target 0.011924

Turbo retraced and looking for some bullish signsIf btc shows some signs of pushing back up I believe might see a reaction from turbo.
Keeping an eye on this level

Turbo next leg up may be hereTurbo just finished the first leg of the bull run and has since consolidated, now it seems to be ready for the next leg up.
My trade idea is as follows:
Tp1@.0138
Tp2@.0186
SL@.00984
Any suggestions or thoughts?

TURBO/USDT - 10/17/2024 - Descending wedge being broken at 15mTURBO/USDT is at an all-time high, showing a bullish continuation pattern when trying to break out of the descending wedge in the 15m after reaching a 1-hour oversold level on the relative strength index in search of an ascending bottom on the daily chart time
