NowAs a follow on from the previous posts. This is a zoom in to a 15 min chart with a little color to help as a visualization on the travel down to the black line symbolizing the (fractural) low.
Please remember that charts as in life do not always go as anticipated and the occasional loss is to be expected.
Be ready to change your strategy as needed. Which would suggest one would have more than one strategy available. (up opposite to down))
TURBOUSDT trade ideas

And the bigger picGoing from memory now as I made this for you.
The black Verticle lines are the lows. The blue verticle lines are the highs.
The orange are the trending low for sequence, with the red the previous. The purple is the previous high.
Um. I can't refer to the pic as I write this. I think I left the little black lines to show my 5 min chart analysis.
I put two lines to show how low I think it could go before entering the next ATH, marked in blue.
We should hit the lowest point of either yellow or orange (really, this is just a guess) around the last black mark before entering an upswing to ATH. Or at least a good upswing of magnitude.
Hope this helps.
Basically. Turbo is in a downtrend. Go with it.
Look for entry in the continuation of the downtrend (pullbacks, local highs), take your profits and go again.
Around the time of the black verticle line. Hodl.
When you see a serious break in structure (before or after the black verticle), the uptrend has begun.
Once this happens. Get in to the upside and hold on!

Futher analisys as askedThis is a shot of the previous high and subsequent low. With the orange as the two lows (notice the lower before the high)
The two black vertical lines gives us some idea how fast this system is moving. From high to low is around two months. From each high to the next is around 3 months (no guarantee this will continue)
I THINK we are somewhere in the green box.

Last chance to get in. Falling wedge breakout!!! Baby Pepe back tested it’s breakout of the wedge perfectly. For conservative traders wait see to see if we close above the 50 ema on the 12hr. Not FA

Turbo chart - Possible bull runTurbo seems to want to reverse the downtrend and go on a bull run. The key levels are given by the horizontal lines. the diagonal lines are the support for the up movement. Once those fail there is the possibility of a reversal.
This is done using an experimental method inspired by Da Vinci. This is not financial advice.

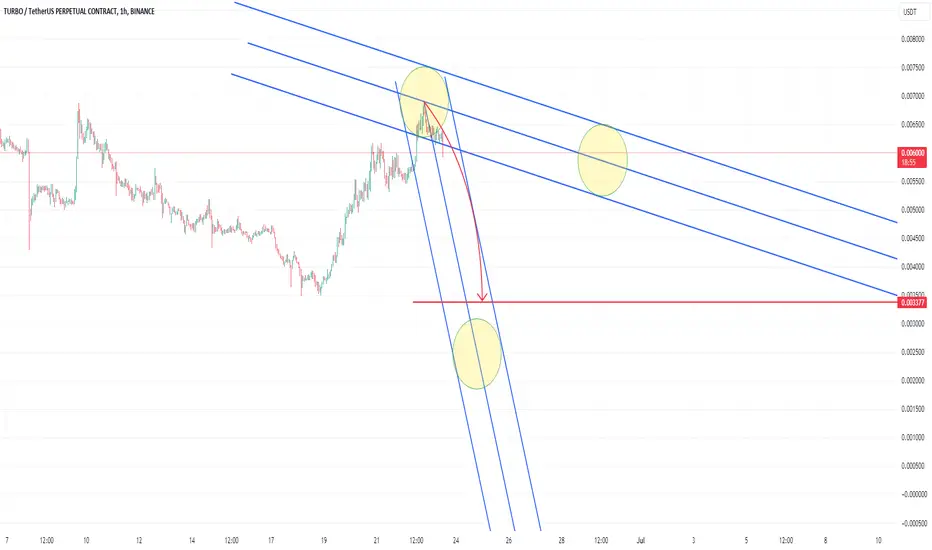
Turbo coin ShortTurbo chart.
This is done using an experimental method based on Da Vinci research I have done over a lot of years.
In theory the price should dump to the point indicated by the red line. Once it goes to the side and on top of it there is the potential of reversal. Ideal targets are at the circles also
This is not financial advice
TURBOUSDT making higher highsEnF Breakout Strategy signaled BUY on TURBOUSDT
See idea for breakout entry, targets and stoploss
Only enter the trade when the price breaks above entry
Check out more on the script:
To get access to this script, DM me

TURBOUSDTHM signal v5.0 (High momentum) spotted. Looking good with previous wave up with increasing volume and momentum.
- Heathy retracement and support well at good level @ 0.005646-0.005696
- Trending slow and steady if able to hold above the support zone
It is at extremely good reward to risk level now if able to hold above the support level.

TURBOUSDT moving higherEnF Breakout Strategy signaled BUY on TURBOUSDT
See idea for breakout entry, targets and stoploss
Only enter the trade when the price breaks above entry
Check out more on the script:
To get access to this script, DM me

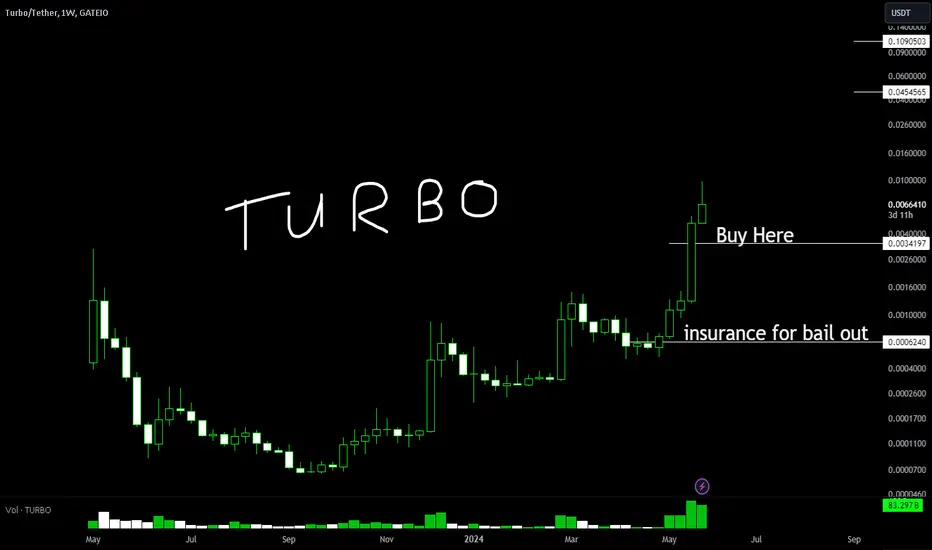
$Turbo consolidating Support in line with BTCLooks like Turbo is consolidating and testing support levels before setting a new all time high, nBTC is also setting to support a bulling lag in the weekly frame.
*This is not investment advice but rather a request for the community to share their thought strictly for academic purposes.*
MEXC:TURBOUSDT OKX:TURBOUSDT

TURBO Needing a break, I switched to another currencyAfter the good profit we got from this currency, as I said a few days ago, it has entered the correction phase, you can exchange it with another currency that has growth potential.

TURBOUSD - Look for the Double TopPrice has reached the top of this curved channel and has broken above it.
Despite breaking above, I think price will still act bearishly, producing a double top, leading price back into the curved channel.
If the curved channel hodls its structure price could go higher. 4 Hr Chart.

Trading opportunity for TURBOUSDTBased on technical factors there is a Buy position in :
📊 TURBOUSDT
🔵 Buy Now
🪫Stop loss 0.0047500
🔋Target 1 0.0067000
🔋Target 2 0.0083000
🔋Target 3 0.0099000
💸RISK : 1%
We hope it is profitable for you ❤️
Please support our activity with your likes👍 and comments📝

$Turbo potential trading ideathis is not investment advice or an attempt to sell anything but rather a request for you all to share your thoughts via comments.
Since turbo is having spectacular drops(disproportionate to the markets drop) and has no use case do you think another massive drop is incoming?
please provide your outlook as well as you thought process behind it, "Turbo to the moon" like a zombie is not acceptable. explain your thoughts please.

TURBO floor busted wide openMYX:TURBO floor of 0.006 has been busted wide open so expect a move down to .0055 to 0.005 as that is the former resistance now turned support.

TURBOUSDTHello traders hope you are enjoying our Analysis.
Now we are here again with a new trading opportunity ,we will discuss today about TURBOUSDT
smart money concept analysis: Don't get caught in whale traps. What do you think of this idea? What is your opinion? Share it in the comments📄🖌 If you like the idea, please give it a like. This is the best "Thank you!" for the author

TURBOgreat opportunity to go long on the new AI meme coin.
look like a flag pendant has formed. 10x potential with relatively easy stoploss since .06 is clearly being protected.

TURBO - ( Easy 5000 % This Bull Run ) Dont miss the chance ☑️Pair Name : TURBO/USDT
Time Frame : 4hrs Chart / Close
Scale Type : Large Scale
------
🛡 spreading knowledge among us and to clarify the most important points of entry, exit and entry with more than 5 reasons
We seek to spread understanding rather than make money
⌛ Key Technical / Direction ( Long ) / Spot Market
Type : Mid Term Swing
———————————
Bullish Break
0.0064 Area
Main Entry Point / Spot
Target's
💵Phase 1
Target Range 400 %
💵Phase 2
Target Range 900 %
💵Phase 3
Target Range 1900 %
💵Phase 4
Target Range 3800 %
💵Phase 5
Target Range 7600 %

#TURBO/USDT rejecting from the Diagonal Trendline again#TURBO/USDT rejecting from the Diagonal Trendline again and again in 1-Hour TF!
MYX:TURBO needs to clear the diagonal Trendline to gain the bullish momentum. The local support level is PWL $0.00484, and the resistance level is $0.0086.

#TURBO 32% Enter on wedge support after retest & DiveTURBO 32% 🚀🔥🛗🔥>>>
#TURBO 32% Enter on wedge support after retest & Dive

TURBO 30% Hot Setup Formed a slanted Cup& Handle, Its Ready TURBO 30% 🚀🔥🛗🔥>>>
TURBO 30% Hot Setup Formed a slanted Cup& Handle, Its Rocket - Ready 🚀🔥🛗🔥

Breakout of falling wedge patternLooking for continuation to the upside as turbo has bounced off of the 0.0055 level as well as broken out of the falling wedge pattern and is now finding support on the 20 SMA on the 1 hour.

TURBO: $0.0065 | Finding an Entry towards the next 10xcreated by the MANN done thru OpenAi chatgpt
float secured by Gate and Okx
though supply is public at large
Futures determine the direction of the price
size em well
as this is heavily participated by big shot gamblers and degens