#T/USDT#T
The price is moving within a descending channel on the 1-hour frame, adhering well to it, and is heading for a strong breakout and retest.
We are seeing a bounce from the lower boundary of the descending channel, which is support at 0.01704.
We have a downtrend on the RSI indicator that is abou

Threshold Network(T) Analysis: From Bear Trap to Bullish TrendAs long as Bitcoin ( BINANCE:BTCUSDT ) and Ethereum ( BINANCE:ETHUSDT ) are in a range, it is a good opportunity to take advantage of the movement of other tokens and take a look at their charts.
Today, I want to analyze the Threshold( BINANCE:TUSDT ) project for you, which has increased by

TUSDT 1WT ~ 1W Analysis
#T This trade is very high risk. Buy from here with a short -term target of at least 20%+. This is the lowest support for now.
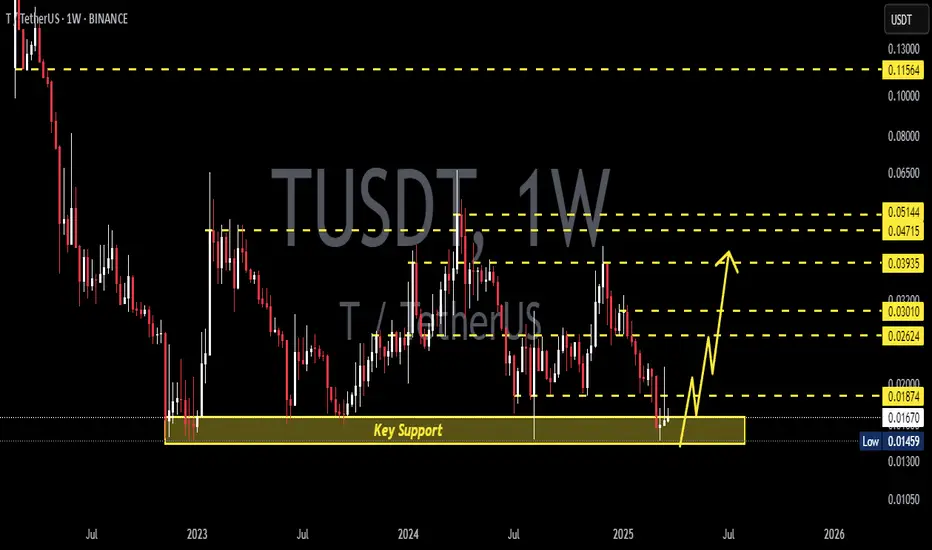
T/USDT: The Bottom!Trading Strategy for T/USDT
Update:
T has reached its bottom level of $0.0146. Based on historical price action, it rebounded 300% after hitting this exact level.
Trade Setup:
~ Accumulation: $0.0145 – $0.018
~ Target 1: $0.054
~ Target 2: $0.172
~ Trade Type: Spot
~ Timeframe: Q4 2025
Note: Thi

T USDT Simple AnalyisisBuying Condition-- If Weekly Candle closes above 0.015
Stoploss Condition-- If Weekly Candles closes below 0.015
Just Very Simple Myth
Targets are shown in the graph with Red lines TP-01 and TP-02

TUSDT 1D#T has broken the falling wedge pattern on the daily chart and is now facing the MA50. In case of a breakout above the MA50, the targets are:
🎯 $0.03401
🎯 $0.03684
🎯 $0.03967
🎯 $0.04370
🎯 $0.04884

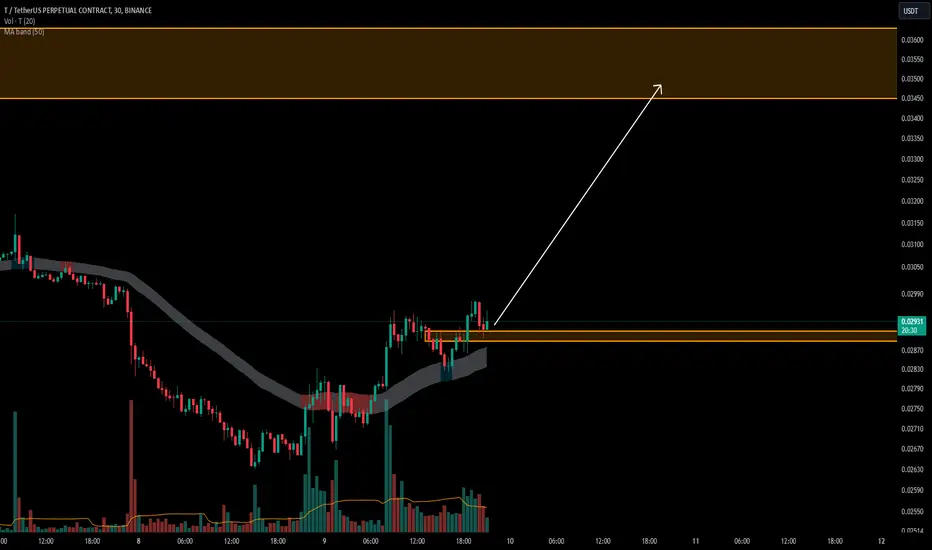
T/USDTKey Level Zone : 0.02888 - 0.02910
HMT v4.1 detected. The setup looks promising, supported by a previous upward/downward trend with increasing volume and momentum, presenting an excellent reward-to-risk opportunity.
HMT (High Momentum Trending):
HMT is based on trend, momentum, volume, and market
#T (SPOT) entry (0.026- 0.032) T.(0.13600) SL(0.02579)BINANCE:TUSDT
entry range (0.026- 0.032)
Targets ( .034 - .045 - .048 - .059 - 0.065 - 0.095 - 0.1149 - 0.136 )
SL .4H close below (0.02579)
______________________________________________________________
Golden Advices.
********************
* collect the coin slowly in the entry range.

Is the threshold coin ready for intergalactic flight?Dear Traders,
I would like to bring your attention to a promising opportunity, the NYSE:T coin. As you may have observed, the triangle breakout occurred successfully last week, followed by a positive retest. Currently, we are witnessing a significant increase in daily trading volume and a favorab

T price analysis. Fix profit at this targetsWhere more than ok to fix profit GATEIO:TUSDT
Possible Targets and explanation idea
➡️IAP model still relevant since Feb 2022. Invalidation drop under listing price
➡️Long time like you can see accumulation around the best block to buy 0.78/0.86 lvl
➡️2 times we tested 0.5 level like resistance

See all ideas
Summarizing what the indicators are suggesting.
Oscillators
Neutral
SellBuy
Strong sellStrong buy
Strong sellSellNeutralBuyStrong buy
Oscillators
Neutral
SellBuy
Strong sellStrong buy
Strong sellSellNeutralBuyStrong buy
Summary
Neutral
SellBuy
Strong sellStrong buy
Strong sellSellNeutralBuyStrong buy
Summary
Neutral
SellBuy
Strong sellStrong buy
Strong sellSellNeutralBuyStrong buy
Summary
Neutral
SellBuy
Strong sellStrong buy
Strong sellSellNeutralBuyStrong buy
Moving Averages
Neutral
SellBuy
Strong sellStrong buy
Strong sellSellNeutralBuyStrong buy
Moving Averages
Neutral
SellBuy
Strong sellStrong buy
Strong sellSellNeutralBuyStrong buy
Displays a symbol's price movements over previous years to identify recurring trends.