GOLDSILVER trade ideas


The Gold/Silver complex has caught renewed bids this weekShow Me the Money! 23 July, 2020, by Vladimir Rojankovski, Senior Analyst, Grand Capital
The Gold/Silver complex has caught renewed bids this week, which was tipped off by the major gold ETF – SPDR Gold Trust – showing up on the "Doji Week" scan back on Monday. The Doji Week scan is designed to find stocks that are in narrow ranges compared to prior week's activity that is geared up for a stronger directional move.
There are a number of Gold/Silver - related ETFs and stocks appearing on the Wide Range Breakouts, Power Up, and Overbought results today as the market gets behind their momentum against a sliding US Dollar. As investors’ classics – Barrick Gold (GLD) and Newmont Corp. (NEM) – look increasingly overvalued by both investment multiples and technically, new kids on the block, such as Agnico Eagle Mines (AEM) and Kinross Gold (KGC) look increasingly promising. The two latter stocks unveil single digit price-to-sales ratios as opposed to double-digit ones for Barrick and Newmont.

Most Bullish Chart for Silver70:1 GOLD/SILVER ratio is the average ratio when silver is treated as an industrial metal. However, if you believer Silver will be receiving monetary investment demand, like Gold has been, then 70:1 may become the neckline for a much more aggressive silver price and a ratio closer to 20:1 in Silver's favor.
That means if Gold hits $3,000 an ounce like Bank of America forecasts, then Silver should hit $150 an ounce with a 20:1 gold/silver ratio.

Silver in a Coma, Gold holding SteadyMain street still not waking up to what the big boys in gold are doing yet. When they do though, Silver is where the action will be. Gold:Silver ratio targeting 125:1

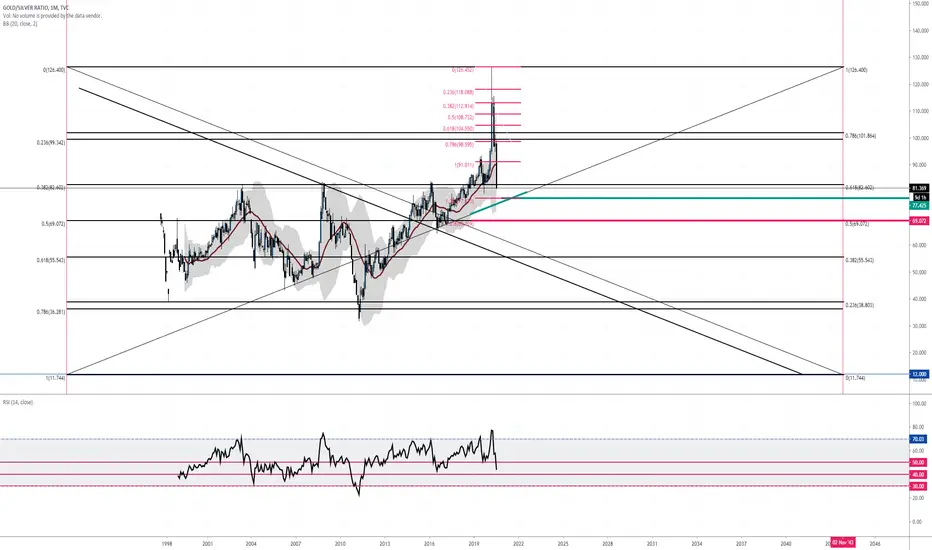
The ratio has reached the line of support.We took the profits from our short position in the ratio, as well as the profits from the silver long position. For now I expect to see some sideways trading and the ratio could pullback towards the 93-94 area. I don't see a reason to go long in this case, however it is an opportunity. If you wish to take the long position in the ratio - bear in mind the fact that the silver market is very strong and the trend could easily be broken without retracing back towards the 93-94 area. To monitor this - close out the long below 87.5 and enter a short position again targeting 81.5. I will make another update as soon as I see some movement.

Gold to make a comebackThat was parabolic for silver. I expect Gold to come back up from the the ratio. But that doesnt mean the fiat price will go up. Silver is overbought.
This is short term, I do expect eventually that the ration will be under 40:1

Silver to hit $400 by 2026?Assessing the G/S ratio and my prediction of $10,000/oz by 2026, the price of silver could potentially hit $400/oz by this time as inflation runs out of control.

Mint Ratio back to normalFirstly, please support our work by clicking like button & or following! These really assist us to reach more investors & traders like you!
Gold/Silver ratio might signal to investors that its high time to stop buying silver.


Gold/Silver Ratio Is FlaggingWhen the gold/silver ratio is high, gold is relatively more expensive than silver, by historical standards. Some people use this ratio to trade between the metals.
For a very long-term investor, the trade works like this: when the ratio is high, buy silver, and wait for the ratio to revert towards its mean. Then, sell the silver and buy gold at a better relative price and wait for the ratio to rise.
Using this oscillation you can accumulate precious metal using nothing but the mean reversion between the two metals.
Now, that said, the 19th century average gold/silver ratio, I believe, is around 47. By those standards, the ratio is extremely high right now. On the other hand, the rise has occurred in a very steady long-term rising trend channel that began during the Great Financial Crisis.
Long-term chart:
It seems to spend ages along one side of the channel before moving to the other and inhabiting that region for quite some time.
The question I cannot answer is: will the historical mean be revisited any time soon, or is the inflated ratio somehow a byproduct of unprecedented central bank intervention?
That said, I will add a couple of comments regarding the short-term picture. During the crash the ratio mooned, breaking out of the channel for the first time in geologic eons, and has since worked its way back in. The process of reentry looks to be taking the form of easily identifiable flagging, and that last flag looks to be breaking.
How would one trade this, if they were so inclined? I if they thought we were heading to the lower bound of the channel, one would buy silver now, and then if we find the bottom of that channel, perhaps swap it for gold, since the channel is gradually rising. That's just a guess. We live in unprecedented times and these assets might become quite volatile in the coming weeks and months.
If one believes we will ever revisit the ratio's very long-term mean in the 40s, they would only hold silver until it does. I have no idea if that will happen.

Gold/Silver ratio on its way to 88.The chart suggests that the correction will continue untill it reaches its long-term support running from 2011. It is quite logical that this will follow after the washout experienced by precious metals in March causing this anomaly when silver lost about 50% of its value in terms of gold. I am expecting the ratio to be equal to 88 by early July. This implies a bullish market for gold and silver, where XAGUSD will outperform. Lookout for updates regarding silver, we will see some interesting price targets and nice trading opportunities.

GOLD/SILVER ratio in the Subprime and COVID crisesI don't know how many of you speculate on the Gold/ Silver ratio but I do. And I have come across an interesting pattern in 2008 during the Subprime Mortgage Crises that may be repeated now during the COVID crisis.
As you see on the chart, the LMACD is the key indicator on it, and it has topped at 0.069. At the same time the price action is very similar with 2008 as the March spike got sold aggressively and is declining towards the 1M MA20 and MA50. A break below may lead to a 2008-like -60% drop in total.
Do you think a potential upcoming global recession can repeat this pattern?
** Please support this idea with your likes and comments, it is the best way to keep it relevant and support me. **


GSRfound 2 hr divergence, could it drop to test lower rail? One more shibang up for the shiny then down could play out.

Gold/Silver Ratio. Silver will follow Gold value!This ratio means how many Silver Oz you need to get 1 Gold Oz.
As you could see, Silver will follow gold value as always happens in crisis cycles. The value will increase incredibly!
Comments are appreciated ;)


Gold/Silver ratio heading lower, but requires one last breakdown...before we can confirm a breakdown in the ratio and that silver is heading much higher. I expect it to breakdown and silver to head to old highs with gold soon.
