GOLDSILVER trade ideas

Silver BulletsAfter years of being forge hammered it looks like the Silver Stackers will get to smile while they check their prices over their morning coffee now ;)
Precious Metal Rally to Continue - SilverI'm looking for the ongoing precious metal rally to take Silver to the $19.75 level, above where we can expect some resistance and possible shorting opportunities. The midpoint for this setup is circled, a clear breakout point.
In addition, there is a supporting setup in the gold/silver ratio chart which may validate the case I'm making for the silver rally...
Look for the ratio to bottom below the 94.24 level. The midpoint here is also a clear breakdown point.
If the two levels mentioned above are reached around the same time, the reversal case will be that much more compelling.

I guess everybody just discovered Silver Its no longer at 5000 year lows so hopefully you bought some. Big move up here overbought so expect a pullback which I will be buying. It looks like the trend of Gold outperforming Silver is changing. Silver is still at 100 years lows so its still very cheap but my current target is $100 Silver and $5000 Gold in 2-4 years.

AU/AG 5.16.20Humans will eventually realize just how important silver is in the coming decades. The fact that weve trashed it for the past 100 years will eventually come back to haunt us. Silver is crazily undervalued and is a precious metal not simply and industrial grade metal. end game silver ratio will be under 20 :1

Gold to Silver Ratio FallingThis ratio shows the amount of silver it takes to equal one ounce of gold in price. When the ratio is rising it means that gold is outperforming silver; when the ratio is falling it means that silver is outperforming gold.
The gold to silver ratio is currently at 106 and falling after hitting an all-time high of 126:1. The average ratio in modern times is about 50:1, with the long-term historical average dating back 5,000 years being closer to 15:1. In recent times, 80:1 was about the peak we would see in the ratio before it would fall again, so the recent jump to 126 was more than likely a once-in-a-lifetime event as silver became severely undervalued compared to gold.
The chart currently shows three yellow price candles which indicates that extreme bullish volatility was experienced in the move up as gold outperformed silver. This was most likely due to investors fleeing to gold due to its main function being a store of value, while silver failed to see the same gains due to it mostly being an industrial metal, and since global production has dropped off during the virus outbreak silver was not in high demand. That trend appears to now be shifting in silver's favor due to the extreme disconnect in the ratio.
The three yellow price candles show a strong move up on the first yellow candle, followed by a second yellow candle with a small body and long lower wick, and now the current price candle is retreating. This three-candle pattern resembles a hanging man reversal candle pattern with the second yellow candle being the hanging man candle. This occurs when the price of an asset sees high demand, and then a sudden pause as traders become indecisive, followed by a reversal. This pattern tends to mark the top of price advance, and since we are looking at the gold-to-silver ratio it likely means that we have seen the end of gold outperforming silver, at least in the short-term, and can expect silver to now begin to outperform gold.
The expected move going forward is a decline in the ratio back to 80:1, and more than likely being followed by an undershoot back down to 50:1. If you're playing precious metals, now would be a good time to go heavier in silver trades and then convert back to gold when the ratio hits 50:1 or lower.

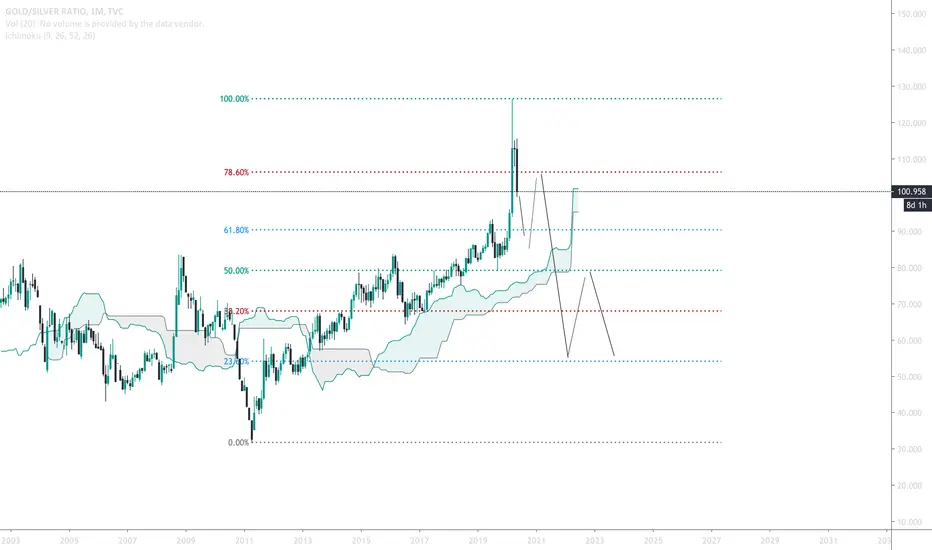
Gold/Silver ratio showing bullish signs for the PM bull run.The breakdown of the ratio is indicative of a bull run in PM. I would expect the ratio to hit 100 in the coming weeks/months and expect a breakdown of the ratio in the coming years as the bull run really gets going.


The Gold to Silver Ratio is Fragile HereThe gold to silver ratio appears to be nearing a breakdown lower. If this were to happen this would be incredibly bullish for both gold and silver. The gains in silver over the coming months would be incredible provided the level of 110 is broken and stays there. I would expect a bounce above 100 once it breaks lower, but then I would expect to see a complete breakdown in the ratio with the gold and silver rally in full swing.

Gold-Silver raito Outlook and Response (Updated May 7th)If the stock market keeps rising rather than falling, silver prices rather than gold will be attractive. The gold-silver ratio trend is a weekly uptrend, and the signs of the recent generation of a weekly resistance key level may be captured, causing the last support key level to collapse. So I recommend buying silver rather than gold. good luck.

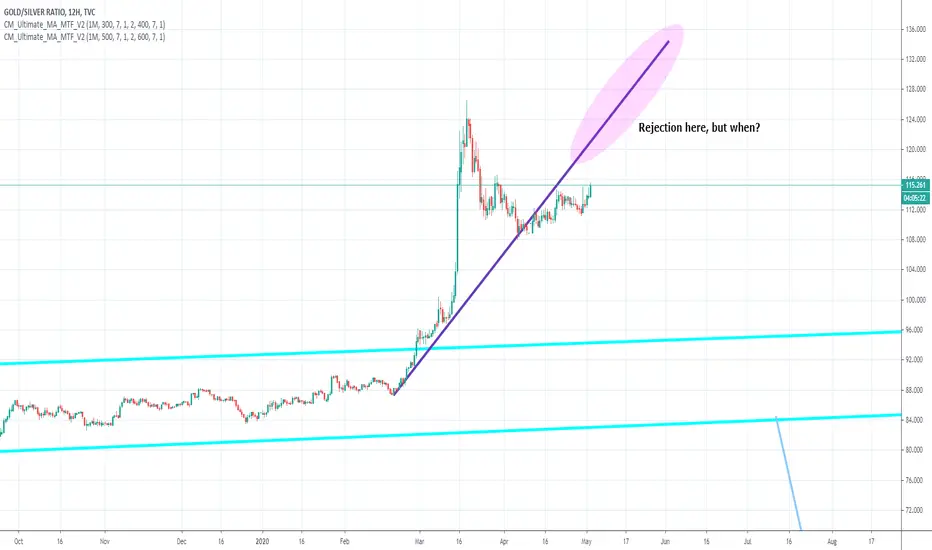
Quickpost: GoldSilver ratio taking way longer than I expected toI am just waiting for the price action to test this nice purple trendline as resistance again. If we set a lower high I expect that we will see the ratio come down rather quickly, but it is possible that price action with interact with this trendline and set a higher high before the price comes down to a more balanced level.
If I had any gold to sell for silver it would be in that oval. As it is I am personally just going to sit on my silver and see about scrapping up some more money to buy more. My target of the initial impuse is own there at around 60.


The Gold Silver Ratio has a big decision ahead.The Gold Silver Ratio is either about to create a second bottom in Silver or will allow Silver to finally join the Gold rally in a bullish move for the precious metals. This technical pattern does not indicate one way or the other what is the most likely outcome, however in a deflationary environment I would expect silver to head lower and therfore the Gold Silver Ratio to head higher one last time.

Gold / Silver Ratio Hits Highest in Over 5,000 YearsThe Longest Record Broken: Gold/Silver Ratio Hits Highest in Over 5,000 Years 🎉🎉🎉
We have data for this series going back a long, long time – during Pharaoh Menes’ time (circa 3100 BCE) for example the ratio was 2½x, whereas in King Hammurabi’s day (circa 1750 BCE) it was 6x. The legendary Greek king Croesus (circa 560 BCE), who supposedly invented gold and silver coins, was more of a gold bug – he used a 13.33x ratio. Emperor Constantine I (280-337 CE) was less so at 10.5x.1
We have more frequent data starting from 1687 that confirms it: yesterday the gold/silver ratio was the highest ever. The ratio peaked at 123.78.
I can’t say exactly what has driven this ratio to the highest level in some 5,120 years, but it does prove one thing beyond a doubt: the financial markets are in an extraordinary, unprecedented situation.
EngineeringRobo's signals worked very well so far! So, Where to short Gold?
Check out @EngineeringRobo 's next signals.

Gold to Silver RatioFollowing up my outlook on silver, this furthers my bullish silver bias. The last monthly close has wicked massively from the topside. Either this is a channel that has broke above and bull trapped or (depending on where you draw your trend lines) it could be a broadening wedge. Either way I would see this as bearish for the gold to silver ratio.
At the very least I surmise that this would have to touch/test/SMASH/DEMOLISH the bottom trend line, right?
To summarise. If this was a price chart for an asset; I would certainly be weary of longing it right now!

GOLD/SILVER RATIO - Descending Trianglegood opportunity to short gold/silver ratio: buy silver and short gold at the same time

Gold-Silver ration long time predictionCrazy prediction for GoldSilver ratio. It is heading down to CoronaTown, all the way to 60 which is the all time modern times average, it will overshoot to the 45 area before bouncing back to the average.

Gold Silver Ratio topping process?Noticing Silver strengthening against gold this morning. Looking for one more surge up, perhaps next week, if it does not take out the highs, perhaps we will see at the minimum, some reversion to the mean. I had been noticing gold stocks weakening over the past few trading days and have pared down, selling RGLD, MAG and a few others. Keeping WPM. Unfortunately, the gold stocks that I would like to own show falling stochastics on the monthly charts so while there may be some decent rallies, I'm wondering if a general deflation scenario along with production and refining shutdowns might affect the gold sector across the board. Want to keep my powder drive awaiting screaming buys should they present themselves.

Quickpost on the Gold Silver RatioPretty straightforward. The ratio was in a wedge depending on how you draw it for at least a decade The blue bars are all cloned off of the wedge hight and it set the target for popping out both the top and bottom. Price action popped first out of the wedge in gold's favor and now as many traders pivot I think we will see over-performance to the downside and we will see the price target clearly taken out over the next six months.
Paper and physical silver prices have very clearly decoupled as some close paper silver and others buy physical. I still see a potential head and shoulders on gold futures as price decouples so the physical and paper strategies vary here.
I also see a potential BARR bottom in the works for silver and that itself calls for giveback as the lead-in trendline is tested. I am going to do a post on that potential BARR later today, so stay tuned.

A Return to the Average Gold to Silver Ratio! - BUY SILVERSilver has underperformed gold, leading to an incredibly elevated gold/silver ratio of 1:120. With FED actions proving to be bullish for precious metals as the government is printing massive amounts of dollars, it's a GO for Silver. The gold/silver ratio could easily return to around 1:40, which would represent a 3x outperformance of silver when compared to gold. BUY SILVER!

Gold/SilverRatio needs to correct?Gold/Silver ratio (how many ounces of silver needed to buy 1 ounce of gold) is historically way over a correction point. I’m watching Silver for the trade of a generation (haha) but I do expect this to pull back to a historical norm.
