NAS100USD: Will Price Fill the Gap?Greetings Traders!
In today’s analysis of NAS100USD, we observe that the market is currently operating within a broader bullish institutional order flow. However, recent price action has left behind an inefficiency—a gap that may serve as a short-term draw on liquidity.
KEY OBSERVATIONS:
1. Gap in Price – Inefficiency Identified:
Price has created an imbalance that is yet to be filled. Typically, such inefficiencies act as magnets for price, drawing it back before resuming its primary trend. In this case, the gap may be partially filled as the market seeks equilibrium.
2. Draw on Liquidity – Last Point of Efficiency:
The last point of efficiency below current price levels may serve as the draw on liquidity. This level could attract price action as institutions look to rebalance orders and facilitate continuation.
3. Active Order Block – Potential Entry Zone:
Price is currently testing a bearish order block. Upon confirmation, this area may offer a short-term selling opportunity with the objective of targeting the liquidity pool and the inefficiency below.
TRADING PLAN:
Entry Consideration:
Look for bearish confirmation within the current order block zone before entering. The goal is to trade the short-term retracement within a bullish environment.
Profit Targets:
Target the liquidity pool and the unfilled gap near the last point of efficiency as short-term objectives.
Remain diligent, patient, and aligned with your trading plan. Always conduct your own analysis to ensure any setup is in harmony with your strategy and risk tolerance.
Kind Regards,
The Architect
NDQ trade ideas

NAS100 | 1H | BUY ZONEHey There;
SIGNAL ALERT
BUY NAS100 / 17,682,18
🟢TP1: 18,000,00
🟢TP2: 18,500,00
🟢TP3: 19,726,64
🔴SL: 16,782,61
RR / 2,2
Please don't forget to like 🙏🏻
Thanks to everyone who supports my analysis with likes. 💙💙💙

Nasdaq market analysis: 23-APRIL-2025Good morning Dear Traders! Join me for Nasdaq market analysis for today. Share your charts, ask questions, and let's discuss trading strategies.

Demand Zone US100 (Potential Long Play) Next week there is a nice opportunity on an identified demand zone on the US100. Due to bullish market Structure, We aim for long positions on demand zones as these are higher probabilities plays than shorts. The demand zone area is the last bearish candle (without upper wick), marked on the 1HR time frame and will be the key area of interest.

NASDAQ MEGA BOUNCE ZONEI want to see a super bounce from this demand zone tomorrow due to the recent reactions around this price level. Lots of interest being shown here. I am sized in pretty heftily on MNQ futures. In a $0 or HERO position. WIll be closing my laptop now...

Hanzo | Nas100 15 min Breaks – Will Confirm the Next Move🆚 Nas100 – Hanzo’s Strike Setup
🔥 Timeframe: 15-Minute (15M)
——————
💯 Main Focus: Bullish Breakout at 19450
We are watching this zone closely.
💯 Main Focus: Bearish Breakout at 19300
We are watching this zone closely.
📌 If price breaks with high volume, it confirms Smart Money is in control, and a strong move may follow.
———
Analysis
👌 Market Signs (15M TF):
• Liquidity Grab + CHoCH at 19460
• Liquidity Grab + CHoCH at 19000
• Strong Rejections seen at:
➗ 19100 – Major support / Key level
➗ 19450 – Proven resistance
🩸 Key Zones to Watch:
• 19450 – 🔥 Bullish breakout level X 3 Swing Retest
• 19460 – Strong resistance (tested 5 times)
• 19100 – Equal lows
• 19500 – Equal highs

X2: NQ/US100/NAS100 Short - Day Trades 1:2 RRX2:
Risking 1% to make 2%
NAS100, US100, NQ, NASDAQ Short for day trade, with my back testing of this strategy, it hits multiple possible take profits, manage your position accordingly.
Risking 1% to make 2%
Use proper risk management
Looks like good trade.
Lets monitor.
Use proper risk management.
Disclaimer: only idea, not advice

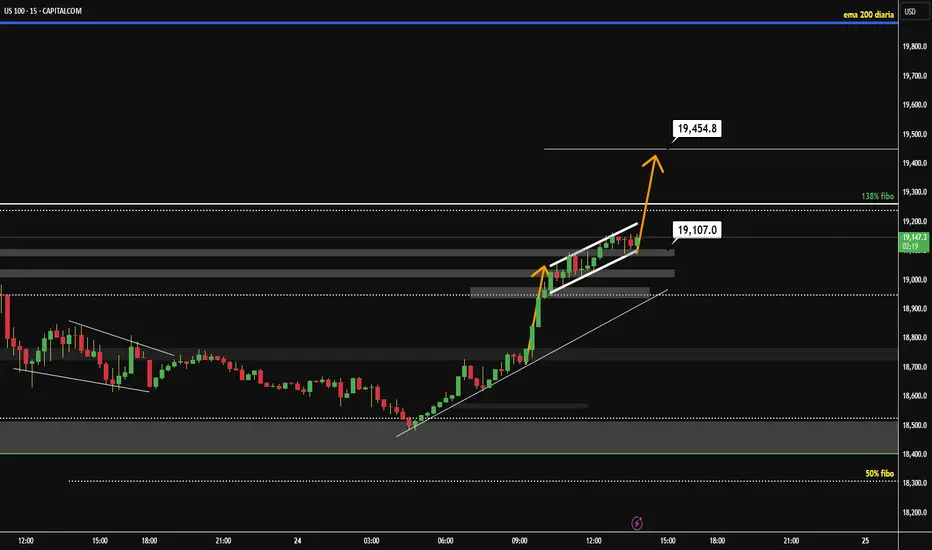
Bullish Continuation Setup Towards📈 US100 - Bullish Continuation Setup Towards 19,454.8 🚀
After a strong impulsive move, US100 is consolidating inside a rising channel, forming a classic bull flag structure. Price has respected multiple demand zones on the way up and currently sits just above the key support at 19,107.0. The bullish momentum is supported by a clean structure of higher highs and higher lows, and a breakout from the flag could trigger the next leg up toward the 138% Fibonacci extension level at 19,454.8.
As long as price holds above the 19,000–19,107 support zone, this scenario remains valid. Keep an eye on volume and a breakout candle for confirmation. 📊💥
Watch this meltFirst time publishing i might be wrong but we'll see :) my thoughts here on a hard short

Gold Vs. Nasdaq, since 2017 Using momentum indicators, the Nasdaq is overbought and seems to be retreating a bit off of that region. Gold is continuing to move into the overbought region of momentum.
The two are following more of a correlation up until now. This current movement marks divergence, which is what is expected. This coincides with the expectation that Gold and equities will trend in opposite directions.
In other research, it is noted that when there is correlation followed by divergence, it is typically the equity which was over-extended and will retrace back against Gold's more gradual movement. Gold typically keeps pace with inflation.

NAS100 Trendline Break: Short-Term Rally or Another Trump Shock?NASDAQ breaks above its trendline, hinting at a possible short-term rally toward previous consolidation levels — but political volatility could still slam the brakes without warning.

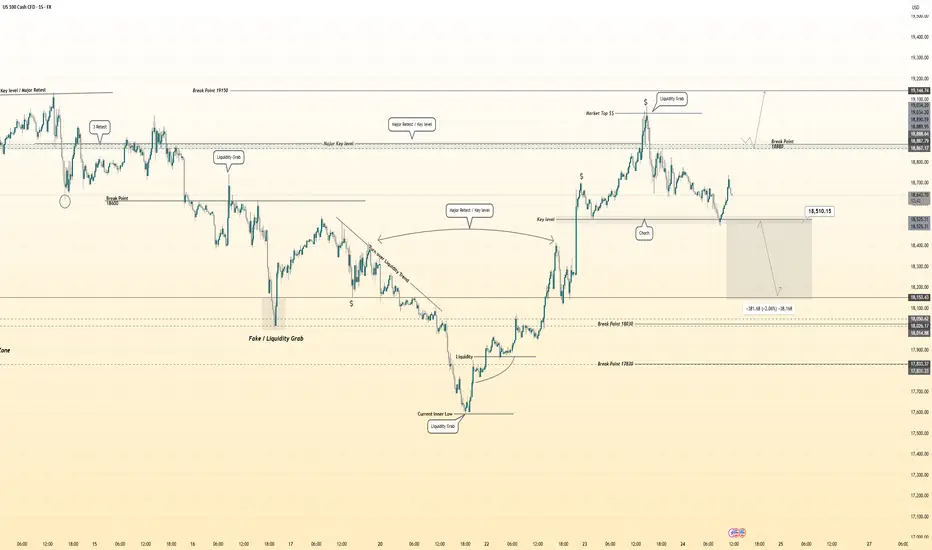
Hanzo | Nas100 15 min Breaks – Will Confirm the Next Move🆚 Nas100 – Hanzo’s Strike Setup
🔥 Timeframe: 15-Minute (15M)
——————
💯 Main Focus: Bullish Breakout at 18880
We are watching this zone closely.
💯 Main Focus: Bearish Breakout at 18510
We are watching this zone closely.
📌 If price breaks with high volume, it confirms Smart Money is in control, and a strong move may follow.
———
Analysis
👌 Market Signs (15M TF):
• Liquidity Grab + CHoCH at 19050
• Liquidity Grab + CHoCH at 18500
• Strong Rejections seen at:
➗ 18500 – Major support / Key level
➗ 18900 – Proven resistance
🩸 Key Zones to Watch:
• 18500 – 🔥 Bullish breakout level X 4 Swing Retest
• 18900 – Strong resistance (tested 6 times)
• 18500 – Equal lows
• 19050 – Equal highs
Hanzo | Nas100 15 min Breaks – Will Confirm the Next Move
Are You Ready For Nasdaq Next Flight ? 500 Pips Waiting For Us !Here is my opinion on Nasdaq , i think we have a very good closure and we can say we will go up for sometime in the next few days , so i`m waiting the price to go back to my support area ( Lower One ) that already broken , and then we can enter a buy trade and targeting 500 pips . also if the price touch the higher place and give me a good bullish price action , we can enter a buy trade with small lot size and if the price go to the lower one we can add one more contract .

NAS100 Bulls Rally – Eyes on 19,860 Resistance Zone!"The NAS100 is sustaining a strong bullish rally after reclaiming the 19,150 🔽 support zone. Price is trading firmly within a bullish structure, but still has some distance to reach the next key resistance at 19,860 🔼.
Currently trading at 19,446, with
Support at: 19,150 🔽, 18,500 🔽, 17,600 🔽
Resistance at: 19,860 🔼, 20,347 🔼
Bias:
🔼 Bullish: As long as price holds above 19,150, bulls remain in control. A breakout and retest above 19,860 could fuel a further move toward 20,347.
🔽 Bearish: A rejection from 19,860 or a break below 19,150 could trigger a decline toward 18,500.
No breakout, no trade.
📛 Disclaimer: This is not financial advice. Trade at your own risk.

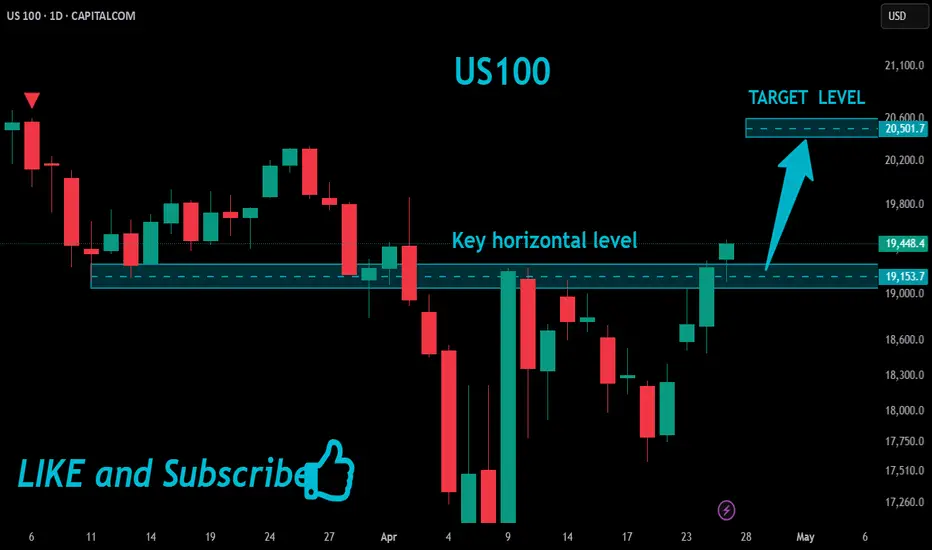
US100 Bullish Breakout!
HI,Traders !
US100 is trading in an
Uptrend and the pair made
A bullish breakout of the
Key horizontal level of 19153.7
And the breakout is confirmed
So we will be expecting a
Further bullish move up !
Comment and subscribe to help us grow !
NDX - SHORT POSITIONGood Morning,
I have entered an SQQQ trade to short the NDX. Overall NDX has been in a mid-term bullish trend and continues to do so.
When the NDX shows signs of short, I typically sell my stocks that trend with it and enter an SQQQ.
ENJOY!

How important is the time frame when you investWe’ve been discussing the possibility of a recession in the US for some time now, along with tariffs and the impact of Trump’s policies. This has led to declines of up to 25% in the US NASDAQ index, sparking panic among many investors. When investing for the long term, it’s important to be aware of where we are within the same time frame as our investment horizon—a 25% drop in the short term doesn’t necessarily have to be a concern for long-term investors.
In this case, we can see that the NASDAQ has established a massive uptrend over the years. As long as the main trend levels remain intact, we can’t even say the market is moving sideways. The market has provided one of the best opportunities to enter the NASDAQ, bouncing right off previous highs and demonstrating the strength of the trend.
By buying in the previous highs or near the long term trendline, means a very low risk with returns up to 30%.

Potential bullish rise?USTEC has reacted off the pivot and could rise to the overlap resistance.
Pivot: 18,950.55
1st Support: 18,467.08
1st Resistance: 20,258.77
1st Resistance: 34.50
Risk Warning:
Trading Forex and CFDs carries a high level of risk to your capital and you should only trade with money you can afford to lose. Trading Forex and CFDs may not be suitable for all investors, so please ensure that you fully understand the risks involved and seek independent advice if necessary.
Disclaimer:
The above opinions given constitute general market commentary, and do not constitute the opinion or advice of IC Markets or any form of personal or investment advice.
Any opinions, news, research, analyses, prices, other information, or links to third-party sites contained on this website are provided on an "as-is" basis, are intended only to be informative, is not an advice nor a recommendation, nor research, or a record of our trading prices, or an offer of, or solicitation for a transaction in any financial instrument and thus should not be treated as such. The information provided does not involve any specific investment objectives, financial situation and needs of any specific person who may receive it. Please be aware, that past performance is not a reliable indicator of future performance and/or results. Past Performance or Forward-looking scenarios based upon the reasonable beliefs of the third-party provider are not a guarantee of future performance. Actual results may differ materially from those anticipated in forward-looking or past performance statements. IC Markets makes no representation or warranty and assumes no liability as to the accuracy or completeness of the information provided, nor any loss arising from any investment based on a recommendation, forecast or any information supplied by any third-party.

NASDAQ Potential DownsidesHey Traders, in today's trading session we are monitoring NAS100 for a selling opportunity around 19,400 zone, NASDAQ is trading in a downtrend and currently is in a correction phase in which it is approaching the trend at 19400 support and resistance area.
Trade safe, Joe.

EMA 60 capped the NASDAQ rallyThe NASDAQ’s rally was capped by the 60-day EMA, as ongoing tariff wars and the Federal Reserve’s reluctance to cut rates-or its intention to keep rates elevated for as long as possible-continue to weigh on investor sentiment. Given these headwinds, there is a risk that the NASDAQ may continue to slump.

US NAS100Preferably suitable for scalping and accurate as long as you watch carefully the price action with the drawn areas.
With your likes and comments, you give me enough energy to provide the best analysis on an ongoing basis.
And if you needed any analysis that was not on the page, you can ask me with a comment or a personal message.
Enjoy Trading ;)


QQQ FORECAST Q2 FY25: 13% RECOVERY APRIL FOOLSlike comment follow all the signals here are lit
comment your instrument below ill analyse it bonds crypto etf reits all dat paperwork
The recovery was swift exactly at our $16811 price level (great bargain) if you watched last call
now im calling bluff on this 90 day hype stop loss above entry targets set
there might be a bullish continuation by the mid point narrated by the path line
$17709 if confluence presents itself and necessary events present themselves im hopping out and longing these tariff games can go anyway in a heartbeat
