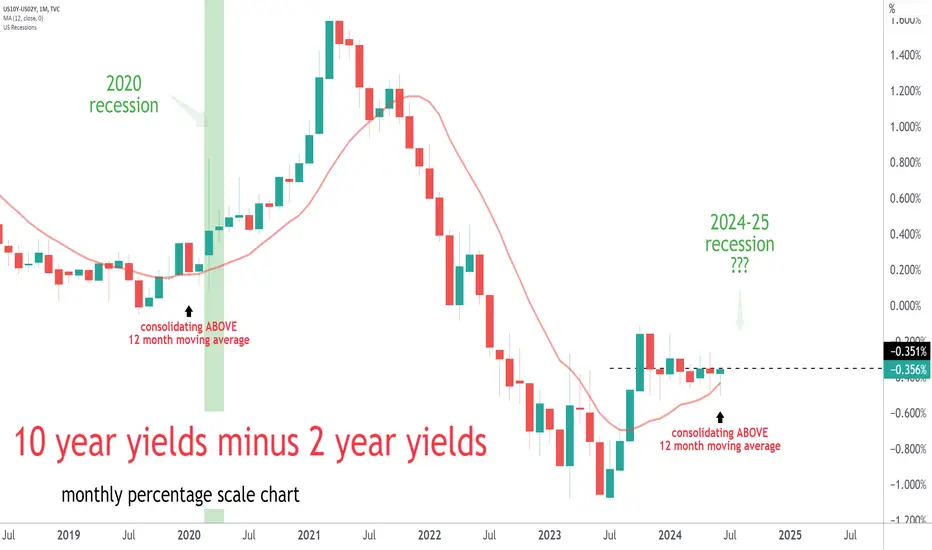
Wen Next Recession?Noise reduced monthly vantage point for the 10 year minus 2 year yields.
consolidating ABOVE
12 month moving average
Tic toc...
#recession #rates #inflation #yields #fomc #fed
US10Y trade ideas
10yr Treasury Yields Consolidate at Key 4.32% LevelThe world’s most important market, the 10yr US Treasury, is trading directly at a critical level. Going back years, the 4.32% level has served as reliable support/resistance, and today’s drop after peeking above that level yesterday has only emphasized the importance of that key level.
At the same time, the 10yr Treasury yield has put in a series of lower highs and higher lows dating back to Q4 of last year, creating a symmetrical triangle pattern that could lead to an outbreak of volatility in the coming weeks. A bullish breakout above 4.60% would hint at a possible retest of 5.00% (and likely weigh on risk assets like stocks and higher-yielding currencies), whereas a bearish breakdown in yields would open the door for a drop toward the December lows near 3.80%.
-MW

Yields are in a do or die situationYields are pulling back a bit from the run they had yesterday. It was expected to have a bounce at the support levels.
The 2Yr & 10Yr #Yield both look as if they want to settle a bit but time till tell . We will see how Yield reacts over the next few days. It is important as a crashing yield can mean higher prices all across the board in many assets.
We've stated before that they CANNOT lower rates but at the same time CANNOT raise them. Seems as if they are playing around a bit providing liquidity to keep markets propped up a bit AND they may keep rates steady or just have 1 rate drop, before election.
TVC:TNX

10 year minus 2 year yieldsWinter is coming...
10 year minus 2 year yields
weekly percentage scale chart
#recession

S&P500 & Nasdaq inverse correlated to 2/10yr curveThis is US10Y-US02Y (inverted) in blue, S&P500 in orange & Nasdaq in light blue.
The 2's/10's spread has steepened meaningfully 3 times this year & each time has coincided with a sell off in the S&P500 & Nasdaq. It's just steepened again & the S&P500 is holding it's 4hr 50ema for now having made a lower high. Let's see what happens.

US10Y 2024 FULL YEAR FORECASTI will start forecasting full years in advance
and provide updates from there finally understand how the bond markets works
dont be fooled folk 2024 nasdaq is crashing market is overbought the recovery was too quick
easy come easy go and only the informed are preparing their shorts
if u appreciate my work
like, tip, comment, follow

US10Y - Targeting Buystops This WeekBullish bias going into next week with high probability setup forming if we are to witness a short-term sweep of sellside @ 4.190% before a retracement

US 10Y TREASURY: PCE weekUS Treasury yields had a relatively calmer week. Higher volatility was exhausted after the FOMC meeting, two weeks ago. The economic data are weighted and in expectation of the new ones the 10Y US benchmark was moving within a relatively short range, between levels of 4.20% and 4.29%. However, the major concern of market participants continues to be when the Fed will cut interest rates?
Recent economic data are showing some potential that the US economy is beginning to slow down. This might be one of the triggering events for the Fed to cut interest rates, despite relatively elevated inflation figures. The week ahead is bringing PCE data for May, which is Fed`s favorite inflation gauge. In case of any surprises, the volatility might be easily back on markets. As per current charts, there is some potential for 10Y yields to test a bit higher ground, above 4.30%, while continuing to test the 4.20% level.

3M US10YThe 10yr treasury yield is headed to 8-10% in the early 2030’s, as the commodity super-cycle ensues. Expect a pull-back in yields to re-test trend-line, then it’s off to the races.

US10Y - 4.335% Equilibrium In The Works We are witnessing a relief rally from the massive capitulation last week.
A lil upside movement won't harm a fly right??

US 10Y TREASURY: maybe September?Markets have survived another FOMC meeting, and volatility induced by their narrative. From initially planned three rate cuts during the course of this year, we have learned from Fed Chair Powell, that there will probably be only one rate cut this year. The markets have switched their attention on when this first pivoting might occur, with current estimates that it might be in September. Whether this will be the case it is unclear, considering that the Fed missed their own estimates, let alone estimates from the market.
The 10Y Treasury yields started the previous week around the level of 4.47% and during the week, Treasuries were traded higher in prices and lower in yields. The lowest yield reached was at 4.19%, still, the market closed Friday`s trading session at 4.22%.
The level of 4.20% should be tested in the coming period. In this sense, it should not be expected to have lower yields from the current ones. Some short volatility toward the upside is possible but not the significant one. At this point on charts, the level of 4.3% might be a target of 10Y yields, but only shortly.

US10Y - Roadmap next 2 yearsYields are currently in EW 4th wave correction, this should bottom by the end of 2Q for a sharp rally back to new highs end of year. 2025 will be the year of bear with a crash in all risk assets. Likely bottom near the golden fib @~2.5%.
Risk assets also should follow this path along hand in hand. So bullish stocks until EOY after a brief correction in 2Q.

Bearish on DXYThis week we have CPI and US Fed funds rate announcements. Most probably we don't get a rate cut for now (as the market expects). However, I think this week the announcements are coming out with a more dovish tone.
Let's see what happens . . .
If the CPI number come out lower or equal to the expectations and the Fed Chair Powell signals 1 or 2 rate cuts for this year. I believe we can expect the yellow scenario. Otherwise, we can expect the red scenario happens in short term.

US10Y-US02Y yield curve may disinvert in 2Q 2024Not many folks are looking for this as everyone seems to be calling for bonds to rally but I think there is a pretty good chance we get a flat 2's-10's sometime during Q2
Historically not a great omen for stonks when the curve disinverts

US10Y - 4.457% In Danger This Week...Expectations has been shifted and now the bulls has taken charge!
Expecting 4.457% to be met this week!

US 10Y TREASURY: FOMC induced volatilityThe 10Y US Treasuries reacted to jobs figures data posted on Friday. The data were somewhat mixed. On one side, unemployment for May showed an increase to 4.0% from 3.9% posted for the previous month. On the other hand, the non-farm payrolls with 272K jobs added, significantly surpassed market expectations of 190K. The market is expecting for the jobs market to slow down as it will be the first sign for the Fed to pivot, as inflation is holding sticky above 3%. However, May data were sort of mixed. The Fed is meeting on Wednesday, and the majority of market participants are of the opinion that the Fed will keep interest rates unchanged at this meeting. Based on the CME Group's FedWatch Tool there is currently a 68% chance that the Fed will pivot in September this year., based on traders’ expectations.
A mixed mood has been evident during the previous week. The 10Y US benchmark was moving toward the downside during the week, reaching its lowest weekly level at 4.27%. Still, Friday’s trading session brought a change in sentiment, where the market returned yields toward 4.43%, due to posted jobs data. As FOMC will decide on interest rates on Wednesday and will communicate its macro projections with the wider community of investors and traders, it implies that the increased volatility might be ahead for another week. Still, the markets should eventually calm after they price all available information.

Crucial 10-year note auction this week. The Fed’s rate decision and FOMC statement will thus take center stage this week but the latest US CPI figures for the month of May will also be released along with the US 10-year and 30-year bond auctions.
The 200-day MA of 4.35% has held support and another Fed pause will allow yields to rise and re-test levels above 4.50%

Extensive Analysis of the US Government Bonds 10YR Yield Chart (Overview
The chart for US Government Bonds 10YR Yield on the 4-hour timeframe shows significant movement with the price rebounding from a recent low. The indicators used include Moving Averages, Bollinger Bands, Commodity Channel Index (CCI), MACD, and Support and Resistance levels.
Key Observations
1. Moving Averages (200 MA and 50 MA):
• 200 MA (Green Line): The price is currently below the 200 MA, indicating a bearish long-term trend.
• 50 MA (Blue Line): The price is also below the 50 MA, reinforcing the short-term bearish sentiment.
2. Bollinger Bands:
• The price is at the middle Bollinger Band, indicating that the market may be at an equilibrium point. The previous move was from the lower band, suggesting the market might be moving back towards the upper band.
3. Commodity Channel Index (CCI):
• The CCI is likely around 0 or slightly positive, indicating neutral to mildly overbought conditions. This suggests a potential for a continuation of the current trend or a mild pullback.
4. MACD (Moving Average Convergence Divergence):
• The MACD line is above the signal line, and the histogram is showing increasing positive values, indicating bullish momentum.
5. Support and Resistance Levels:
• Resistance Zones: Strong resistance is seen around 4.550% and the strong high zone above.
• Support Zones: The recent low at 4.250% is marked as a weak low, with further support below.
Comprehensive Technical Analysis
1. Current Trend:
• The long-term trend is bearish, as confirmed by the price being below the 200 MA. However, there is a short-term bullish sentiment as indicated by the price moving upwards and crossing the 50 MA.
2. Equilibrium Conditions:
• The price is near the middle Bollinger Band, indicating a balance point. A move above this band could suggest a continuation towards the upper band, while a rejection could mean a return to the lower band.
3. Volume:
• Increased volume during the recent upward move indicates strong buying interest, which may continue to push the price upwards.
4. Key Support and Resistance Levels:
• Resistance: Significant resistance levels start from 4.550% to 4.700%.
• Support: The recent low at 4.250% and significant support around this level.
5. Momentum Analysis:
• The MACD indicates bullish momentum, suggesting the possibility of further upward movement in the short term.
Best Trade Opportunity
Given the current market conditions, the best trade opportunity appears to be a short-term buy trade to take advantage of the recent bullish momentum and potential for continuation towards higher resistance levels.
Trade Setup:
• Buy Level: Around 4.435% (current level near the middle Bollinger Band)
• Stop Loss: Below 4.300% (to account for potential pullbacks)
• Take Profit:
• First target: 4.550% (near the first resistance level)
• Second target: 4.650% (middle resistance level)
• Extended target: 4.700% (upper resistance level)
Trade Rationale:
• Bullish Indicators: The MACD and the recent upward movement suggest bullish momentum.
• Volume Consideration: Increased volume during the recent move up indicates strong buying interest, supporting further upward movement.
• Risk-Reward Ratio: Entering a buy position near 4.435% offers a favorable risk-reward ratio, especially with a stop loss below the recent low.
Summary
• Buy Opportunity: Enter at 4.435% with a stop loss below 4.300%.
• Targets: 4.550% (first target), 4.650% (second target), and 4.700% (extended target).
• Rationale: The market is currently showing bullish momentum, and the potential for continuation towards higher resistance levels is high given the MACD and volume indicators.

1O year US T Bond Yield:A hot jobs report Friday sent shivers through the bond market, prompted yet another repricing of rate-cut expectations and may have ruined Federal Reserve Chair Jerome Powell’s weekend.
Treasurys sold off, sending yields (which move opposite to price) jumping Friday. The yield on the 2-year Treasury note BX:TMUBMUSD02Y, the most sensitive to policy expectations, jumped 15 basis points to end at 4.87%, while the 10-year Treasury note BX:TMUBMUSD10Y rose 14.8 basis points to 4.428%.
For the purist TEchnical Analyst, teh writing was on the wall. And till 4.66% rise, they woudl still be relaxing in their Lazy Boy Chair.

Interest Rates bounce at support level!And there they go!
The 2Yr bounced right at the support level, AGAIN
It is forming lower highs though.
10Yr #yield looks a bit weaker that its counterpart. TVC:TNX
In reference to the #interestrate post after the one quoted...
The weekly up trend is NO LONGER BROKEN!
TVC:VIX not moving much, interesting.

Analysing US 10-Year Yield Trends Ahead of Non-Farm Payroll DataI know we have non-farm payrolls tomorrow, but in my view, the US 10-year yield is telling a powerful story on the charts.
On the daily chart, the yield has broken into 2-month lows and fallen back below the 4.35% February peak, indicating potential near-term weakness.
The weekly chart shows a recent clear failure at the previous uptrend, suggesting that 4.74% was an interim peak. This implies we are likely to see short-term weakness.
Unless the market breaks above the recent high of 4.74%, I maintain my near- to short-term view that US 10-year yields are likely to slip back to their 20-month moving average at 4.05%.
Disclaimer:
The information posted on Trading View is for informative purposes and is not intended to constitute advice in any form, including but not limited to investment, accounting, tax, legal or regulatory advice. The information therefore has no regard to the specific investment objectives, financial situation or particular needs of any specific recipient. Opinions expressed are our current opinions as of the date appearing on Trading View only. All illustrations, forecasts or hypothetical data are for illustrative purposes only. The Society of Technical Analysts Ltd does not make representation that the information provided is appropriate for use in all jurisdictions or by all Investors or other potential Investors. Parties are therefore responsible for compliance with applicable local laws and regulations. The Society of Technical Analysts will not be held liable for any loss or damage resulting directly or indirectly from the use of any information on this site.

US Yields End-Of-Month ReviewMay's price action hammered into the macro EQ @ 4.404% before closing 60%* inside of the previous monthly candlebody.
4.739% 1st buystop liquidity
4.313% 1st sellstop liquidity

US10 & US02 YIELD CURVE vs USDJPY / BTCUSDHighlighting the risk on/off to the yield curve vs USDJPY & BTCUSD.
