US 10YR yields approaching symmetrical triangle formationKey Pivot to reach Apex which would result in Breakout is around US Election period.(Nov start)
1) Election Outcome favourable and CPI under control (fed cuts) - Yields drop further
2) Election outcome not favourable & CPI under Control - Yields to move up in medium term (above 4.467% level) & throwback to apex.
3) Election outcome favorable & CPI increases - Yields to move down in medium term below 4.467% & pullback to apex level.
US10Y trade ideas

regain sthchecked and hit trough a resistens, cant hold it, now cheking back a lower support, my idea with a little pozitive strenght. and a next month will be an upward movment to the nearest local high, what is the target area

Flip FlopAll ideas are strictly my interpretation of price action. I am not a professional trader nor is this
professional advice.
I will continually update all trades.
Daily Chart: ZB(30y Bonds) v US10y (10Y Yields)Please read descriptions in chart on analysis.
overall, not much news this week, just FED speak and NVDA earnings plus Memorial day next week so we can have a choppy week awaiting next week's data

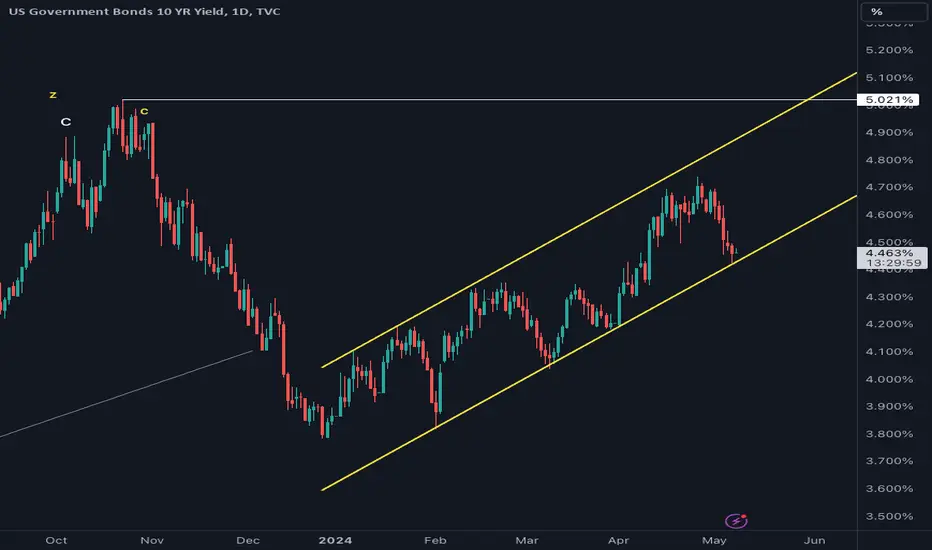
US10Y held the 1D MA200 and is starting a new rallyThe U.S. Government Bonds 10 YR Yield (US10Y) is expanding the new Bullish Leg, and continues to follow the buy signal we gave on January 24 (see chart below):
Last week it tested the 1D MA200 (orange trend-line) as a Support, for the first time since April 01 and held. As a result, we expect it to resume the Bullish Leg, the same way it did on July 19 2023 and test initially the previous Higher High of the 2-year Channel Up.
Our Target is slightly below at 5.000%.
-------------------------------------------------------------------------------
** Please LIKE 👍, FOLLOW ✅, SHARE 🙌 and COMMENT ✍ if you enjoy this idea! Also share your ideas and charts in the comments section below! This is best way to keep it relevant, support us, keep the content here free and allow the idea to reach as many people as possible. **
-------------------------------------------------------------------------------
💸💸💸💸💸💸
👇 👇 👇 👇 👇 👇

US 10Y TREASURY: smooth optimismInvestors are still weightening the latest inflation data posted during the previous week. Posted inflation figures were in line with the market estimate. Inflation rate reached 3.4% on a yearly basis, while core inflation eased to 3.6% in April. By putting it into a perspective of jobs data and consumer sentiment, inventors are perceiving that the first rate cut might occur in September this year, with currently 54% odds. This sentiment pushed the equity markets in the US, however, US Treasuries were traded in a mixed manner. Namely, the 10Y benchmark yields started the previous week around 4.5% level, and during the week were pushed to the lowest weekly level at 4.32%. Still, yields are ending the week at 4.42%.
The level of 4.2% is currently tested. Market will start the week ahead trying to break the 4.2% line to the upside. Some volatility might be expected in the coming period, and data are still not completely clear in which direction the inflation in the US is heading. In this sense, there is some probability for the 4.5% level to be tested for one more time, but there is no indication that this level might be breached. On the opposite side, the easing of yields might go down to the level of 4.3% for one more time.

US 10 Year Bonds - Weekly Outlook - 20 May 2024 - Image
Daily chart of US 10 Year Bond
As per image, we have had two drives up, and are finding support here, so i would think there is at least one more drive up.
I'll be looking to get long as per my diagram shown, with SL and TP as shown.

US10Y - US02Y = Crash ZoneCrash Zone highlighted in Red. Fair warning is given as well; "Sell Sell Sell"

Bond Market Hints Towards a Second Wave of Shorts to hit the JPYLate last year the Spread of the US/JP Carry Trade hit the PCZ of a Bearish Shark resulting in it pulling back to the 50% Retrace, this came ahead of Bearish Action in the stock market and strength in the JPY. However, the bounce at the 50% retrace indicates that it could turn into a Bullish 5-0 which would result in higher highs. In addition to that, the leverage ratio on the trade has been forming what looks to be a nice looking Cup with Handle pattern, which if it plays out would bring the leverage ratios up from 500% to well over 800%. This would likely align with higher highs in the SPX, Higher Inflation Rates, Higher Commodity, Import/Export Costs, and a continuation of the falling Japanese Yen.
I will leave the chart of last year's Carry Spread Chart Post below for reference.

US10Y - US Ten Year Yields WeeklySome weekly consolidation; Possible yields haven't topped yet. These inflection points lead to weekly and monthly trend changes which I will be looking for a potential spike as momentum shifts back down and rates test the keltner channel mid or upper line. There is also a possibility that rates breakout of the resistance (trend change) of this bullish leg from 2020. The Red line on the keltner channel oscillator at the bottom.
I expect more black swan events to occur as chaos ramps up in the next year.

Rates are breaking recent up trends, $TNXGood Morning Everyone!
The 2Yr Yield is retesting the recent support level, highlighted by arrows.
The 10Yr #yield is currently breaking the recent uptrend.
The yellow box was highlighted in the last post showing the WEAKNESS. However, forgot to speak on that yesterday (see profile for more info).
They cannot lower #interestrates... But they must, at least short term.
QT is done.

US 10Y TREASURY: watch for CPIMoves in Treasury yields during the previous week are showing that the market has already priced all known information, and waiting for new ones in order to decide on a further action to the up or downside. The 10Y Treasury benchmark was moving between levels of 4.51% down to 4.42% on one occasion. The majority of deals were around the 4.5% level. It should be mentioned that a 30-year bonds auction was held the previous week, where strong demand for these bonds was evident. This demand was led by latest US unemployment data and investors expectations of rate cuts during the course of this year. In this sense, a demand for other maturities, including 10Y was left out of the focus.
In a week ahead a fresh US consumer price index data will be released, which might bring back some volatility on the Treasury yields. If the CPI is higher from market expectations, then yields might be pushed to the upper side, at least 4.55%, with low probability for 4.6%. However, if the CPI data show some relaxation, then the Treasury yields will continue their current path to the downside, and the level of 4.4%.

US10Y - Take Note Of 4.549%Lows of 4.420% was printed this trading week with minimal draws to buyside liquidity as yields had been trading within the weekly fair value gap.
Intraday-week market structure shift occurred during Thursdays US AM session before a minor retracement below consequent encroachment @ 4.458 ensued.
This leaves buyside ripe for the takings and I’ve got my eyes on 4.549%.

What would happen if the US 10-year Treasury yield rose to 20%? What would happen if the US 10-year Treasury yield rose to 20%? The clear five-wave pattern in bond yields is causing concern.

Huge potential implications from YIELD SPREADS (US10y-DE10y)Folks know how I feel about very long term (multi year/decade+) outlook for inflation and yields - they are going higher.
And I have called for higher yields (and spreads) and thus dollar so far this year.
BUT BUT BUT
The yield spread chart is suggesting a potential divergent high which could have MAJOR implications across asset markets. Is it fortelling a turn in the sequence of stronger US data? If so then in coming weeks/months we could see:
Weaker data
Lower yields (esp in the front end)
Curve "disinversion"
Weaker DXY
Higher risk assets = stonks, commods (gold silver, Uranium, oil etc), Bitcoin

US 10Y yield key support under pressureWe suspect that the US 10Y yield chart has topped short term having tested and again failed at its previous uptrend at 4.74 (which is now acting as resistance) . Please see the weekly chart.
This throws the spotlight on key nearby support where we find a short term uptrend, last week's low, the 55-day ma and the 200-day ma together with a previous high all converging 4.44-4.33 (see daily chart) . While this could well hold the initial test, it is now under the spotlight, and should it give way we would allow a return visit to the 20-month ma at 4.03.
Disclaimer:
The information posted on Trading View is for informative purposes and is not intended to constitute advice in any form, including but not limited to investment, accounting, tax, legal or regulatory advice. The information therefore has no regard to the specific investment objectives, financial situation or particular needs of any specific recipient. Opinions expressed are our current opinions as of the date appearing on Trading View only. All illustrations, forecasts or hypothetical data are for illustrative purposes only. The Society of Technical Analysts Ltd does not make representation that the information provided is appropriate for use in all jurisdictions or by all Investors or other potential Investors. Parties are therefore responsible for compliance with applicable local laws and regulations. The Society of Technical Analysts will not be held liable for any loss or damage resulting directly or indirectly from the use of any information on this site.

US10 yield is "far" from long term "peak". 9/May/24US10Y > 8% what happen for those house/ car mortgage? What happen to #gold when big player have "guaranteed" in bank deposits? What happen to "healthy" bank's "stock"?..

stagflation pattern or parallel channelrate is moving up in yellow parallel channel
lower yellow line is working as perfect trend line
in recent may fomc fed has said he neither see stag or flation
if there are no hike in future then lower trend line must break
if second wave of rate hike is coming then trend line must hold and it can go up 5%
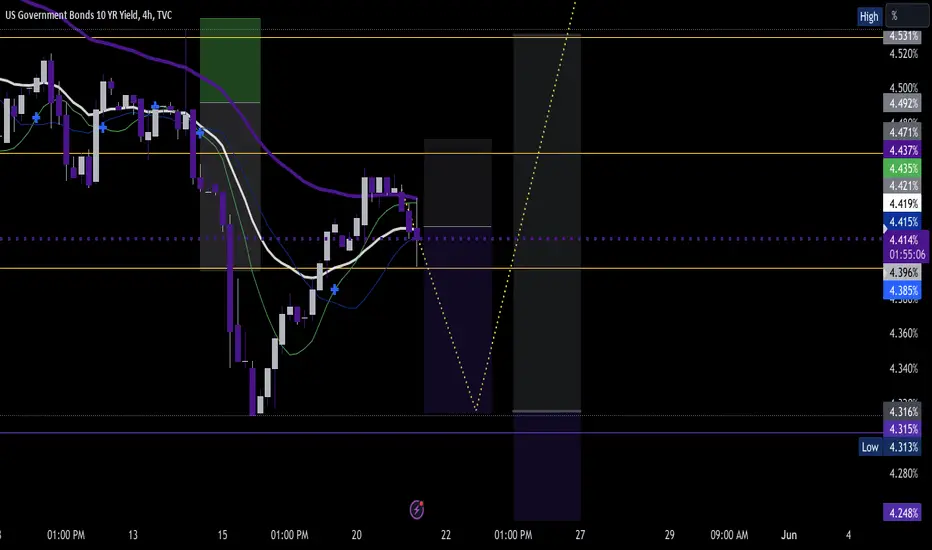
US10Y - Bullish Sentiment ShiftWith predominantly bearish price action during the week, intraday sentiment is more shifted towards a continuation to the downside at this current time.
Due to higher time frame narrative, I am looking out for a retracement to 4.563% hourly fair value gap.
Candle body closure below 4.455% will negate the idea.

US10Y - Sloppy Bearish BiasThe weekly range spans from 4.570% - 4.739% and with the weekly EQ being tagged alongside buyside getting swiped, I am scoping out for the daily order block which is near the weekly sellside @ 4.593% and the second target being the lows at 4.570%.
Some form of a pullback into the lower displacement weekly fair value gap is a projection for throughout the trading week is logical to expect, especially during volatile days where there is a lot of news releases.
Also to note, the Sep - Oct 2023 weekly liquidity void is also a area of importance, especially the consequent encroachment which already aligned with the daily order block so during the week I will update this post if bias has changed.

US 10Y TREASURY: space for further relaxation?During the previous period the market was trying to price its expectations of a less than three rate cuts during the course of this year, giving up on the Fed's announcement from the latest FOMC meeting. The meeting held on May 1st, showed that the market was right in its assumptions, considering that the emerging US inflation might put halt on rate cuts this year.
This was also confirmed by the Fed Chair Powell in an after the meeting speech, considering that the Fed will stay devoted to the 2.0% inflation target. Treasury yields reacted during his speech, however, the major impact on 10Y Treasury yields had an April jobs report. The weaker than expected nonfarm payrolls, as well as, increased unemployment to 3.9% in April from 3.8% posted for the previous month, were main triggers for 10Y Treasury yields to reach the lowest weekly level at 4.45%. Still, they are ending the week at 4.51%.
The market will slowly digest the new information during the week ahead. Still, some further relaxation in the 10Y Treasury yields might be expected. However, they first need to test the 4.5% level before they start their move toward the 4.4%.

Powell pullback as Fed will slow QT.The critical support level to watch here is the 50-day MA at 4.38%, as a failed break below this yield will allow yields to spike to 5% off the back of a continued sell-off in US long-term paper despite the Feds efforts to aid the US bond market. Keep an eye on the tail in this week’s US 10-year note auction!
The markets were hit by a dovish FOMC statement last week. US bond yields and the dollar tumbled off the back of the increased bets for rate cuts in 2024. The Federal Reserve (Fed) kept the federal funds rate unchanged at 5.50% but the real dovish sentiment started flying when the Fed announced that they will slow their balance sheet taper to $25 billion, down from $60 billion, per month. That is a whopping $35 billion that will technically be injected into the market. The dovish FOMC meeting was followed by a weaker than expected ISM manufacturing PMI print along with a feeble non-farm payrolls print of 175 thousand in April, down from 315 thousand in March. These data prints along with the recent weak US GDP results is increasing the odds for a Fed rate cut sooner rather than later as the Fed may be forced to stimulate the economy before they reach their lauded 2% inflation target. On top of all this, last week US regulators announced the first US bank failure of the year with Philadelphia-based Republic First Bank being forced to close its doors.
The week ahead will allow markets to digest the Fed’s more dovish stance as there are no major data prints on the calendar. The US 10-year and 30-year bond auctions will be the main attraction for the week ahead and we will be able to gauge whether investor appetite for long-term US debt has improved following the latest monetary developments. The recent demand for long-term US paper has been fragile with long tails forcing dealers to pick up the slack in the US bond market

The future of Interest RatesRough map pf rate expectation without pretension of accuracy for dates nor timing...
