Business Cycle Rotation Part 4In the first three installments we described an exercise utilizing the long term momentum in asset classes, the relationship between those classes and the Organization for Economic Co-operation and Development (OECD) Composite Leading Indicator (CLI) for the United States, in order to anticipate the business cycle and markets. Those posts are linked below.
Since October when this series was mostly written, several markets have made promising changes in their momentum states and chart patterns. But, this is a teaching exercise so we will mostly work with the data available at the end of September 2023 and mostly (aside from rates) ignore the dramatic changes of last few weeks.
We begin by assessing the change between November 2022 and October 2023. Ideally we should measure at the same point each year. When I was actively managing money this was an exercise I updated in early January so that I could include it in my yearend recap and provide forward guidance to my team. But, given the time perspective involved, slight differences built over a month or two typically make little difference. Interestingly this year may be the exception.
I have included a chart of the two and ten year Treasury yields (inverted). Note the three drives to a low pattern in twos, (a sign of waning supply/growing demand), the break of the downtrend (yet to be confirmed by a monthly close above) and the tentative turn into the bullish quadrant.
I think of rates as the first mover in the cycle. To believe that the business cycle has turned virtuous I would like to see ten year rates make a solid top and begin to reverse at least some of the technical damage created by the break above the multi decade downtrend and the 3.25% pivot that had defined the bull market structure. I would also like to see a more definitive turn higher in twos. In October rates were oversold in terms of momentum and the structure from the 2020 low was completely intact Until I see solid signs of a monthly perspective yield top in the two year and ten year, it will be difficult for me to label this as the kind of high that would lead a change in the economic cycle. Note that the trendline break in the month of December has turned the shorter term 10 year Treasury (inverted) trend from down to neutral.
Commodiites: Commodities have moved from the bull waning to strong decline sector. The weakness in commodities remains consistent with a business cycle that continues to weaken.
Dollar: The Dollar remains in bull waning. It has benefited from global flight to quality, carry and the aggresiveness of our central bank verses other central banks. But, of the asset classes, the Dollars relationship to the business cycle is the least consistent.
Equities: Domestic equities have been mired in the strong decline sector (in part two we discussed at length why equities were still plotted in this sector). In October we were still categorizing equities as lower due to the lack of a rally in most of the equal weight and broader indexes. That remains the case, but barely, with the equal weight moving slightly above the top of its range.
In part 5 we will draw final conclusions and attempt to extrapolate them to 2024.
And finally, many of the topics and techniques discussed in this post are part of the CMT Associations Chartered Market Technician’s curriculum.
Good Trading:
Stewart Taylor, CMT
Chartered Market Technician
Taylor Financial Communications
Shared content and posted charts are intended to be used for informational and educational purposes only. The CMT Association does not offer, and this information shall not be understood or construed as, financial advice or investment recommendations. The information provided is not a substitute for advice from an investment professional. The CMT Association does not accept liability for any financial loss or damage our audience may incur.
US10Y trade ideas

US 10Y TREASURY: pricing rate cutsIt was final time for the Fed to align with the market. At the latest FOMC meeting, this was the case, considering that rhetoric about potential rate increases was not at all in the spotlight of Powell's speech, but clearly slowdown of inflation and that FOMC members are perceiving Fed`s rates at 4.6% as of the end of 2024. This was a clear signal for markets that rate cuts are coming during the course of the next year, with current anticipation that it could be already in March next year.
Although 10Y US Treasury yields started the week around 4.28%, they swiftly reverted toward the downside and lowest weekly level at 3.9%. The market is currently testing the $4.0% level, which might impose some volatility in the week ahead around this level. Still, looking at the larger picture, the yields would certainly further test lower levels, currently eyeing 3.8%.

US Dollar Index vs 10Y-03M Yield curve (LEADING Indicator)The real U.S yield curve (Blue) suggests that the U.S. Dollar (Yellow) may weaken over the next 12 months.
The main beneficially will be Japanese YEN who haven't moved monetary policy for over 42 years. Currency pairs are relative to move so I see the Yen appreciating, followed by the EUR.

Most important chart to check BEFORE any other market!After 4 years of upward movement and reaching the ceiling of 5% yeilds.
Considering the momentum of the current downward trend from the 5% resistance, as long as the wave counting is considered correct and not violated, all financial markets, especially bitcoin, gold, and the US stock market for about the next year (2024) may be ascending
IF the bonds break the 5% resistance, the whole scenario is cancelled
Keep in mind that the amount of money printed and available to large investors to enter the financial markets is much more, and this can have much more extreme movements with it.
But beyond these cases, finding suitable entry points for each market is a completely separate and important issue that must be examined separately.
Neither gold nor Bitcoin are good places to buy now.

US10Y Bond SHORTBased on my analysis the US10Y Bonds has been in a bearish direction. Price broke the bullish uptrend towards this last quarter of 2023. I predict that it can go lower than 4%. I don't see it going back up close to 5% anytime soon. The Feds meeting this week will most likely have it go higher just to finish out the retrace between 4.2% and 4.3%. We are also in the biggest bear market for bonds in history.

Dovish Fed sends rates lowerThe Federal Reserve on Wednesday indicated that its interest-rate hiking cycle has ended and that lower borrowing costs are coming in 2024. This was more dovish than the market anticipated and the US 10Y yield has sold off further.
The short-term downtrend lies at 4.22% and while below here we will assume that the US 10Y yield remains under pressure. We would also highlight the erosion of the 200-day ma, which leaves the market on the defensive.
The market has sold off towards 3.93%, the current location of the 55-week ma and the 23.6% retracement of the entire move up from March 2020. This may provoke some near-term consolidation.
However, the market has also eroded its 2022-2023 uptrend, and this does leave it under pressure. Below 3.90% our attention reverts to the 20-month ma at 3.74%.
Disclaimer:
The information posted on Trading View is for informative purposes and is not intended to constitute advice in any form, including but not limited to investment, accounting, tax, legal or regulatory advice. The information therefore has no regard to the specific investment objectives, financial situation or particular needs of any specific recipient. Opinions expressed are our current opinions as of the date appearing on Trading View only. All illustrations, forecasts or hypothetical data are for illustrative purposes only. The Society of Technical Analysts Ltd does not make representation that the information provided is appropriate for use in all jurisdictions or by all Investors or other potential Investors. Parties are therefore responsible for compliance with applicable local laws and regulations. The Society of Technical Analysts will not be held liable for any loss or damage resulting directly or indirectly from the use of any information on this site.

Jay just turned off the musicSo I think we all understand that the ship has changed course. Fed comments yesterday caused some real margin calls. Lots of folks on the wrong side of that one. Lay either of these charts against the S&P and I think its plain to see we are ready for a pullback soon.

US10Y ~ Bullish Downtrend Reversal (2H)TVC:US10Y chart mapping/analysis.
US10yr bond yields finding bullish reversal off lower range of descending parallel channel (white) - further momentum pending upcoming 10yr auction + US economic data.
Trading scenarios into EOY:
Bullish reaction to macro economic news = continued momentum to break above descending trend-line (white dashed) towards 38.2% resistance zone.
Bullish extension target(s) = re-test upper range of descending parallel channel (white).
Bearish reaction to macro economic news = reversal back below 50% Fib / 4.10% psychological support level / lower range of descending parallel channel (white) / ascending trend-line (green dotted) confluence zone.
Bearish extension target(s) = Golden Pocket zone / 4% psychological support level / 78.6% Fib.

US10Y vs. SPX ~ Inverse Correlation/Ratio Indicator (Dec 2023)TVC:US10Y versus SP:SPX inverse correlation analysis.
Work in progress indicator for anticipating market trend switches.
Notes:
Emerging correlation identified within US10Y/SPX ratio.
Spikes in ratio (orange vertical line, dotted) aka bond yield ROC/volatility = higher probability of risk-off sentiment (ie big tech & growth stock rotation).
Correlation only valid when market is "hyper-sensitive" to bond market fluctuations, especially during recent US Fed undertaking rate hike cycle.
Should be used in conjunction with other confluence factors to provide conviction in swing/position trades.

BRR pattern points to a true Santa rally for bonds. A rare chart pattern second in predictive power to only the famous head and shoulders is the Bump and Run Reversal (BRR) technical pattern.
school.stockcharts.com
If it is so powerful, why is it so unheard of?
1) They are rare. But a recent BRR of very high consequence is the 2022 DXY chart.
2) They usually only occur on high time frames as they measure manias and blow off tops, or in the inverse, manic selling followed by a return to normal.
3) They are hard to chart
4) They give predictive power in terms of time, not in terms of a "measured move" of price, but in the other dimension time.
This chart shows a clear BRR reversal, 55 days in the manic up pattern, the "bump". 55 Days in the return to trend or "run". Which would create a 10 year US Treasury bond rally and likely a rally in risk on assets. Which lands us, perfectly, at yields dropping until Monday December 25th 2023.
Merry Christmas Traders!

Treasury Yields flash bottom signs, early for some + DXY leadingJUST SAYING.......
NOT implying that the party is over BUT heed some signs by treasury.
1Yr #yield is fighting to close above the 10day Mov Avg (RED).
2 Yr has a possible 3rd day trading above the RED Mov Avg.
10Yr fighting to get above the recent trend it broke & Moving Avg's.
US #Dollar has been fighting & looks to be gaining momentum. We'll see how this does over next few days to get barometer.
TVC:DXY TVC:TNX

US 10Y TREASURY: FOMC meeting aheadThe yields on the US Treasuries continued to slow down during the course of the previous week. However, a strong US jobs data posted on Friday, made an impact on 10Y yields to revert a bit toward the higher grounds. Although the US equities were supported by the same news, investors in the Treasury bonds still hold a dose of reserve when it comes to the future economic conditions. Namely, as job data remains strong, there is a fear that the Fed might tighten further in order to sustain their 2% inflation goal.
The 10Y Treasuries started the previous week around 4.29% yield. As the week progressed, yields reached the lowest weekly level at 4.10%. However, at Friday`s trading session, they reverted a bit back, ending the week at 4.23%. Regardless of this small reversal, the markets are still generally oriented toward the downside. The market is still pending testing the 4.0% level, which might occur during the following week or two. At the same time, charts are pointing that some short reversal might lead yields shortly toward the 4.3%, less likely 4.4% level, before they make a final reversal toward the level of 4.0%.

US Debt to GDP vs. 10 Year Treasury Note YieldSimply showing trend changes in long term inflation / interest rates.

Never disregard those weekly & monthly closeSTHOSE LONG TERM TRENDS ARE IMPORTANT.
Remember how the 10 & 30 Yr #yield BROKE daily trends?
Well, they are both still in play, for TVC:TNX it is in better shape.
Let's see how they close.
30 Yr struggling a bit more to recover that close under the trend.
#mortgage rates have also fallen decently.

BondsUS10Y breaking support. Good entry on bond etf's. Only picking up a small amount to get in the door. ZROZ, EDV, and TLT.


US10Y Is this the end of Bond Yields' 3.5 year run?The U.S. Government Bonds 10 YR Yield (US10Y) is pulling-back towards the 1W MA50 (blue trend-line) and bottom of the Rising Wedge. The pattern is getting too tight and the squeeze will inevitably result in a break-out and new trend/ pattern.
If the Rising Wedge breaks downwards, it will mean the end of the yield's +3.5 year bullish run and will have a high impact both on stocks and Gold. In fact there are high probabilities of that happening as a similar Rising Wedge broke to the downside at the end of 2018.
If that gets materialized, then the first attempt should be on the 3.300% Support 1 level, before the 1W MA200 (orange trend-line) gets closer for the test of its long-term Support status.
-------------------------------------------------------------------------------
** Please LIKE 👍, FOLLOW ✅, SHARE 🙌 and COMMENT ✍ if you enjoy this idea! Also share your ideas and charts in the comments section below! This is best way to keep it relevant, support us, keep the content here free and allow the idea to reach as many people as possible. **
-------------------------------------------------------------------------------
💸💸💸💸💸💸
👇 👇 👇 👇 👇 👇

US10 Y forecastIf you believe the all important 10Y yield telegraphs the markets, then pay attention to this chart...I am fairly certain this path will materialize...mid to late 2024 we should see a signifant drop in yields...which should pump markets...and push inflation down. This of course is timed perfectly for the 2024 U.S. presidential elections...coincidence? LOL!

US 10Y TREASURY: Powell and market on opposite sidesFed Chair Powell is speaking, but the market is not listening. Powell was speaking on Friday at Spelman College in Atlanta, noting once again that the current policy might not be restrictive enough, meaning that further rate hikes are possible in case that inflation remains persistent. However, a strong economic output of 5.2% for Q3 and inflation figures which are clearly oriented toward the downside, made the market react quite opposite to Powell`s notes. Almost all assets, including Bitcoin gained during the previous week. Treasury bonds strongly gained during the week, pushing the yields lower.
The 10Y Treasury yields continued with their down trend, starting the week around 4.4% level and ending it at 4.197%. This is more than a clear indication that the market is currently strongly set on rate cuts in the coming period. In case that market perceives that the rate cuts might be higher in 2024, then the 10Y Treasury yields might easily reach the level of 4.0% by the end of this year. Still, for the week ahead, it could be expected that the level of 4.2% is to be tested, with a decreased probability for a reversal toward 4.4% level.

us10YRegarding the ten-year rate, we must say, the first important point that can be seen is in the green box and then the green lines, the resistance formed is also indicated by the red box. We will be in these ranges for a long period.

US10Y Areas to look out forUS10Y has just recently broken a major support with a retest. This would indicate bearish sentiment targetting next S/R zones below with daily MAs.

Big Bearish Bat in Yields Complimenting the TLT forecast:
Bat pattern in the 10 year yields. Norms of this pattern is to be super strong into the end, have massive attention and almost everyone expecting the move to continue.
Bats often both top and break with news.
Over the last days I've been strongly suggesting to real life friends they dump risk assets and buy bonds.
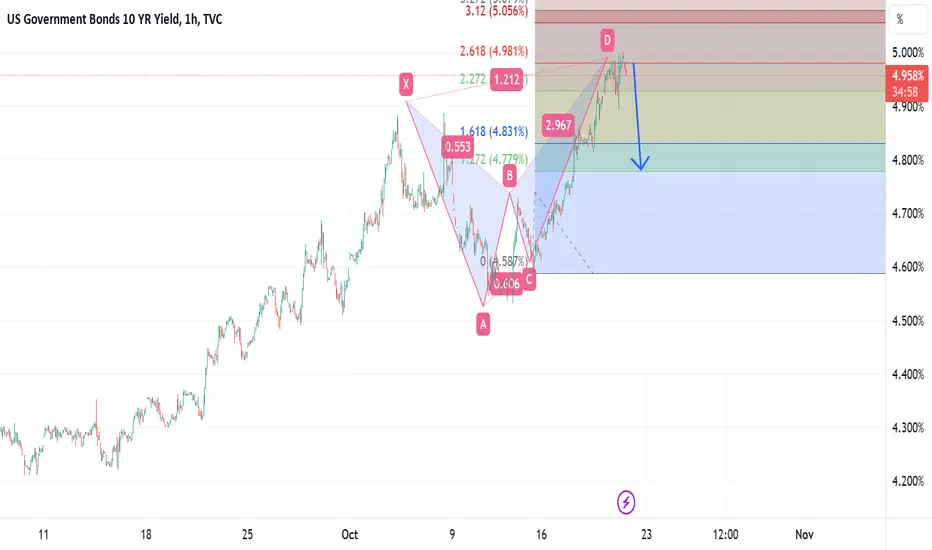
Back to long bias on yields. Correction was nicely signalled by a bat pattern.
We've now reached the 76 support level.
Unless we break the 76 my bias is now towards 6%.
Update to
