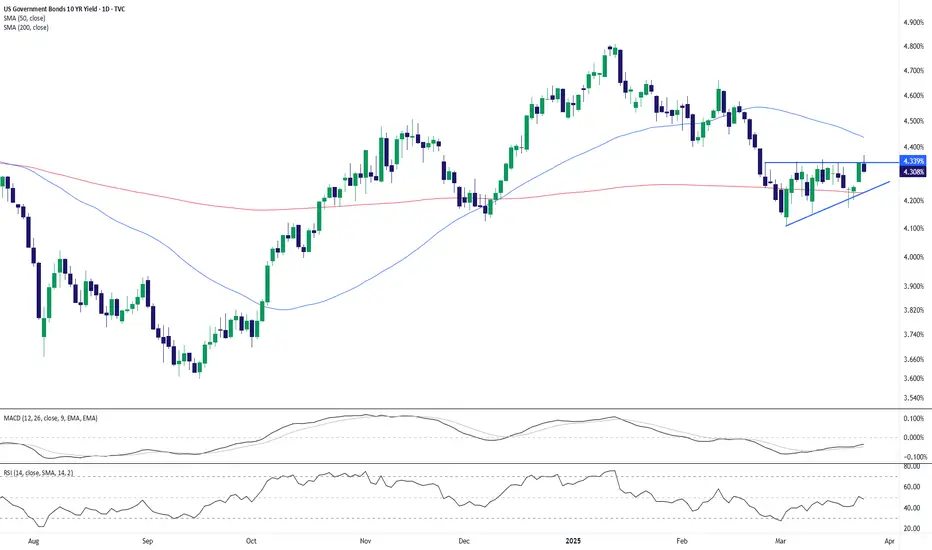
US 10yr Treasury Yields Press Against ResistanceThe U.S. 10-year Treasury yield is hovering just beneath the 4.34% resistance level, with price forming a tight ascending triangle just under this key level. Today’s pullback to 4.31% (-0.74%) suggests hesitation from bulls as momentum indicators turn mixed.
🔹 MACD is flat, showing a lack of directional conviction.
🔹 RSI sits at 47.94, neutral and non-committal.
🔹 Price remains sandwiched between the 50-day SMA (4.43%) and the 200-day SMA (4.22%).
A confirmed breakout above 4.34% could open the door for a run toward 4.50% or even 4.80%. Conversely, a drop below the rising trendline (~4.24%) would expose downside risk toward the 200-day SMA.
Watch for a catalyst (Fed commentary or inflation data) to break the deadlock.
-MW
US10Y trade ideas
US10Y: 10-Year Treasury Yield – Safe Bet or Yield Trap?(1/9)
Good morning, everyone! ☀️ US10Y: 10-Year Treasury Yield – Safe Bet or Yield Trap?
With the 10-year yield at 4.358%, is it time to lock in safety or wait for better rates? Let’s break it down! 🔍
(2/9) – YIELD PERFORMANCE 📊
• Current Yield: 4.358% as of Mar 25, 2025 💰
• Historical Context: Above pandemic lows (~1-2%), below early 2000s (5-6%), per data 📏
• Sector Trend: Inverted yield curve signals caution, per economic reports 🌟
It’s a mixed bag—let’s see what’s cooking! ⚙️
(3/9) – MARKET POSITION 📈
• Safe Haven: U.S. Treasuries are risk-free ⏰
• Income Appeal: 4.358% yield draws income seekers 🎯
• Potential Upside: If rates fall, bond prices rise 🚀
Firm in safety, with growth potential! 🏦
(4/9) – KEY DEVELOPMENTS 🔑
• Inverted Yield Curve: 2-year yield higher, hinting at slowdown, per data 🌍
• Fed Outlook: Expected rate cuts later in 2025, per posts on X 📋
• Market Reaction: Investors balancing income with economic risks 💡
Navigating through uncertainty! 💪
(5/9) – RISKS IN FOCUS ⚡
• Interest Rate Risk: If rates rise, bond prices drop 🔍
• Inflation Risk: Erodes real returns if inflation outpaces yield 📉
• Opportunity Cost: Missing higher returns from stocks ❄️
It’s a trade-off—risks are real! 🛑
(6/9) – SWOT: STRENGTHS 💪
• Risk-Free: No default risk, backed by U.S. government 🥇
• Liquidity: Active market for trading, per data 📊
• Tax Benefits: Interest exempt from state, local taxes 🔧
Got solid foundations! 🏦
(7/9) – SWOT: WEAKNESSES & OPPORTUNITIES ⚖️
• Weaknesses: Interest rate and inflation risks, per economic reports 📉
• Opportunities: Capital gains from falling rates, diversification benefits 📈
Can it deliver both income and growth? 🤔
(8/9) – POLL TIME! 📢
US10Y at 4.358%—your take? 🗳️
• Bullish: Buy now, rates will fall soon 🐂
• Neutral: Hold, wait for more clarity ⚖️
• Bearish: Wait for higher yields or better opportunities 🐻
Chime in below! 👇
(9/9) – FINAL TAKEAWAY 🎯
US10Y offers a steady yield with safety, but with an inverted curve, caution is advised. Gem or bust?

US 10Y TREASURY: two rate cuts?The Fed held interest rates unchanged at their FOMC meeting during the previous week. On a positive side is that they still perceive two rate cuts during the course of this year, which would account for 0.5 percentage points further drop in US reference rates. Fed officials noted that there are arousing uncertainties related to moves from the US Administration which could impact the US economy to some extent. For the moment the forecast for the economic growth for this year was decreased by 0,4 pp to the level of 1,7%. Inflation expectations have turned to higher grounds than previously estimated.
During the first half of the week, the US 10Y Treasury benchmark reached the highest level at 4,33%, while it ended the week at 4,25%. At this point on charts, it doesn't look like the market gave up on testing the 4,30% levels, meaning that the market might modestly revert back toward the higher grounds. It should be noted that the PCE data are set for a release on Friday, next week, which increases probability of a higher volatility of US Treasury yields.

Rate Announcement Will Cause EXTREME Levels Of Volatility!With a tremendous amount of high impact news being released next week, you can expect very high levels of volatility especially coming up towards the first rate announcement.
Last weeks price action delivered to the upside as expected but I do still believe there is unfinished business at the 4.343% - 4.404% weekly PD array.
I expect price to expand to the upside following the high impact news being released next week. This can lead to investors chasing higher yields in risk off conditions

US10Y decision comingUS10Y decision coming very soon.
Possible M Breakdown with 5th wave down, or retrace for shoulder.

US 10Y TREASURY: FOMC weekThe US February inflation data were posted during the previous week, and with 0,2% for the month, was in line with market expectations. However, the negative effects of the US Administration related to tariffs were reflected in the Michigan Consumer Sentiment Index, which dropped in March below market estimate. What is concerning is that consumers are now expecting the inflation of 4,9% for the year, which is much higher from previous posts. It is obvious that the tariffs-on, tariffs-off game is hurting consumers’ expectations. In addition, the FOMC meeting is scheduled for the week ahead, on March 19th, which might bring back some volatility across US markets.
The 10Y US benchmark started the previous week around the level of 4,15% and moved to the higher grounds through the rest of the week. The highest weekly level was 4,34% at one moment, but yields ended the week at the level of 4,31%. Some volatility could be expected at the beginning of the week ahead, and before the FOMC meeting. At current charts, there is still some space for the higher grounds, up to the level of 4,40%. Still, it should also be considered that some probability for 4,20% holds.

Clear Head&Shoulders TOP on the UST 10yYld Operating framework: How the mkt WENT IN (1st H&SBtm w/ measuring Obj VerticleUP) is how the mkt is going OUT (2nd H&STop with measuring Obj VerticleDN).
Not the Multi-pivot horizonal line acting a pivot/attractor confluence to the setp.
h/t Dan The MAN...

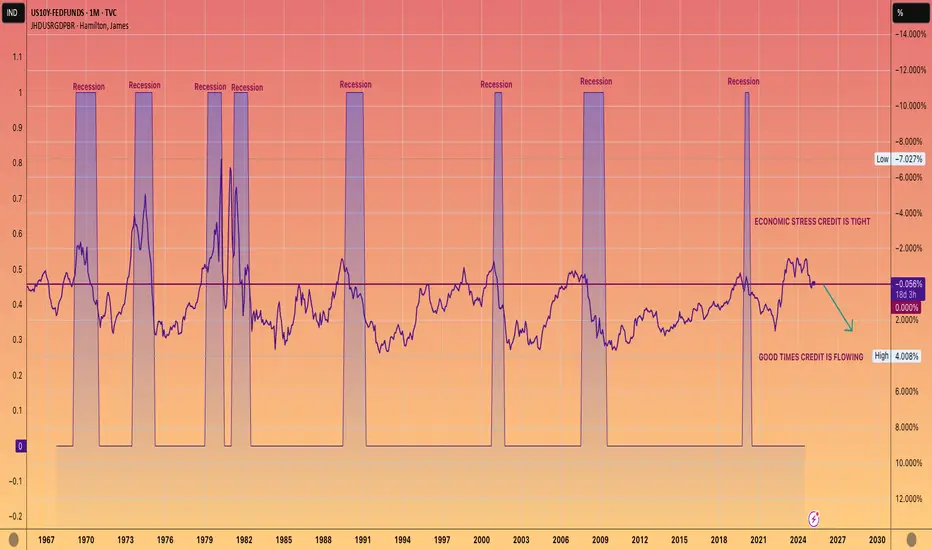
WE ARE COMING OUT OF A RECESSION. NOT GOING INTO ONE.This chart shows 10-year yield, which is closely tied to mortgage rates, minus the Federal funds rate.
When this figure is negative, it typically indicates that we are experiencing a recession or economic downturn.
Conversely, a positive number usually aligns with economic growth, often referred to as the good times.
While it's up to you to determine the reasons behind a official recession not being declared during the Biden administration, the undeniable data reflects a prolonged period of economic strain.
However, the current trend seems to be shifting towards a positive reading, which should lead to more accessible lending and economic growth.
AKA The good times are coming.
US10Y Strong sell signal below the 1D MA50.The U.S. Government Bonds 10YR Yield (US10Y) has been trading within a Channel Down since the October 23 2023 High. In the past 2 months it has been on a downtrend, which is the technical Bearish Leg of the pattern.
The 1D MACD is on its 2nd Bullish Cross on a decline, very similar with the previous Bearish Leg of the Channel Down. We are again on the 0.5 Fibonacci level and as long as any rebound gets rejected below or on the 1D MA50 (blue trend-line), the long-term bearish pattern remains intact.
We expect a similar Bearish Leg of -24% overall to target 3.685%.
-------------------------------------------------------------------------------
** Please LIKE 👍, FOLLOW ✅, SHARE 🙌 and COMMENT ✍ if you enjoy this idea! Also share your ideas and charts in the comments section below! This is best way to keep it relevant, support us, keep the content here free and allow the idea to reach as many people as possible. **
-------------------------------------------------------------------------------
💸💸💸💸💸💸
👇 👇 👇 👇 👇 👇

relief pumpSeems like election bull was already priced in, new money got washed.
Bonds are making a comeback, cash is a position.
Expecting more downturn after a relief pump, coinciding with yields retracement.
Yields trending with equity price are usually signs of either economical expansion or economical fears, such as slowdown or recession, during up and downs. The markets just jumped from one narrative to the other:
expansion(trump gets in office) ---> slowdown(tariffs imposed)
I think the expansion narrative will take a while to settle back(end of Q2 at least) after all the executive orders signed.
Although, I'm still long for the month of March, nice opportunity for a relief pump, before resuming of slowdown narrative.

US10Y - You Can Make Money And Be WrongLast weeks bias was bearish and although we have closed out bullish this week, the bearish PD array @ 4.126% - 4.104% which I was expecting has materialised.
This goes to show that you don't have to predict the weekly close. It's the draw on liquidity that is important.

US10 Treasury Yield Stock Chart Fibonacci Analysis 031025Trading Idea
1) Find a FIBO slingshot
2) Check FIBO 61.80% level
3) Entry Point > 3.99%/61.80%
Chart time frame: D
A) 15 min(1W-3M)
B) 1 hr(3M-6M)
C) 4 hr(6M-1year)
D) 1 day(1-3years)
Stock progress: C
A) Keep rising over 61.80% resistance
B) 61.80% resistance
C) 61.80% support
D) Hit the bottom
E) Hit the top
Stocks rise as they rise from support and fall from resistance. Our goal is to find a low support point and enter. It can be referred to as buying at the pullback point. The pullback point can be found with a Fibonacci extension of 61.80%. This is a step to find entry level. 1) Find a triangle (Fibonacci Speed Fan Line) that connects the high (resistance) and low (support) points of the stock in progress, where it is continuously expressed as a Slingshot, 2) and create a Fibonacci extension level for the first rising wave from the start point of slingshot pattern.
When the current price goes over 61.80% level , that can be a good entry point, especially if the SMA 100 and 200 curves are gathered together at 61.80%, it is a very good entry point.
As a great help, tradingview provides these Fibonacci speed fan lines and extension levels with ease. So if you use the Fibonacci fan line, the extension level, and the SMA 100/200 curve well, you can find an entry point for the stock market. At least you have to enter at this low point to avoid trading failure, and if you are skilled at entering this low point, with fibonacci6180 technique, your reading skill to chart will be greatly improved.
If you want to do day trading, please set the time frame to 5 minutes or 15 minutes, and you will see many of the low point of rising stocks.
If want to prefer long term range trading, you can set the time frame to 1 hr or 1 day.

US10Y-JPY10YToday as of March, 10th 2025, we saw the spread between U.S. and Japanese 10-year yields break below a key support level at 2.80%, now trading around 2.66%. Tonight’s Japan session will be crucial, as the Japanese 10-year yield has climbed to 1.56%, breaking key levels. If the US10Y/JGB10Y spread continues to contract, the yen will keep strengthening.

US 10Y TREASURY: a roller coasterThe roller coaster continues to be in the heart of financial markets during the previous period. The uncertainty over the trade tariffs, mixed macro data, Fed President Powell`s notes, all contributed to the strong shift in prices of assets across financial markets during the last few weeks. Previous week the 10Y US benchmark started with a lowest level of 4,10% and then moved toward the higher grounds for the rest of the week. The highest weekly level was 4,33% reached on Thursday, while the level of 4,20 was tested on several occasions.
The US NFP data for February, with 151K was lower from market estimated 170K. At the same time, the unemployment rate jumped to 4,1%, from 4,0% posted previously. In this sense, analysts are currently calculating that the next Fed's rate cut might come in June this year. In this sense, the yields of US Treasuries were adjusted. However, the uncertainties over trade tariffs and its impact on the US economy continues to be a known-unknown, which might shape the sentiment of the market also in the future period and its roller coaster moves.

US 10YR Treaury Yield Stock Chart Fibonacci Analysys 030825Trading Idea
1) Find a FIBO slingshot
2) Check FIBO 61.80% level
3) Entry Point > 4.2/61.80%
Chart time frame: B
A) 15 min(1W-3M)
B) 1 hr(3M-6M)
C) 4 hr(6M-1year)
D) 1 day(1-3years)
Stock progress: A
A) Keep rising over 61.80% resistance
B) 61.80% resistance
C) 61.80% support
D) Hit the bottom
E) Hit the top
Stocks rise as they rise from support and fall from resistance. Our goal is to find a low support point and enter. It can be referred to as buying at the pullback point. The pullback point can be found with a Fibonacci extension of 61.80%. This is a step to find entry level. 1) Find a triangle (Fibonacci Speed Fan Line) that connects the high (resistance) and low (support) points of the stock in progress, where it is continuously expressed as a Slingshot, 2) and create a Fibonacci extension level for the first rising wave from the start point of slingshot pattern.
When the current price goes over 61.80% level , that can be a good entry point, especially if the SMA 100 and 200 curves are gathered together at 61.80%, it is a very good entry point.
As a great help, tradingview provides these Fibonacci speed fan lines and extension levels with ease. So if you use the Fibonacci fan line, the extension level, and the SMA 100/200 curve well, you can find an entry point for the stock market. At least you have to enter at this low point to avoid trading failure, and if you are skilled at entering this low point, with fibonacci6180 technique, your reading skill to chart will be greatly improved.
If you want to do day trading, please set the time frame to 5 minutes or 15 minutes, and you will see many of the low point of rising stocks.
If want to prefer long term range trading, you can set the time frame to 1 hr or 1 day.

Watch credit spread increase drive toward correction territoryThe Nasdaq is already flirting with correction territory, and other major market indices may follow as the credit spread increases. As the market indicates its perceived increased risk in corporate default, this spread (high-yield bond yield minus 10y bond yield) increases independent of what the Fed does.
If the recent mini-spike up to ~7.5% heads north of 10% in short order--6 to 9 weeks perhaps, I'll become proportionally bearish.
The calculation: Subtract the US10Y (left/middle blue line) from the High-yield bond yield (right purple line) to obtain the spread.
As of 7 Mar 2025, 11.95% - 4.305% = 7.65%

CNBCAnyone remember 2 years ago when yield curve inversions were happening and they moved the goal post for recession? Naw, nothing to see here! Jim Cramer just like 6 months ago said that anyone that uses the yield curve as a tool is spreading FOMO and FUD, blah, blah, blah. I still cannot believe after the Wells Fargo garbage anyone would ever listen to Cramer but they still do. It just shows who in the market is delusional. Just focus on earnings he said. Now that Trump is in office the main stream media has done a complete 180 degrees. On CNBC yesterday: The federal Reserve's favorite recession indicator is now flashing warning signs. Nobody in mainstream media was saying anything about recession's on the Biden administration clock but now that Trump is in office the yield curve and inversions matter? This just did not happen overnight, not even remotely. You can look up numerous charts that show spending by President and Biden was the absolute worst, ever. If you listen to facts, you cannot fail as a trader but if you play follow the leader, you absolutely will get your rear end handed to you. Follow charts, not feelings, not the news, especially CNBC. Here is a news flash, recession: You wish, The Great Depression 2.0 with WW3 is next. You cannot print into oblivion and think nobody is going to pay for this. The US dollar isn't even worth 3 cents. People think inflation is the cost of products going up. It is not, inflation is the dollar worth less and that is why the dollar does not get stretched as far. Companies just take advantage of inflation to jack prices and line their pockets. It really is that simple. Back during the Great Depression, JP Morgan bailed the market out. Fun Facts:
-J.P. Morgan was a banker who helped the U.S. government during the Panic of 1893 and the Panic of 1907.
-During the Panic of 1893, Morgan helped the U.S. government by purchasing $62 million in gold to replenish the government's gold reserves.
-During the Panic of 1907, Morgan and his banker friends purchased $30 million in city bonds to prevent a financial collapse.
-Morgan also helped to finance the merger of Edison General Electric and Thomson-Houston Electric Company to form General Electric in 1891. A total of less than $100 million.
You are not bailing out a market that is over $30 Trillion in debt, so what happens? You want to know the truth? We don't do anything, default on the debt, the dollar crashes (which it already has) and we move to a new system. Which is CBDC, or Central Bank Digital Currency. Why do you think Trump is so big on crypto? Because he knows what is next, he is a business man. No matter what you think about presidents as people, they are all in on this and you're not invited. This is why I swing trade because until this hits bottom and I am talking S&P 500 to 1100 type of bottom, there's nothing long that looks great at all. We have to crash first. So many falsehoods out there being propagated by main stream media and wanna be traders, instead of just saying the truth. In the markets, it doesn't matter which side you're on, money doesn't care who you vote for. Stick to the charts and you cannot lose in short term trades. It isn't about the quantity of trades and your 40 accounts. It's about the quality, in and out. We have to stop lying in the financial world because of political sides. Politics does not belong on Wall Street. In the late 90's, I never even heard anyone talk about Democrats or Republicans on the trading floor. My point of all this? Do you see how following narratives can get you into trouble? 401ks, pensions, retirements are going to implode when the debt market finally gives way. Get ready folks!!

US10Y - End of February Analysis- February bearish monthly bias has been achieved this month!
- Sellside liquidity rests below 4.126%
- The possibility still exists for a short-term bullish retracement filling part of the imbalance this months candle created.
- Looking out for a retracement then capitulation through Sellside liquidity @ 4.126%
- Fair value gap lays close @ 3.932% – 4.170% so I will be paying close attention to it.

USD10Y Vs US02Y Bond LongUSD10Y Vs US02Y is now net long on the regression break.
I am not taking this trade, as it just of interest in market sentiment

US 10-Year Yield and USDJPY CorrelationThe correlation between the US 10-Year Yield curve and USDJPY has been especially strong over the past 3 years. If the Yen carry trade unwinds, we could potentially see the 10-year hitting 3% this year.

US 10-year yields eyeing move towards 4.00%Previous string of ideas has been invalidated following last week's price action.
The US 10-year yield completely crashed through the support at 4.40% last week following a host of strong data prints from the US coupled with a wave of risk-off investor sentiment stoked by Trump’s tariff fears which had investors rushing to the safety of US treasuries. Could Trump’s hardline tariff stance perhaps be a way to create demand for US debt?
Technically the yields have now dropped into oversold territory which strengthens the support between 4.13% and 4.17% however continued volatility in the equity markets will allow the US treasury market to attract more interest which could allow for a deeper move towards the 38.2% Fibo retracement at 4.04%.
The headlining events for this week is the ECB interest rate meeting and the NFPs for February. Market expectations are for the ECB to cut rates from 2.9% to 2.65%. The ECB has held a more dovish stance than the Fed since the rate cutting cycle began and if it’s more of the same on Thursday, I expect the US 10-year yield to find more demand to hold onto levels below the critical 200-day MA at 2.43%. Most of the focus will however be on the US non-farm payroll print for February. The NFPs print for January came in slightly lower than expected and another weak print on Friday will have investors question the validity of Powell’s statement that the US economy is strong and that the Fed is in no rush to cut interest rates. A weak NFP print will thus be positive for the US treasury bulls.

US 10Y TREASURY: uncertainty demands T-bonds Geopolitics were once again in the spotlight of market sentiment during the previous week. The uncertainty over the potential future increased tensions within the geopolitical sphere, pushed the US Treasury yields further to the lower grounds. Increased demand started with uncertainty over trade tariffs and currently is affected by politics. The funds from US equity markets fled toward the US Treasury bonds. The 10Y US benchmark yields started the week around 4,45% and ended it at 4,20%.
Looking at charts, the major support line for 10Y US yields lies around the level of 4,15%. In this sense, there is space for yields to move further toward the downside. Whether this would be the case for the week ahead is uncertain. There is also probability for yields to revert a bit toward the higher grounds, but some significant move should not be expected in the week ahead. Potential level could be the 4,3%.

US10Y - Fed’s Dovish Whispers Crush YieldsAn absolute peach of a delivery this week with the yields dropping into a discounted price region of the market; 4.468% as expected.
What can we look forward to next week?
