A Generational Mean Reversion is now UnderwayLast week I posted my long-term perspective of the SPX cash market from inception .
This is the reverse of that.
I am not an economist. I'm a pattern analyst and trader. Nonetheless, as a student of the economy, I find that rarely do fundamentals align with a technical forecast. I try to encourage my members to abstain from applying linear thinking to trading the markets. Case in point was the recent release of the CPI report. Prior to the release of that report CNBC contributor, Fundstrat Partner and America's favorite perma bull, Tom Lee, was quoted as saying...
"Investors should expect a "sizable rally" in the stock market following the Thursday release of the July CPI report", according to Fundstrat's Tom lee.
Post CPI release, the report was fairly in line with expectations, but the market sold off, and continued to sell off. There was no massive stock market rally post CPI release. How did that make sense? It's easy to proclaim bullish calls since the last 90 years in the stock market has been pretty much a 45-degree angle up from left to right on a chart. Statically, being bullish was good for business, attracts new clients, and no one likes a pessimist.
The time horizons of the two financial disciplines (Fundamental vs. Technical) are typically not aligned... unless those time horizons are long... very long . A long time horizon doesn't suit traders, they suit investors. But the more I delve into long term charts, the more I reflect on how this affects me, my family, and the generations to come.
I have shared my longer term perspective on the SP500 with my followers many times. I rarely, if ever, look at bonds. I don't trade them, and in terms of making a paycheck, my time is better spent elsewhere. Except this morning I decided to look at the 10-year bond yield. To me it's just another data point supporting my overall thesis that the markets are beginning a super cycle event that will play out over the course of the next couple decades.
On a recent conference call with members, I remarked that I received a direct message from a member who complained I was too bearish. I then apologized to attendees on the call because it is not within my nature to be pessimistic, or someone mired in doom and gloom. Shout out to Nouriel Roubini . But I concluded by showing my 150-year analysis of the SPX cash market on my screen via Zoom and concluded, "Unfortunately for the duration of the time you will ever know me, I will be bearish".
The above chart is a typical pattern that will play out. I cannot over emphasize that the pathway outlined above is run of the mill. Nothing about the above should shock any technician. This would be the same pattern outcome on any financial instrument given the above price action...it just happens to be the 10y bond yield. But my foray into the 10y bond yield chart has me thinking the following answers apply to the below questions.
Will mortgage rates come down in the short term so I can buy a house?
The chart above suggests in the intermediate term, yields will continue to rise into early to mid-2024 before retreating somewhat. However, if my analysis is correct...the areas of where they are now are going to be areas of short term mean reversion back up. It is from our current rate, that all subsequent yield rises will draw support from. So, my response to that question is, the time to buy a home will not be much better than right now in my life-time...it will only get incrementally less efficient to hold such a long-term loan.
With $5-6 trillion in money market funds (so called on the "Sidelines") how could the stock market decline by much with so much money available to potentially prop it up?
The above chart tells me the competition for cash and cash equivalents on a risk adjusted basis has not been this disadvantaged towards the stock market since the financial crisis of 2008. In my opinion, that disadvantage will only incrementally get worst. Cash will not be deployed into stocks like generations before based on competition and the risk associated. P/E ratios, book value...none of that is front and center as it pertains to those trillions of dollars. Cash being deployed now will always be gauging the associated risk/reward. That factor makes this different from all other equity market downturns.
Although so much of what I am uncovering manifests itself into our daily lives over the course of years and decades, and not weeks and months...therefore, we’re more likely to embrace apathy vs panic.
Nonetheless, I do view many markets through the lenses of long term mean reversion. I am still evaluating how that perspective can best be converted into action for long term benefit. I’m optimistic I have some time…(see I’m not entirely negative).
Best to all,
Chris
US10Y trade ideas

Powerful Sell Alerts on BTC/ETH/SPY ! Buy alerts on USD and % !Have to be extremely careful of alt bags if BTC and Eth are as bearish as they are
BTC is the sun to the space and when it falls hard the rest will follow harder. This means that we can lose 20% - 50% - 80% value in alts fast esp the low cap high risk alts.
These alerts can quickly change and new data needs to be reacted upon so have to stay up to date
This can mean that current candle printing may print and unprint esp on timeframes such as the monthly when its only half way thru the month.. all we have to go off is the current data and currently that is looking bearish for btc/eth/spy and bullish for usd/yields.'
If btc is the sun of the crypto space then US gov yields are the sun to the finance space
With the USD and Yields close to breaking out then this is another sign of weariness to risk positions esp low cap altcoins as a the height of risky positions.
Admiral Ackbar told me its a trap look
These breakouts in DXY and Yields can be a trap in which price goes just above piercing resistance only to fail.. and failed moves move fast. That would be a trap but it is speculation until more confirmed data comes in.
Follow and click the link in tradingview to keep up to date with the data
Cheers !

Most important chart there is right now. The bear steepener.Those who are not skeptical about pattern breakouts will take this chart seriously.

Looong-term US10year yieldTick tick...
Historic break out of the downward channel. Only yield curve control will get yields back into the channel. Is the next phase of QE going to be yield curve control...


US 10-year real rates (TIPS) – the rising true cost of capital US 10YR ‘real’ rates are essentially US 10yr Treasuries adjusted for 10yr inflation expectations – TradingView users can set this up using the equation: TVC:US10Y-FRED:T10YIE.
We can see this as the true cost of capital and in effect, the higher yields rise the more this supports the USD and negatively impacts US equity valuations. The rate of change (ROC) is always important, but if US 10yr real rates head to 2% then this may accelerate the selling in the US500 and NAS100.

US10YR YeildMinimum counter cycle of 10 yrs or more with a target price described in the video.
Please watch video for exact points.
Thank you.

US debt ceiling debacle and US 10-year yieldsUS 10-year bond yields have been trending lower since Oct 2022 after touching high around 4.250%. The rise in the 10-year yield from the past two weeks saw yields stop just short of the blue 61.8% Fibo level of 3.885%. Yields are currently testing the 200-day MA rate of 3.649% and a break below will allow bonds to rally further towards the 50-day MA rate of 5.525% which coincides with the black 61.8% Fibo rate of 3.474%.
I expect bond yields to get intimidating soon as the bond rally runs out of steam. Here follows the main fundamental reasons why I believe 10-year bond yields will soon climb above 4.00%.
1. Global financial conditions are easing, and excess liquidity is rising. Short-term rates seem to be peaking not just in the US but globally. Once global rates have peaked, it will allow the market to price in a future cyclical upturn for the US economy. Longer-term yields will capture this sentiment by moving higher as investors will prefer riskier assets to reap the rewards on buoyant liquidity conditions.
2. Inflation is becoming entrenched. Bonds are not a good inflation hedge which will further motivate the sell-off in longer-term treasuries. Heightened inflation expectations are the canary in the coal mine warning that bond holders may soon demand extra yield to lend money.
3. Bond issuance will rise when the debt-ceiling debacle is resolved. Additionally, the debt ceiling has brought scrutiny to the US’s fiscal situation which will dampen investor appetite for US debt (safe haven or not). Furthermore, foreign reserve holders have begun to diversify their holdings, while elevated short-term rates have raised FX hedging costs and kept buyers like Japan away.

Japanese Yen & USD Death Spiral In Action - YCC Yin Yang
Things are getting interesting in bond land, Japanese central bank balance sheet increasing after 09 to keep US bond yields down is finally starting to show signs of fail.
This system is starting to break due to investors losing faith in the system.
As faith is lost US bonds are sold, as US bonds are sold Yields go parabolic, Japan has been a US proxy since 09 to keep US yields in place
Stage 1
This works very well from Japan points of view due to how bad 1989 was and how the mentality of debt, leverage got destroyed essentially making the speculation market dead.
It allows the Central Bank Of Japan to create money and allow cheap credit near 0% interest rates without the problem of inflation. Now since 2020 this model has broken and Japan is getting inflation this is almost red alert due to the leverage of money supply in bonds.
Stage 2
US M2 / JP M2 debasement work together making the illusion the DXY is strong when in reality the US is forcing the EU / JP to debase pushing up the DXY.
Japanese Bond Yields have started to break causing actual investors to dump Japan bonds and US Bonds forcing the Japan Central Bank to do hard YCC on both JP and US Bonds.
BUT the increase in us interest rates has sparked even more selling of US Bonds and even more Japan YCC, the treasury debt interest is also almost at 1 Trillion.
Conclusion
Japanese Bonds & The US Bonds are finally in a Yin Yang death spiral feeding off each other and its starting to get out of control, Bank of Japan are even starting to panic.
Japan literally cannot raise interest rates as they would blow up the entire system due to debt interest being the largest holder of US debt.
The FRED will be forced to implement some type of Yield Curve Control on Japanese Debt while giving Japan time to Yield Curve Control the US Debt, meanwhile? Bitcoin is actually moving in correlation with the Japanese Central Bank Balance sheet.
QE To Infinity is closer than people think for those who don't know the US bond market is valued at $51tn.
Japan valued at $12.3tn
This market will have to be forced into QE / YCC as the bonds are the collateral for the world banks if they fail the world fails.

US10YHi....how about that...it seems to be so close to the top...my guess is 4.3_4.4% is potential retrace range for US10Y.
Good luck

US 10Y TREASURY: gearing to revert?The latest macro data are showing that the inflation is easing, however, it remains sticky. There is a lot of discussion among economists lately, whether CPI will remain on its downtrend, or we could expect another spike in inflation figures in the coming months. The PPI index posted during the previous week is showing that the inflation might stay resilient for some time. Investors ended the previous week digesting these mixed data. At the same time, the US Treasuries reacted with modestly higher yields. 10Y Treasuries ended the week at level of 4.15%, while were traded around 4% during the week.
The next Fed move cannot be anticipated with a higher level of certainty as it was for the FOMC July session because of currently mixed data. Fed Chair Powell is continuously stressing that Fed decisions will be data driven. In this way the market also reacted on Friday`s session to PPI data, anticipating another rate hike by the Fed. Markets were close to the level of 4.2%, which is significant in a sense, that it might further open a path for yields to reach 4.4% as they did last time in October 2022. However, for the moment there is a much higher probability that yields will revert a bit toward the 4.0% in order to test this level for one more time.

On the bond-stock inverted relationshipTaking a look at the charts: we've got the US10Y yield curve up against the S&P500 and the US06M yield curve. When the US06M curve crosses over the US10Y curve, it's like a signal that investors are feeling the jitters about borrowing money in the short term. This kind of move suggests they're worried a recession might roll in, which could make it tough for the government to manage its loans.
On the flip side, let's talk about the stock market. It's the front-runner when it comes to catching the wind of an expanding economy. And it's also the last one to pick up on the scent of an economic downturn. So, when things are looking up, stocks are quick to rise. But when a recession is lurking, stocks are slow to catch on.
In conclusion, closely observing the interplay of financial indicators, such as the US10Y yield curve, the S&P500, and the US06M yield curve, offers valuable insights into the dynamics of investor sentiment and economic cycles. When the US06M yield curve crosses the US10Y curve, it serves as a noteworthy sign that investors are exhibiting caution in short-term borrowing. This cautiousness stems from concerns that an impending recession could potentially complicate the government's ability to manage its debt obligations.
Conversely, the stock market operates as a barometer, attuned to the winds of economic expansion. It takes the lead in reflecting positive economic shifts, surging with optimism. However, it tends to lag when it comes to recognizing the onset of economic downturns, reflecting the cautious pace at which investors recognize recessionary phases.
In this intricate dance between yield curves and stock market trends, investors and analysts gain insights that help guide their financial decisions and strategies. The complex relationship between these indicators paints a multifaceted picture of economic conditions, contributing to a deeper understanding of the financial landscape and aiding in the pursuit of informed and prudent choices.

Bond benders Checking in on the US 10-year yield it looks like yields are holding levels above 4.00% and a break above 4.20% will allow bond to bend further towards the 2022 high of 4.328%.

Yield Inversion US10Y-US02Y vs SPX - We have 6 monthsEvery time the yield curve has gone negative, a market crash follows eventually. The trick is knowing when that happens. Nobody knows.
When the yield inversion starts rising again, that's a sign it's about to pop. Better start selling out of markets into USD. DXY will start rising again eventually.
Looking at the charts, my guess is 6 months tops before we reach a market high in a mega melt up. December 2023 to March 2024 is the top.
Markets will become very volatile! Sell on the way up! Put in sell orders at specific prices you'd be happy with profits. Then wait for your sell orders to trigger and for the money to come in!
We are at the end of a multi-year bubble which is about to pop. Protect your capital! But not yet!

US 10Y TREASURY: just a short easing?Surprising news hit the market during the previous week, when rating agency Fitch announced that it has downgraded the US government long-term debt credit rating by one notch to AA+. Market reacted with a negative sentiment. Equity markets went to downside, while Treasury yields went to upside. US 10Y Treasuries moved from 3.9% up to the highest weekly level at 4.2%. Still, yields have ended the week at level of 4.0%. A move above 4% opened a path toward the 4.4% level, where yields were last standing during October last year, however, there is still time in the future until this level is reached again.
For the moment, markets are focused on US inflation data which will be released during the week ahead. Depending on the results, some market volatility might be expected, especially, considering that posted average hourly earnings showed an increase of 0.4% for July. The level of 4% will be tested at the beginning of the week, with some probability that 3.9% might be reached. At this moment charts are not pointing that yields might go lower from this level.

10 year yields vs spx!!!! MACRO CAPITAL FLOWS SHIFTING !!!!
What HAPPENS when a 40 YEAR descending trend line BREAKS?
#gold #silver #crudeoil
39 year down trend
Fed Fund rate is a symptom of longer term yields
first time positive 7 year rate of change since 1984

Nebula Nights: An Interstellar ImmersionI have shared my primary case on this back in may.
This is a public repost for those who are still around.
Original:
---
This chart is the #1 reason why the global market will drop from here:
Debt is going to reach unsustainable levels, banks will deny companies on the brink of bankruptcy loans, commercial real estate will spiral down at speeds never seen before, and the us stock market will get slashed by 50% into next year.
Oh yeah, and 401k's will turn into 201k's.
---
Us10y w5 algo sits at 5.9%.

Will S&P500 Win? Or it will lose?😁Do you Remember in March 2020 when Rates were the lowest it had ever been I think since the Entire History of its Trading on the Open Market? Well Nothing is Permanent in this world since Covid lows it has rallied quite a lot. It would certainly be interesting to see what happens next.
Lets Discuss the Key Levels to Watch first
Right Now it is currently at almost 3.6%ish level. If we see a Break below 3.2% ish level then it will open the Gate to Go even lower maybe at 2.5% level. And that would be quite Bullish for S&P500 or the Whole General Stock Market.
Alternate Count : Maybe Trend is your Friend and it will continue to Keep Making Higher Highs and all that Nonsense sfuff. A break above 4.3% level would be a very Bullish Thing for this Market and that would put Pressure on S&P500 to stay below it's All Time Highs. If this scenario does indeed plays out a lot of people might not be happy. Again in Trading/Investing Hope for the best but prepare for the Worst🙂
Final Thing to say : Robert Prechter, the Famous Elliott Wave Analyst in his Elliott Wave Theorist actually said that it would be a very rare thing to see this thing test again at Covid lows. So he is infact Quite Bullish and says a Major Rally has begun since its 2020 lows. And ultimately we could see Bonds test it All time Highs. If that seriously were to happen than Whole Stock Market would collapse or atleast be in a Corrective Environment. He is quite Bearish on the Outlook of Stock Markets based on his Elliott Wave Counting. He also said that this is the Worst Decade to get invested. He is quite a Smart and Intelligent Person but we shall see what happens. Maybe he could be correct who knows with the Nature of Financial Markets one can never be One Hundred Percent Sure about Anything. What do you think? For the time being let's have Patience and watch our Key Levels

10 year yields vs spx!!! DO NOT FIGHT THIS !!!
Your next investment ideas should pay VERY CLOSE ATTENTION to this chart.
It is showing you where the next MACRO CAPITAL FLOWS are heading.
#uranium #crudeoil
paradigm shift event
continuation breakout

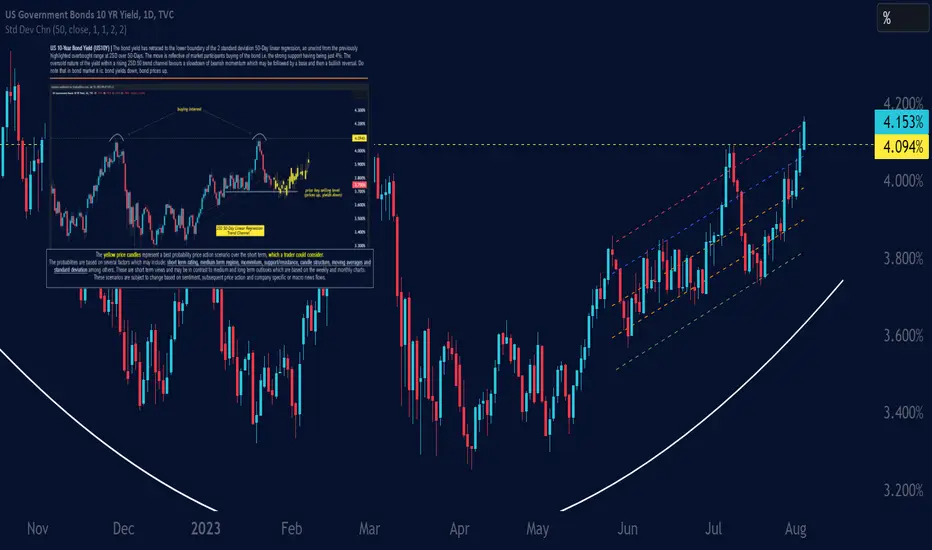
US10YThe yield now trades at the upper boundary of a 2 standard deviation 50-day linear regression trend channel, reflecting a high bullish momentum/approaching overbought condition. This follows the previous oversold condition discussed on 19 July where the yield traded at the lower boundary of the 2SD 50-Day linear regression trend channel.
US10 YEAR BOND YIELDHi everybody , Look at my beautiful analysis about rising 10y bond yield ...lokk at how it affect on us stock market .....follow my posts to be far from hype and euphoria ...
but be aware it is going to be close to the significant resistance ... and i think dxy is going to be close to big obstacle as well therefore dont sell off your gold and .....
link of my previous idea :https://www.tradingview.com/chart/US10Y/kld1jbtQ-US10Y/
Good luck,think inverse the crowd

I think for Next week dollar will be stronger For swing traders the market is showing a positive vibe for US Dollar as Index Prominently increasing and Government Bold Yields raising the Gold is decreasing and broke a multiple support level , for next week the condition based on fundamental analysis looks bearish market for gold and the data that is going to be released today will settle this analysis.

US GOVERNMENT BOND YIELDS : BACK TO 4.094%Notice a peculiar pattern with the Price action of TVC:US10Y
Price forms a turtle soup in the form of a sellside liquidity and then rallies to the upside to take out the buyside liquidity above the market price
Price then takes out the final sellside and then reallies to the upside. I want to see price to reach into the FVG on the 4hr Timeframe
Primary target
FVG
and
Buyside @ 4%
