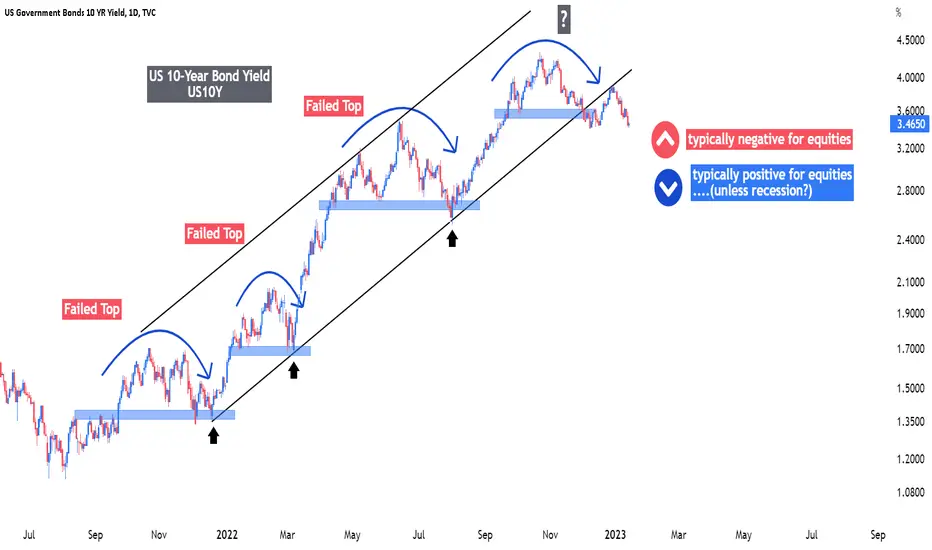
US10Y DropThe Daily timeframe is on a bearish ttrend and is making a pull back. The 4H has a double top and this confirms selling pressure. We are waiting for price to make a third touch of the trendline. This will hit out supply zone where we will wait for entry tiggers.
US10Y trade ideas

US10Y Dump All Year. Stocks, Crypto pump for 3 years.US government bonds are going to crash. This means nations, banks, mega corporations will pull their money out and back into the stock market. The tech money will go back into coins like truebit and future coin ftr

Big Four Macro: Bonds Part 2In last week’s macro outlook post we covered the outlook for intermediate and long bond yields. The analysis concluded that the long term technical trend has changed from lower to flat/neutral but that more work (i.e., a higher low) is needed to definitively turn the macro trend higher. That piece is linked below in the related idea section.
10 Year Yield Weekly: After peaking at 4.34% in October, 10s have declined into the first confluence of support. The confluence is defined by 2 channel bottoms, the fibonocci retracement of the last wave higher, an internal trend line (not shown and slightly violated) across the 3.04% - 3.25% highs and the last violated pivot @ 3.25%. Additionally, the move from 4.34% has covered about 100 basis points, consistent with the last two primary corrections.
This is the markets first solid opportunity since the October high to test meaningful support. Either, it bases here for a move back toward the 4.34% October high or fails and cuts much deeper, perhaps as far as the .382% retracement (2.86%) of the entire structural bear market. If the market does successfully base, the nature of the move should offer significant insight into the balance of the year.
Early in my career I was obsessed with Elliott. But after years of effort, I wasn't able to develop it as a reliable trading methodology. However, those years led me to believe that markets do often move in three and five wave sequences. But if I can't immediately identify an obvious primary sequence with a quick glance, then a count isn't reliable enough to use. Even then it is only useful only for context and then only in conjunction with a broader understanding of price volume relationships and trend.
Bond yields appear to have completed a clear five wave move from the March 2020 low to the October 2022 high, leaving them vulnerable to correction and suggesting an intermediate high that should hold for several months.
10 Year Ultra Futures Daily: When a weekly chart is resting at an important juncture, I like to drop down to the daily chart in order to assess the likely hood of it holding or failing. For this view, in order to assess volume I switch from yield to price. Ultras are into a zone of strong daily perspective resistance defined by the confluence of the .50% retracement of the 122-21 - 113-15 decline, the December 2022 high, volume profile, and the June 2022 pivot low @ 121-19. It is also taking more volume to produce gains, suggesting that supply is becoming more aggressive as the market moves higher. Three drives to a high (see linked related ideas) and the failed breakout above the 122-18 pivot all increase the odds of the resistance holding. A show of weakness that destroys the uptrend would strongly suggest a completed test and set the stage for a broader pullback.
Seasonal Tendency (US30Y Futures): Bond prices have very strong seasonal tendencies. They tend to set important intermediate highs early in the year before declining into mid-year.
Conclusions:
The monthly/macro trend has changed from lower to neutral, but yields need to make a higher low before definitively making the case that the new trend is higher.
The weekly chart is testing a solid support confluence. The outcome of that test should help define the markets behavior over the next 3-4 months. The weekly correction that began at the October high does not look complete.
The daily perspective rally that began last October is faltering. Signs of supply are developing and reliable seasonal tendencies are turning negative (yield up/price down). When combined with a strong confluence of weekly support there is a good chance that yields will begin to move back toward their October highs.
The characteristics of that rally will be important in determining if it is simply a test of the October high that eventually leads to a much deeper retracement (2.50% or so) or the beginning of a new leg higher.
A failure to hold the support confluence would strongly suggest that a much larger retracement of the two year old bear market was unfolding. Targets for that retracement would fall in the 2.25-.50% zone.
Good Trading:
Stewart Taylor, CMT
Chartered Market Technician
Shared content and posted charts are intended to be used for informational and educational purposes only. The CMT Association does not offer, and this information shall not be understood or construed as, financial advice or investment recommendations. The information provided is not a substitute for advice from an investment professional. The CMT Association does not accept liability for any financial loss or damage our audience may incur.

yield ratio vs bond priceillustrating the overshoots from yield ratio formula (1/rate) when compared to bond price formula 100 - rate

GLOBAL MARKET BOND YIELDS SIGNALS BULLISH STRENGTHThe gloabal financial markets have a direct correlation with each other
The interest rates are no exception to this rule.
Notice that the TVC:US10Y forms an SMT(Smart Money Divergence) with the rest of the Bond yields
TVC:US10Y takes out the Sellside Liqudity while TVC:GB10Y and TVC:DE10Y did not take out their respective lows. This signal Huge accumulation of longs on German and Britain's Bond Yields
This should melt Treasury Bonds and Sink the Stock Markets

Are US10Y Bond Yields really gonna plummet?With USD recently becoming a less attractive asset to hold following the recent dump and bubble burst, US10Y bond yields are not demonstrating a very appealing picture as well. Technical aspects are as follow:
1- Daily TF Cup and Handle reversal pattern
2- Uptrend lower trendline Broken
3- It has made a first Lower High and Lower Low and still pushing lower with small frame corrections
King USD is in a bad shape guys with continuous loss of investor interest. Plan your trades accordingly, Best of Luck and Happy Trading :-)

us10y Compared to goldHello friends, I hope you are well
Well, I want to see this chart together
US 10-year Treasuries have reached a support since they started to fall
Gold followed an upward rally
And now gold has reached an important resistance, and in my opinion, the price of gold will drop very soon, and in the next week, I think the price of gold will decrease.
And on the other hand, the US 10-year bond has started an upward rally
And from a technical point of view, we see that it has an upward path
This is just my personal opinion
Good luck

US10YYields can explode from here as earning on US equities disappoint on earnings and job losses set in job losses

How will markets react to rising yield and dollar?Moving averages can be applied to many things, from stocks and currencies to fitness measures and crop harvests. Here, the candles show US10Y is finding support off the 200ma, after making a significant decline. The 20ma (blue) and 50ma (dark blue) will indicate the yield's next trend as they separate.
The green line graph shows a serious decline in the U.S. dollar. As the orange short-term trendline shows, it may be ready to move a little higher.
The yield and dollar may not rise back to the highs, but they definitely can move up for a bounce in the near term. If the recent relationship continues, then this would create selling pressure for global and tech stocks while giving another lift to defensive sectors.
Here's a little-known fact to watch out for:
Starting in January, a new formula is being used to calculate CPI (consumer price index) data. The first release of this will be in February and the numbers are expected to increase relative to Dec. data. The new calculation will update spending weights annually (using one year's data) instead of biennally. Thus be alert to the possibility that markets react negatively to a high Jan. CPI, as the majority now think prices are coming down. On the flip side if CPI is in-line or lower even with the new formula, then markets will get quite a lift.
www.federalregister.gov

US 10 YR YIELD - ObservationThe US10YR has now retraced to the 200dma and close to the yearly pivot point.

US 2/10 yield spread in a for a massive reversalUS 2/10 yield spread approaching macro support. TA bottom might be slowly forming too (need confirmation)
Expecting the spread to reach 0 before the summer while the rest will be history
buckle up

Looking for #us10y to find Higher LowsLooking for #us10y to find Higher Lows and continuation to the upside as new highs were made. #us10y moves opposite to the #crypto market.

bombs awayAre #gold shorts paying attention to anything?
All support is lost on #us10y, and now even closing below weekly EMA30 (shown in blue)!

Looking to Short 10's On a breakdown on the daily, ill be shorting 10 year bonds.
High on all the higher timeframes.

US yields looking for another move upLooks to have formed +ve divergence on RSI.
FED are NOT going to pause/pivot in coming weeks. Data still ok as a whole and until much softer yields have to go/stay higher for longer than people think.

Big Four Macro Outlook: 10 Year RatesI begin each year reviewing the long term technical positions of the "Big Four." 10 Year rates, SPX, Commodities, and the US Dollar. Since by profession I am a rates/credit portfolio manager and trader, I always start with rates. Granted, macro doesn’t typically impact shorter term (swing, daily and weekly) trading, but having a framework for markets and for recognizing change is important. Last year’s thoughts, including extensive fundamental background, are linked.
In this piece I will recap my views on the monthly chart and follow next week with my view on the weekly chart and conclusions.
A reminder that falling bond yields are synonymous with higher bond prices. In other words, a downtrend in yield = a bull market in bonds.
Over the last four decades bonds had consistently and reliably made lower highs and lower lows. The entire bull market was defined by a broad declining channel (A-B, C-D). The A-B downtrend line represented the "stride of demand" or the zone where buyers consistently emerged and the C-D line represented the "overbought line" or the zone where supply consistently emerged.
From 2012 forward there were growing signs that the long downtrend was aging. Four things stood out. 1) The repeated failure to push to the oversold line (C-D). 2) The flattening out of the decline where each push to a new yield low only covered around 100 bps. 3) The 2018 spike to 3.25% that weakened the primary A-B downtrend. 4) In March of 2020 bonds pushed to the area around the center of the channel, and again failed to push into the overbought line (C-D), suggesting that demand was tiring. These very visible change of behavior strongly suggested that the 40 year downtrend was in danger.
Now, the clear break and acceleration above the A-B downtrend has moved the long trend from bullish to neutral. While it’s likely that the move above November 2018 pivot @ 3.25% coupled with the changes of behavior mark the beginning of a long term bear market, a higher low (perhaps forming over the first half of 2023) is needed to complete/confirm that change.
Note the additional changes in behavior. The 400 bps move from 0.33% to 4.33% represents the single largest bearish move since the inception of the bull market in September 1981 and the current MACD oscillator level has far exceeded the levels that marked yield highs over the course of the entire bull market.
Triple Screen: Daily, Weekly, Monthly:
There are several key fundamental points around rates:
-The defining macro characteristic of the 40 year bull market has been the continual fall in the inflation rate. If that is changing, the secular bond trend is likely to also change.
-If the trend in inflation is changing, the negative correlation between bonds and equity that drives 60/40 allocation and risk parity investing is likely to flip and become positive. In other words, bonds and equity would, outside of periods of panic, rise and fall together destroying the diversification benefit. This has been the historical norm and I expect that the market will gradually move in that direction.
-The caveat being this: Quantitative easing removed the value proposition from bonds, when equities began to decline this year bonds COULDN'T provide a safe haven… they were already far too expensive, particularly in context of a Federal Reserve that was aggressively tightening monetary policy, that is no longer the case. Bonds, while still expensive can again provide a tactical hedge should risk assets weaken dramatically.
-At first glance, this seems at odds with the with the change in correlation discussed above, but it is a difference between the secular tide verses the intermediate wave.
-Most substantive bond rallies have been the result of a crisis that created a flight to quality. In an economy that is overly financialized and levered, rising rates often break the weakest link in the economic chain, creating a new crisis and a subsequent flight to quality rally. While so far, there is little evidence of a systemic crisis, the lagged effect of the rapid increase in rates in an overly financialized system demands attention.
Bottom Line: While there is still more work to be done to confirm the trend change, I believe the bond trend is finally changing as the world moves from the deflationary backdrop of the last several decades to an inflationary backdrop. I will be a much better seller of rallies and bearish technical setups in the weekly/intermediate perspective.
Good Trading:
Stewart Taylor, CMT
Chartered Market Technician
Shared content and posted charts are intended to be used for informational and educational purposes only. The CMT Association does not offer, and this information shall not be understood or construed as, financial advice or investment recommendations. The information provided is not a substitute for advice from an investment professional. The CMT Association does not accept liability for any financial loss or damage our audience may incur.

US10YUS 10-Year Bond Yield | Chart #1 | The rejection of the re-test of the channel breakdown is seeing further downside follow-through. The yield is trading near the early-December lows of 3.4% of which a downside breach would create a further short term technical tailwind for bonds (i.e. yields down, bond prices up).
US 10-Year Bond Yield | Chart #2 (not shown) | Note that the yield is close to it's first re-test of it's rising 200-day moving average since 29 December 2021. Usually, the 1st test after a prolonged absense is met with support, possible an overshoot to the downside followed by a rebound. Let's see how it acts if and when it gets there.
US10Y Hit a 9month support. Critical moment for the market.The US10Y hit today, in the aftermath of the 6.5% U.S. CPI, the Higher Lows (HL) Support line that has been in effect for 9 months (started on March 7th 2022). With 1D technicals bearish but not heavily (RSI = 42.655, MACD = -0.035, ADX = 36.284), the trend is undecided at the moment, at least on the short-term.
Though we see a clear Channel Down since the October 21st 2022 Top, the price can give a short-term bounce back to (and above) the 1D MA50 and the top of the Channel. Eventually, with the macro-economic outlook on the bond market changing, we believe the bearish trend will prevail on the long-term, with our immediate target being the 1D MA200.
## If you like our free content follow our profile to get more daily ideas. ##
## Comments and likes are greatly appreciated. ##
## Also DONATIONS through TradingView coins help our cause of increasing the daily ideas put here for free and reach out more traders like you. ##

US 10Y Yield at key inflection pointMarket looks fragile, and has potential for a sharp reversal lower.

US10YTesting the waters here- as i have taken a long break from TA and want to experiment with new ideas.

Will the backup hold?The 10 year T is fighting the line. A bounce and break of current downtrend could mean more pain. But a break of the secondary support would demolish the bears as it would signal my long-expected blow-off top in the U.S. stock market. Stay tuned.

10YR-02YR Inversion (Daily) 01/11/2023Well this inversion is probably more popular than the 10yr-03mo, and it also keeps looking worse! They are both inverted pretty deep as I mentioned on the 10-3mo published chart. This is also often a key leading recession indicator.

10YR-3MO Inversion (Daily) - 01/11/2023Well this keeps looking worse! Many follow the 10-2y, some prefer this 10y-3mo yield curve. They are both inverted pretty deep. This is often a key leading recession indicator.
