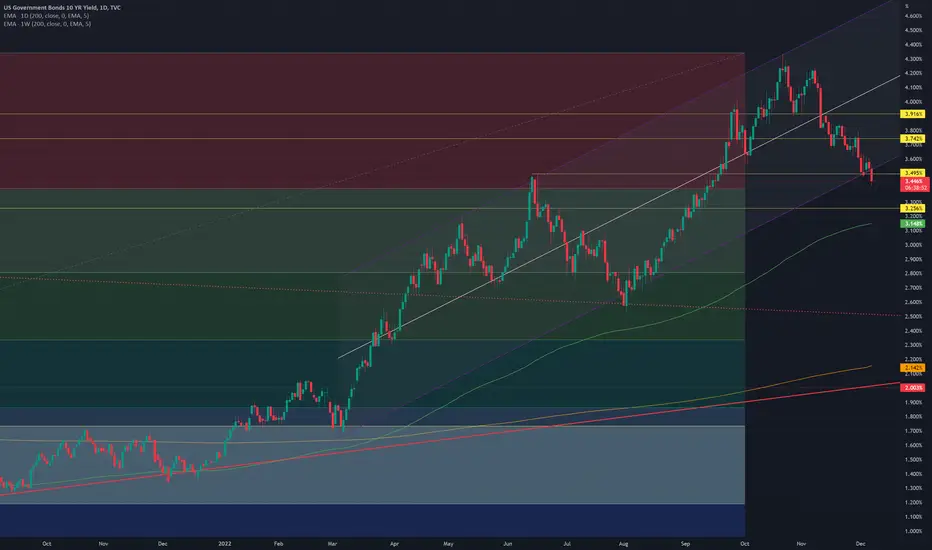
US10Y Time for it to decide the long term trendThe US10Y is approaching the Higher Lows support of the 2022 bullish trend. Holding it can make the price rebound back to the 1D MA50 (blue line) and the dashed line of its growth zone at least.
A break below it and in particular the 1D MA200 (orange line) can turn the trend bearish long term to the 1W MA100 (red line).
The 1D RSI is on its (oversold) Support level as well.
Follow us, like the idea and leave a comment below!!
US10Y trade ideas

10 year yield has broken the trendlineThis chart yesterday had the yield at the bottom of this up channel. Now it looks like more like it is breaking down. Yields heading lower. This makes the yield curve even more extremely inverted which is a recession predictor.
USD vs US yields : 2017 compared to 2022USD vs US yields ***2017 compared to 2022**
Think US yields can see a rally short-term now after top divergence and 5 down on yields. The question is how far can USD go and stocks drop till US yields complete an A-B-C bounce. DXY resistance at 108-109.

10 year yield at the bottom of a channelIts quite a nice looking channel here on the 10 year yield chart. Probability of a bounce higher off this support level seems high indicating potentially a fall in bond prices in the short run.

US10Y Bounce at 3.332% then to 5.376 by Summer 2023The current pitchfork trend is holding and I'm looking at the US10Y reverse at 3.332% this month. I'm also expecting the fed to over tighten or some other news event to drive the US10Y to 5.376% by June 2023. The nature of pitchforks are able to easily visualize the physics of the market and I'll do my best below to explain what I'm seeing.
From a price action perspective the US10Y broke the median from the beginning of time and is coming back to re-test it as support.
As of August 2011 gap down to Jan 2014 price action has respected that median range through today.
In the world of physics, when you have a huge swing away from the median, you'll also have the same energy swinging back in the other direction. Think of a swinging palm tree in the wind.
The same is happening here and is illustrated by capturing the breakdown in Feb 2020 where price quickly broke trend then held the 3 standard deviant move down during the 2020 crash. US10Y has quickly made a move in the other direction and is preparing to breakout with huge force.

10yr inflection pointThe 10year is confused! will 2023 be bullish or bearish for earnings? We won't know until probably Q1 earnings, so until then markets will be volatile. If 10Yr heads to 5% you can bet earnings will continue to go higher, and S&P will become cheaper even at around 4000. if 10yr sells off and heads to 1.5% means the fed are cutting rates and earnings are dropping like a lead balloon. Regardless of the fed cutting rates, S&P will become expensive and will need to correct or crash!
I have no idea, either way, the crash comes now, or after the 10yr hits 5%, but the earnings crash is coming...laying off people isn't an option, it creates a crash....
ps every single recessionary metric is screaming recession....

Yield inversion to reach bottom January 2023For DOT COM bubble, when yield inversion reached bottom, the top of the markets were 182 days later.
IMO we'll reach bottom in January 2023 and markets will peak 182 days later, in September 2023.

NO ONE IS TALKING ABOUT THIS.I thought I'd share something very interesting, that may occur in the upcoming weeks, the upcoming months.
Looking at the US Bond Yields, we see it forming a rising wedge pattern.
In Elliot Wave Theory, it is called a leading 5th wave diagonal.
The past weekly candle closed as a tweezer top AND finding resistance at the 0.786 fibonacci extension level.
This may signal a bearish reversal of conditions.
Now you all must be thinking, "Oh no... Not another Bearish idea from this guy..."
HOL'UP. WAIT A MINUTE.
A decrease in bond yields tend to have an Inverse Effect on asset markets.
When Bond Yields decrease, It means investors are more likely to allocate their capital away from bonds (safe-havens) to high-risk high-reward investments. Vice versa when bond yields increase.
Just a few closing thoughts, please keep in mind that although it is a bearish pattern, we must not assume a reversal until Price breaks down from this wedge.
I hope you all really enjoyed my analysis on the US10, fellow traders! 🥰
Take care, God Bless, & let's kill it at the charts! 🥰🥰

INTEREST RATES STILL HAVE MOMEMTUMFrom simple market structure, interest rates doesn't look like it would reduce at all, it will still go above the roof
Of course, this would affect inflation rate and destroy the economy further still
Taking notes of the Stock against market that is directly affeected by interest rates. Currently, stocks are rallying due to the interest rates decrease.
I expect a rally in the interest rates as from next year, due to the seasonal tendency of Stocks declining

US10 Year BondUS10Y bond yield seems near support. If it take support there and reverse on upside then some correction may come in equity

us yields bottoming soonUS 10y yields have pulled back from over 4.3% to below 3.6% in a matter of weeks on the back of FED HOPIUM.
We may get a slowing in rate rises but not due for a pause yet and way too soon to price in cuts.
I see yields rebounding from around 3.50s% back towards/above 4% in coming weeks/months.

Preparing for the recession: US10Y-US03M inversionThe inversion of US10Y-US03M is in my opinion the best recession indicator.
Recession in 6 to 18 months.

US10Y - 10Y Bonds: And Reverse Forest RuuunLet's see:
This was the chart I posted this year:
We reached the U-MLH.
This is the stretch to the upside. How ever, it could go further towards the Moon.
But usually, if price get rejected at the MLH's, we see the opposite move. In this case to the downside, to the Centerline.
This is a great opportunity, the second time this year in the 10Y Bonds, which I clearly will not miss.
Additionally this would indicate a bounce in the index markets (S&P500, Nasdaq etc.).And if you pay attention to my S&P Chart, then you know that the Centerline is reached too there.
So prepare for a possible bounce, even it's just temporarily.

US 10-year creeping higherWorth watching bond yields here as they have started to creep higher - could spell trouble for gold, silver, Nasdaq et. al.
The 10-year has found some support from the upper end of the key support area between 3.50% to 3.65%.
Although it is not an outright bullish signal for the 10-year yield, there's the possibility that it could stage a more meaningful recovery.
Remember, Fed Chair Powell is speaking on Wednesday, and we have lots of US data to look forward to this week too.
By Fawad Razaqzada on behalf of FOREX.com

US10YUS 10-Year Bond Yield. Another 'failed' topping structure or will yields finally make a solid move to the downside? #US10Y

US10Y Still bearish at least on the short-termThe U.S. Government Bonds 10YR Yield (US10Y) has gone a long way since our top prediction a month ago:
As you see, the Lower Highs 1D RSI Bearish Divergence, accurately projected the top and the price broke much lower than the 1D MA50. On a short-term horizon, as long as it fails to close above the 4H MA50 (blue trend-line), we will be targeting the 1D MA100 (green trend-line). Only a break above the 4H MA200 (orange trend-line) can restore the bullish trend, towards the 4.330 High as it happened on June 01 2022. On the other hand a closing below the 1D MA200 (yellow trend-line) would confirm the long-term trend switch from bullish to bearish.
-------------------------------------------------------------------------------
** Please LIKE 👍, SUBSCRIBE ✅, SHARE 🙌 and COMMENT ✍ if you enjoy this idea! Also share your ideas and charts in the comments section below! This is best way to keep it relevant, support me, keep the content here free and allow the idea to reach as many people as possible. **
-------------------------------------------------------------------------------
You may also TELL ME 🙋♀️🙋♂️ in the comments section which symbol you want me to analyze next and on which time-frame. The one with the most posts will be published tomorrow! 👏🎁
-------------------------------------------------------------------------------
💸💸💸💸💸💸
👇 👇 👇 👇 👇 👇

Us rates ... trend downUs rates has show some weakness now and due to it we are opening a short position

US 10 YEAR BOND YIELD ANALYSISThe long term bond yields are falling. The 10 Year yield may find support at 3.0- 3.2 before consolidating and breaking out or reversing. 3.0 - 3.2 zone is previous support/resistance where the market has turned before.

$TVC and $SPYSometimes looking at $TVC is a good leading indicator for market sentiments. Another one would be comparing it to $SPX or $SPY along with $DXY

next cross of 10y-03y vs 10y03m would be recessionnext cross of 10y-03y vs 10y03m would be recession
next cross of 10y-03y vs 10y03m would be recession
next cross of 10y-03y vs 10y03m would be recession

US10YNot financial advice. The essence of investing & trading is the intelligent and patient preying on the greed, fear, impatience, addiction and ignorance of the majority. It's definitionally
*GET OUT FROM THE STOCK MARKET*

US10Y < SOFR = Hold my beer.US 10 year yields are again less than the secured overnight financing rate (SOFR.) The last time this happened was December of 2018, and things were papered over. Position accordingly. Idea credit to Reddit u/BoatSurfer600.

"Double top" for US10Y around Oct - Nov 2022"Double top" formed for US10Y around Oct - Nov 2022, dollar index follow closely with US10Y since 2022, which may indicate the Dollar index may "peak" for current stage.
