VIX indicates trouble aheadDisclaimer: This idea is not intended as investment advice and should not be interpreted as an offer to sell or a recommendation to purchase any asset. Any decisions made based on the information presented in this idea are the sole responsibility of the individual. All investment decisions should be made independently, taking into account your financial situation and objectives.
VIX trade ideas

Volatility is massively underpriced given the upcoming eventsWe are about to have FOMC rate decisions, GDP numbers AND meta/msft/TSLA/IBM earnings, but the VIX is near a local low? I'm buying UVXY calls to profit when vol rises off these events.

VixUntil 2025,
Vix will rocket to at least $ 47.
Fasten your seat belt.
Just Trade, but amateur just sleep. Don't buy US Stock.

Plus on VIX. VIXIn OBOS territory now, yet VIX never stays in it for long and always reverses after forming a single hump on the momentum indicator. Price action is not suggestive of a turn, yet interestingly Stoch-RSI by Ehlers already produced a bullish signal. Fibonacci ratio clusters are noted.
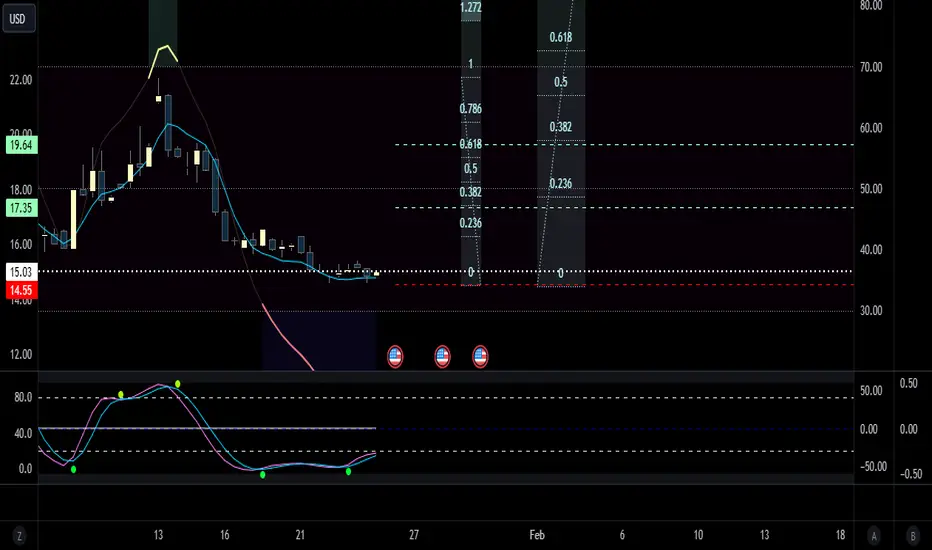
VixFound support At 14.50 today
4hour CCI and RSI tells me look for a bounce to 18.50 and maybe higher over the next week

VIX Will GO DOWN|SHORT|
✅VIX is trading in a local
Downtrend and we are now
Seeing a bearish breakout
Of the rising support line
So we will be expecting a
Further bearish move down
SHORT🔥
✅Like and subscribe to never miss a new idea!✅

Bearish Vix signs Looking at this is so bearish Rate of change is negative and Rsi is below 50 and dipping and we also closed below a support line we could see a solid move down before we get any kind of Vix movement up.

VIX (SVIX)....easy trade with great upsideThis is one of my darlings and it has taken a few days to get to this point so pay attention to potentially make some delicious lemonade....First, don't place a position until it crosses the yellow / red lines! 10 SMA / 50 SMA and see an upward slope trend shown by the LRS indicator. The target price here is around $15 "ish" with some health drawdown that is the toll to go on this highway. But this baby can easily go up to 17/18ish in a matter of hours or few short days.
Place your notification alerts early, but realize there could be some consolidation before it jumps back up again....you can do it!
Best of luck, do your own DD, and safe trading!

Watch it very carefully , this is not its normal pattern....This channel is not providing individualized trading or investment advice, nor is it a banking service, brokerage service, trading service, investment service or money management
service.
It is just an educated guess.

VIX has reached its targetVIX has reached its target.
Let's have a loop at the index price action that might give signals of exhaustion.
We might get another leg up.

VIX | Stock Market Correction IncomingVIX is the ticker symbol and the popular name for the Chicago Board Options Exchange's CBOE Volatility Index, a popular measure of the stock market's expectation of volatility based on S&P 500 index options. It is calculated and disseminated on a real-time basis by the CBOE, and is often referred to as the fear index or fear gauge.
The VIX traces its origin to the financial economics research of Menachem Brenner and Dan Galai. In a series of papers beginning in 1989, Brenner and Galai proposed the creation of a series of volatility indices, beginning with an index on stock market volatility, and moving to interest rate and foreign exchange rate volatility.

Long the VIXIm a prema bull so time to be bullish on the VIX. Lets hope we consolidate, hidden divergence on monthly, then pop. If we can reach 80 vix and hold it for few months that would be great.

VIX....target at $22VIX hasn't let me down yet! price seems to be spiking nicely above SMA lines and historically there's a nice upside. Anything above $20 is great, but I think the sweet spot is $22!
UVIX for long position!
Best of luck and always do your own DD!

VIX to Trend Lower: Consider Short Positions for Next Week
- Key Insights: The VIX index has shown a decline in volatility, presently at
16.13, suggesting market stability but underlying apprehension remains.
Investors should consider short positions as expert forecasts indicate a
target around 15.5, which aligns with current market sentiment. The decrease
in the VIX suggests a risk-on environment, but caution is warranted due to
potential geopolitical and macroeconomic risks that could suddenly escalate
volatility.
- Price Targets:
- Next week targets:
- Target Level 1 (T1): 15.76
- Target Level 2 (T2): 15.5
- Stop levels:
- Support Level 1 (S1): 17.35
- Support Level 2 (S2): 19
- Recent Performance: The VIX has decreased by approximately 4.84%, moving from
a higher volatility state towards a more stable environment. The index has
reported a reduction of about 1.25 points, reinforcing the sentiment of
declining market volatility.
- Expert Analysis: Analysts are predicting a continued trend of lower
volatility, with estimates suggesting a potential target for the VIX around
15.5. Despite this trending lower, recent fluctuations highlight an
underlying nervousness among investors, which could prompt an uptick in
market activity as positions are reassessed.
- News Impact: The current state of lower volatility in the VIX is reflective of
a cautious yet optimistic investor outlook. Nevertheless, external factors
such as macroeconomic reports and geopolitical tensions could trigger sudden
changes in market sentiment, making it essential for investors to remain
vigilant in their trading strategies.

VIX potential to 30 as stable plateauWith the economy grinding to an halt. We should expect increased volatility with a shitstorm of bad company news of declining revenues and lay offs.

$VIX BEARFLAGvix BEARFLAG BREAK DOWN I THINK it breaks down to $14.29 n then with double bottom support it flies be cautious . RIGHT now market PUMPING enjoy the gains

VIX is dying and the markets are flying!TVC:VIX NASDAQ:QQQ AMEX:SPY
Do you see now!👀
Yesterday I posted about the TVC:VIX making a bear flag pattern and showed you what's happened the last two times!
The VIX is dying and the markets are flying! The TVC:VIX has a lot more room to the downside as well.
You know what that means! 🚀

$VIX: THE FED FUD'STERS ARE AT IT AGAIN! THE FED FUD'STERS ARE AT IT AGAIN! 🛑
All I have to say is the TVC:VIX is forming a beautiful Bear Flag right now! Look what's happened in the past!
Bear flags form then break to the downside and we plummet. Stay patient friends!
Not financial advice


VIX Monday Trading Plan: Entry, Stop Loss, and Targets!
### **Chart Key Levels:**
1. **Support Levels**:
- **Yellow Line (Entry Point)**: Around **18.35**.
- This serves as a potential entry zone based on the current consolidation and trendline support.
2. **Stop Loss (SL)**:
- **15.11** (White Support Line): This level represents a key support zone. If breached, it indicates a further decline in volatility, invalidating the setup.
3. **Targets (T1 & T2)**:
- **Target 1 (T1)**: **22.01** (Red Line) – A key resistance level and first profit-taking zone.
- **Target 2 (T2)**: **26.54** (Green Line) – The next resistance zone for a larger move, aligning with recent high levels.
### **Entry Setup**:
- Enter the trade near **18.35**, as this zone aligns with horizontal and trendline support.
- Look for confirmation like a bounce or bullish momentum before entering.
### **Trade Risk and Reward**:
- **Stop Loss**: Tight stop loss at **15.11** to minimize risk if the price breaks below support.
- **Reward**:
- T1: Approximately **3.66 points** from entry (around 20% gain).
- T2: Approximately **8.19 points** from entry (around 45% gain).
### **Potential Scenarios**:
1. **Bullish Scenario**:
- If the price holds above **18.35** and shows strength, it can move toward **22.01** (T1) and eventually **26.54** (T2).
2. **Bearish Scenario**:
- If the price breaks below **15.11**, the setup fails, and further downside is expected.
This plan is based on the current technical analysis and key levels observed on the chart. Monitor price action closely at entry and adjust stop loss and targets based on Monday's market momentum. Let me know if you'd like additional clarification or adjustments!
Conclusion:
By entering near 18.35 with a strict stop loss at 15.11, this setup provides a favorable risk-reward ratio targeting 22.01 and 26.54, aligning with key support and resistance levels.

Smashing it again, VIXIf you like trading the VIX, have a look at this Liquidity Sentiment Indicator. This would pay for many annual subscriptions in 72 hours !

VIX Low Risk Zone still validatesAfter an excellent analysis and making money(some part of trade is still open), again any come back to the zone is an opportunity to buy...

the US stock market will get nuked tomorrow or mondayHere's a TVC:VIX analysis. Check SP:SPX 15m, just see the momentum. Feel it. Apparently it's the sharpest plummet of the past months. the US stock market and CRYPTOCAP:BTC , the crypto market, TVC:GOLD , as well, will get down for 20 or 30% in the coming weeks or a month. TVC:DXY and the US dollar FX_IDC:USDEUR would be get high since the dollars from the sold assets fload into the liquidity space. After that, for months I guess, FX:USDJPY get lower and EUR, JPY wins for some years.
