Elliot Wave ABC CorrectionS&P 500 might be looking at a retraction (ABC) based on an Elliot wave correction.
I am not certain as to the stimulus that would force such a correction.
But it might happen...
Market insights

Bullish continuationS&P500 (US500) could fall towards the pivot, which is a pullback support, and could bounce to the 1st resistance, which is a multi-swing high resistance.
Pivot: 6,505.98
1st Support: 6,141.15
1st Resistance: 6,900.95
Disclaimer:
The opinions given above constitute general market commentary and do not constitute the opinion or advice of IC Markets or any form of personal or investment advice.
Any opinions, news, research, analyses, prices, other information, or links to third-party sites contained on this website are provided on an "as-is" basis, are intended to be informative only, and are not advice, a recommendation, research, a record of our trading prices, an offer of, or solicitation for, a transaction in any financial instrument and thus should not be treated as such. The information provided does not involve any specific investment objectives, financial situation, or needs of any specific person who may receive it. Please be aware that past performance is not a reliable indicator of future performance and/or results. Past performance or forward-looking scenarios based upon the reasonable beliefs of the third-party provider are not a guarantee of future performance. Actual results may differ materially from those anticipated in forward-looking or past performance statements. IC Markets makes no representation or warranty and assumes no liability as to the accuracy or completeness of the information provided, nor any loss arising from any investment based on a recommendation, forecast, or any information supplied by any third party

S&P500 Buy Trade Set up
Fundamentals
The S&P 500 continues to be underpinned by a "dovish pivot" from the Federal Reserve. Markets are aiming to stabilise the federal funds rate near 3.0% by late 2026. While the labour market has shown signs of cooling, with unemployment ticking up to 4.6%, corporate earnings remain resilient. The "AI supercycle" remains the primary driver of growth, with mag7 supporting double-digit earnings expansions that help justify elevated valuations.
Technicals
From a technical perspective, the index has shown significant resilience by reclaiming its 50EMA. This move suggests that the trend has shifted back to bullish, as the 50 EMA often acts as a "line in the sand" for institutional buyers. Supporting this price action, the RSI is pointing upward and has successfully crossed above the 50 level.
Strategy
Given the alignment of bullish technical signals and supportive macro conditions, a "buy-the-dip" strategy remains favoured. As the index holds above the 50 EMA, use that level as a tactical floor.
Risk Management
Place stop-loss orders just below the recent swing lows or the 50 EMA.

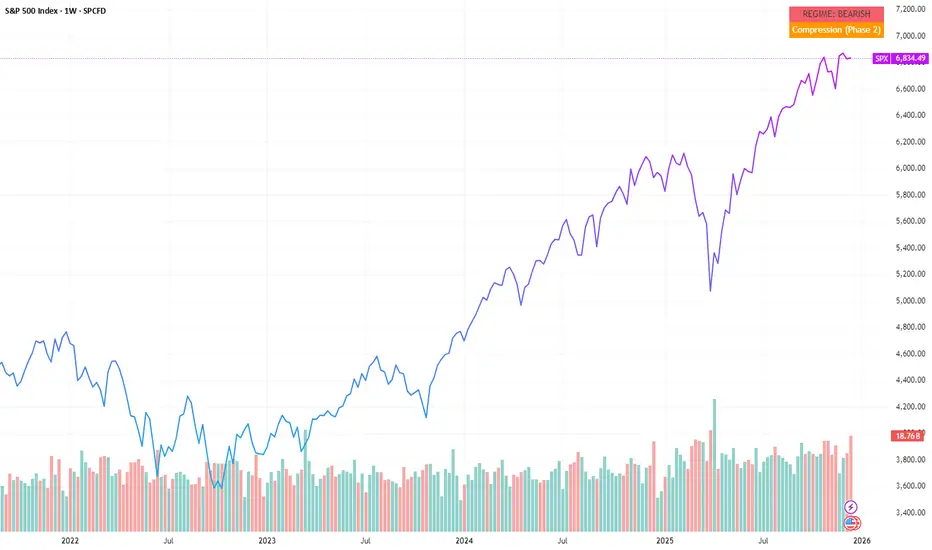
When regime shifts before price reactsOn the SPX weekly chart, price still looks firm, even as the higher-timeframe regime has already turned bearish.
The Free HUD looks past short-term movement and reflects broader context.
Here, that context has changed while price itself has not.
This isn’t a signal.
It isn’t a forecast.
It’s a shift in conditions.
Regime changes often become visible in structure before they show up clearly in price.
Markets can keep moving while internal alignment is already changing.
That disconnect between price and structure becomes easier to see here.
Context before conclusions .
Educational context only. Not financial advice.
S&P 500 4H chart The Executive Summary
The S&P 500 is demonstrating classic institutional strength. We are not just above the trend filter (AVWAP); we are actively holding above the +1 Standard Deviation Band. This signals that buyers are aggressive and willing to pay a premium. The "Value Area" is migrating higher.
The Institutional Data
• Current Price: 6,845.94
• Key Support (+1σ Band): 6,790.32
• Note: Holding above this level confirms a strong momentum trend.
• The "Floor" (POC): 6,656.74
• Note: This is the Point of Control where the most volume was transacted. It is now major support.
• Trend Filter (AVWAP): 6,413.04 (+6.74%)
• Status: Price is well above the institutional average, confirming the uptrend.
• Volatility Bands (Statistical Extremes):
• Upside Target (+2σ): 7,167.60
• Downside Risk: 6,656.74 (POC)
The Narrative: "Acceptance of Premium"
Unlike a mean-reversion market where price snaps back to the middle, this chart shows Trend Continuation.
Price has successfully broken out of the main value cluster (around 6,650) and is now consolidating above the +1σ band (6,790).
When price holds the +1σ line as support, it indicates that institutions are not waiting for "bargains." They are forcing capital into the market (FOMO) to chase performance before the year ends.
The Trade Plan
• 🐂 Bullish Continuation (Primary):
• As long as we hold above 6,790 (+1σ), the path of least resistance is higher.
• We are trading in the "Expansion Channel" between +1σ and +2σ.
• Target: The statistical magnet for this expansion is the +2 Standard Deviation Band at 7,167.60.
• 🐻 Bearish Reversal (Invalidation):
• Watch for a 4H close below 6,790.
• If we lose the +1σ band, the momentum is broken. We would then expect a rotation back down to the Point of Control (POC) at 6,656 to test buyer appetite.
Verdict: The trend is your friend. Do not short the strength until we lose 6,790.

SXP - S&P500 index breakout of long term rising resistance line.Century old S&P500 index rising resistance uptrend line broken to the upside. Previous resistance is confirmed as now support.

SPX for Thursdy December 18thThe latest dump has made it a tad oversold.That does not mean it will get bought.Lets see what happens

SPX Weekly: Bear Trap at 50% lvl or Expansion of Trading Range?Context: The market remains in a dominant tight bull upward trend. Having recently pulled back to test the weekly 20 EMA; The key question now is whether the bulls will aggressively step back in to drive price toward the Measured Move targets, or if the current trading range will resolve into a deeper pullback toward the Monthly 20 EMA.
Expectation: Given the strength of the prior bullish leg, I expect at least a second leg up to test the recent highs. Bulls are currently looking for a firm rejection off the 50% retracement level. Depending on how bearish this weekly bar closes, could potentially trap Double Top BRs.
Bull Case: If we reach the previous highs with strong momentum and follow-through, the trend likely resumes.
Bear Case: If volatility drops and price stalls at the highs, be wary of BRs stepping in leading to a bearish breakout to Monthly 20 EMA.


SP 500 Temporarily BearishThe S&P 500 is currently showing bearish momentum on the H1 timeframe.
Price has moved with sufficient strength that the EMA 50 has entered the Bollinger Band, signaling increasing downside pressure and a stronger bearish continuation.
Target: $6,742.00
This level is derived from a D1 Fibonacci setup, adding higher-timeframe confluence to the downside target.
Bias remains bearish as long as H1 structure and momentum are maintained.

SPX FuelThese combined technical factors typically precede price appreciation in the SP500 , suggesting the index will likely continue to rise shortly based on trend-following and momentum-based trading strategies with limited immediate overbought risk

Bullish on S&P500Looking for a buying opportunity on US500
Reasons; $ sweep yesterday on the daily, has shown signs of Bullish momentum with the impulsive. Yeilds are looking bearish and there's a negative correlation with Stock indicies
Entry model; sweep and tap into OB +FVG
TP 1: 3
Targeting the previous all time high as max TP

SPX 2 day spreadBull put spread
6715 / 6710
$1.25 credit
A BUNCH of support levels here. And 3 selling days in a row...

SPX500 RaceSupport levels from pivot points and multiple moving averages create a technical base that reduces downside risk in the short term.
Volume remains steady, which confirms the reliability of the ongoing trend.
These combined technical factors typically precede price appreciation in the Nasdaq 100 , suggesting the index will likely continue to Declines hortly based on trend-following and momentum-based trading strategies with limited immediate overbought risk.

When the Year Tests You, Remember ThisThis year pushed many traders harder than expected. Some faced drawdowns they had never seen before. Some struggled with discipline . Some questioned their approach entirely. If you felt that weight too, you are not alone.
I also had a rough trading year, i won't hide, i won't pretend. A year that forced me to step back, review everything, and accept that growth in trading rarely comes from the easy seasons. It comes from the difficult ones that expose weaknesses we have ignored for too long.
But here is the part that matters:
You finished the year. You did not quit. You are still in the game.
If this year humbled you, it also trained you.
If it slowed you down, it also made you analyze deeper.
If it broke patterns, it also revealed new ones.
The market does not reward perfection; it rewards persistence, discipline, and continuous improvement.
As we step into a new year:
Tighten your process.
Review your journal.
Remove strategies that drain you.
Keep the ones that align with your psychology.
Trade less, think more, and let the market come to you.
A difficult year does not define you, it prepares you. A better year does not come by chance, it comes by refinement.
Here’s to a new chapter, clearer charts, better discipline, and a stronger you.
Stay focused. Stay consistent. The next 12 months are unwritten.
You get to write them.

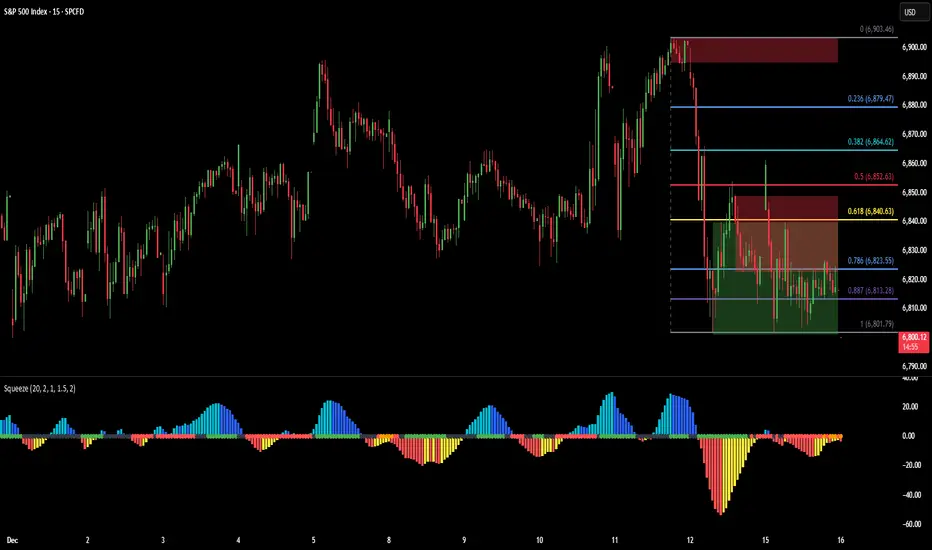
SPX Weekly Market Structure & Volatility ContextIntroduction
This 15-minute SPX chart provides a structural view of price action for December to date, focusing on range behavior, Fibonacci context, supply/demand interaction, and volatility conditions rather than directional prediction.
Prior Week Context
SPX recently completed a sharp downside impulse from the upper end of the monthly range, followed by a retracement and subsequent compression. The prior week produced a wide range expansion, with price failing to sustain acceptance near the highs and rotating lower into value.
Current Fibonacci Framework
The active Fibonacci retracement remains anchored to the most recent impulse leg. Price has been unable to reclaim the 0.618 retracement and is currently accepting between the 0.786 and 0.887 levels, suggesting balance rather than continuation at this stage. This zone represents a decision area where follow-through has diminished.
Supply and Demand Context
Overhead supply remains defined near the upper retracement levels, while demand is present below current price, forming a compressed range. Price is currently oscillating within this structure, consistent with post-impulse digestion rather than trend resolution.
Momentum and Volatility
The squeeze histogram reflects a transition from strong negative momentum into contraction, indicating volatility compression following expansion. This environment typically favors rotational behavior and patience until acceptance or rejection becomes clear.
Structural Takeaway
From a market structure perspective, resolution likely requires either:
Acceptance back above the mid-range retracements, or
Rejection from the current balance area with renewed momentum.
Until then, the chart reflects context and structure, not directional conviction.
The goal is to frame market context first, allowing structure and volatility to define expectations before bias.
This analysis is intended for educational and informational purposes, emphasizing market structure and volatility context rather than trade signals.
Weekly Outlook: XAUUSD, #SP500, #BRENT | 19 December 2025XAUUSD: BUY 4327.20, SL 4300.00, TP 4420.00
Gold enters the week of December 15–19, 2025 near record highs, with prices holding around $4,327 per ounce. The main support comes from expectations of lower US rates following the Federal Reserve’s December rate cut, as well as the market’s sensitivity to any signs of slowing growth. Demand is also reinforced by risk-off sentiment linked to geopolitical tensions and news about broader investor access to gold via funds in major markets.
For the week ahead, the key drivers are fresh US macro data and decisions from leading central banks. If US bond yields and the dollar keep easing, interest in gold is likely to remain strong. A restraining scenario would be the opposite: stronger US data that pushes the dollar and yields higher. In the base case, gold looks resilient, but headline-driven volatility may stay elevated.
Trading recommendation: BUY 4327.20, SL 4300.00, TP 4420.00
#SP500: BUY 6846, SL 6780, TP 7040
US equities start the week with mixed sentiment: after sharp moves in some technology names, investors are becoming more selective, but the broader backdrop remains supportive. S&P 500 futures hover near 6,846, and the focus is on the rate path and the health of the US economy. The recent Fed rate cut helps expectations for lower financing costs and supports risk appetite.
This week’s spotlight is on a heavy central-bank calendar (including Japan, the UK, and the euro area) and key US releases (some statistics are published with delays), which can quickly shift positioning. A constructive scenario for the index is the absence of negative surprises on inflation and jobs alongside expectations of a more accommodative policy stance later on. Risks to the upside include a sudden deterioration in the external backdrop or renewed concerns about stretched valuations in parts of the market.
Trading recommendation: BUY 6846, SL 6780, TP 7040
#BRENT: SELL 61.44, SL 62.10, TP 59.40
Brent opens the week around $61.44 per barrel. In the near term, prices are supported by supply-disruption risks — notably around Venezuela, sanctions constraints, and isolated attacks on oil infrastructure. Such headlines can trigger quick spikes higher even when demand is not particularly strong.
However, fundamentally, the week’s dominant theme is excess supply and rising inventories. A number of international assessments and US outlooks point to a risk of market surplus in 2026 and downside pressure on prices if current production levels persist. In practice, this means rallies may more often meet selling interest, and the market could react sharply to any signals of weaker demand or higher supply. As a result, the baseline bias for the week is mildly negative, with volatility likely to remain elevated.
Trading recommendation: SELL 61.44, SL 62.10, TP 59.40


How To Decide Short Trade In US500 IndexThis video explains how we decide a short trade in the US500 index by observing price behavior and market structure. The analysis focuses on how the US500 reacted from a defined supply zone, how momentum shifted, and what signals indicated a potential downside move. The goal of this breakdown is to show the process of identifying structure, reaction points, and momentum changes using pure price action.
This content highlights how supply zones, rejection behavior, and momentum alignment can help understand possible short-side opportunities—purely from an educational and analytical perspective, without offering any trading advice.

The Bull Is At The Gate, Already!I see lots of liquidity swept last month.
Then, November finishes with this bullish pin-bar.
The momentum remains with bulls.
Fundamentals & divergences in the rhetoric:
Labour market FED says is the weak point in the US economy,
Inflation projected to be tamed even by Tariffs,
* Jobs are created on a strong Stock market, in a lowering interest rate environment.
FED 10th Nov. says January cut unlikely.
But to improve jobs growth & affordability of household expenses for the unemployed / low income people, January cut rhetoric divergence, IE. more chance of occurring supporting stocks.
But and hold investors may be seeing a bottom finally.
Finally, USD is winding back on a bearish MTOP on daily chart which I earlier in the week said could easily retrace at a burst to parity & park at its 200 MA. Causing inflows of safe haven buying.
It didn’t happen with the DXY & is sucked lower opening the gates for GBPUSD, EURUSD & AUSUSD , EURUSD is the bull & let’s see if I’m right and the 1.1920 breakout zone is triggered.
Disclaimer : I’m currently long in EURUSD
and AUDUSD and the S&P, Google & Walmart.
The above is only my interpretation & mistakes can be made. So it’s not investment advice.
Researched & written exclusively by MusicalNight (Chris)

Fed cuts rates. Where do we go next?Rate cut of 25bps as expected but where do we go from here?
The S&P is attempting to break out into new all time highs but as we’ve seen recently, there doesn’t seem to be enough buy side liquidity or buyer conviction to push the market into a new leg up. Until we see a catalyst to take it higher I would expect more chop.

US500: The J-WOW-POWOW — Anatomy of an FOMC ShakeoutThe Market's Breath
The air is thick with anticipation. We stand 90 minutes away from the FOMC decision. The consensus? Rate cuts. The retail sentiment? Euphoria. But the Limitless Trader knows that when the crowd looks up, the smart money is often preparing to pull the rug.
This is what I call the J-WOW-POWOW. A double-edged sword of volatility designed to transfer wealth from the impatient to the strategic.
The Philosophy: Buy the Rumor, Sell the News
Why would the market dump on good news? Because, quite simply, it is already priced in. The charts have been whispering this bullish thesis for weeks. Now that the confirmation is here, it is time for profit-taking.
Let the institutions speak as to where the price will go eventually.
The Setup: The Shakeout & The Reload
We are looking at a classic "Flush and Rush" scenario.
The Short (The Flush): As the news hits, we expect an initial liquidity grab. We are eyeing a rejection around the 6850 region. This is where the bag holders are created—buying the breakout that isn't real.
The Target: We anticipate a swift move down to test the 6670 zone. This is the "shakeout"—clearing the board of weak hands.
The Long (The Reload): Once the dust settles and the tourists have left the casino, we look for the real move. Support at 6670 offers a pristine entry to ride the trend back up toward 6930.
Technical Parameters (Approximations):
Short Play:
Entry: ~6850
Stop Loss: 6930
Take Profit: 6670
Long Play:
Entry: ~6670
Stop Loss: 6585
Take Profit: 6930
I am not your mother or your father. Sit on the sidelines and watch the show, or engage the market with discipline. The choice, and responsibility, is as always, yours.
LET ME EMPHASIZE AGAIN! THIS IS FOR YOU TO EDUCATE YOURSELF. I NEVER COPY TRADE. WHEN YOU COPY TRADE, YOU LACK THE CONVICTION, THE EXPERIENCE, AND THE KNOW-HOW ON MANAGING AN ACTIVE TRADE. NO ONE WILL BE HOLDING YOUR HAND WHILE YOU TRADE.
Disclaimer: This is not financial advice. It is for educational and informational purposes only. Please conduct your own research and manage your risk accordingly.

US500 Awaits Fed Decision Near Record HighThe US500 (S&P 500) hovers just below its record high as market participants anticipate the upcoming monetary policy decision from the Fed. The index's flattening price action reflects a cautious but broadly bullish sentiment.
The US500 last closed near 6,840, losing about 0.1% on the day. This slight movement keeps the index less than 1% below its recent peak near 6,895. Over the 12-month period, the index shows a robust trend, advancing about 13 -14%.
Sentiment remains largely positive, though investors adopt a 'wait-and-see' approach ahead of the imminent Fed meeting. Markets are currently pricing in a high probability of another rate cut. Investor optimism for US equities is at its highest in about 1-year, fuelled by expectations of easier policy and liquidity. However, caution persists due to high valuations and concentration in large cap stocks.
Technically, the US500 remains in an uptrend, trading well above key moving averages. The short-term rally is losing momentum as the price tests the resistance at 6,895. The nearest support is the 6,800-6,815 range.
Consolidating above the 6,800-6,815 support may prompt the US500 to retest the next target at 6,895. Conversely, a break below the 6,800-6,815 range could lead the US500 to test the subsequent support at 6,750.
Analysis by Terence Hove, Senior Financial Markets Strategist at Exness.
