Weekly Outlook: XAUUSD, #SP500, #BRENT | 19 December 2025XAUUSD: BUY 4327.20, SL 4300.00, TP 4420.00
Gold enters the week of December 15–19, 2025 near record highs, with prices holding around $4,327 per ounce. The main support comes from expectations of lower US rates following the Federal Reserve’s December rate cut, as well as the market’s sensitivity to any signs of slowing growth. Demand is also reinforced by risk-off sentiment linked to geopolitical tensions and news about broader investor access to gold via funds in major markets.
For the week ahead, the key drivers are fresh US macro data and decisions from leading central banks. If US bond yields and the dollar keep easing, interest in gold is likely to remain strong. A restraining scenario would be the opposite: stronger US data that pushes the dollar and yields higher. In the base case, gold looks resilient, but headline-driven volatility may stay elevated.
Trading recommendation: BUY 4327.20, SL 4300.00, TP 4420.00
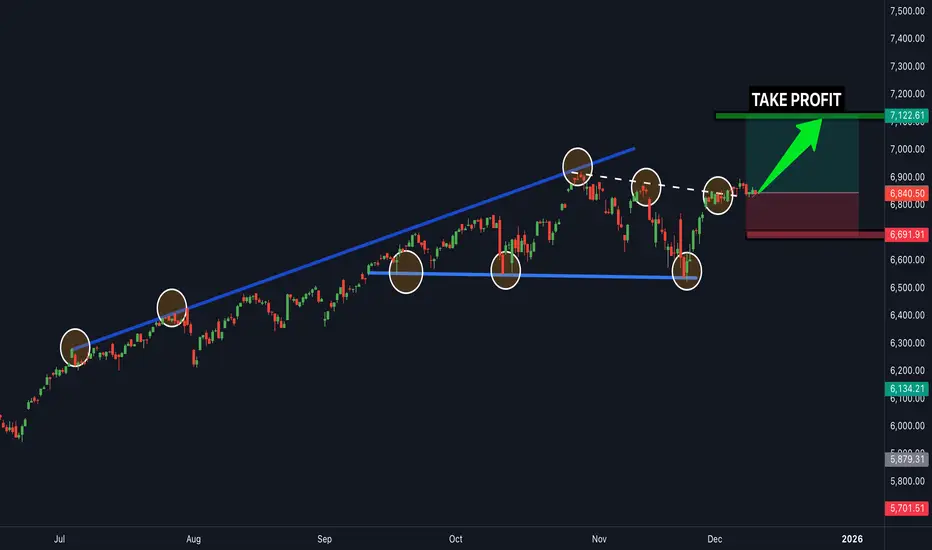
#SP500: BUY 6846, SL 6780, TP 7040
US equities start the week with mixed sentiment: after sharp moves in some technology names, investors are becoming more selective, but the broader backdrop remains supportive. S&P 500 futures hover near 6,846, and the focus is on the rate path and the health of the US economy. The recent Fed rate cut helps expectations for lower financing costs and supports risk appetite.
This week’s spotlight is on a heavy central-bank calendar (including Japan, the UK, and the euro area) and key US releases (some statistics are published with delays), which can quickly shift positioning. A constructive scenario for the index is the absence of negative surprises on inflation and jobs alongside expectations of a more accommodative policy stance later on. Risks to the upside include a sudden deterioration in the external backdrop or renewed concerns about stretched valuations in parts of the market.
Trading recommendation: BUY 6846, SL 6780, TP 7040
#BRENT: SELL 61.44, SL 62.10, TP 59.40
Brent opens the week around $61.44 per barrel. In the near term, prices are supported by supply-disruption risks — notably around Venezuela, sanctions constraints, and isolated attacks on oil infrastructure. Such headlines can trigger quick spikes higher even when demand is not particularly strong.
However, fundamentally, the week’s dominant theme is excess supply and rising inventories. A number of international assessments and US outlooks point to a risk of market surplus in 2026 and downside pressure on prices if current production levels persist. In practice, this means rallies may more often meet selling interest, and the market could react sharply to any signals of weaker demand or higher supply. As a result, the baseline bias for the week is mildly negative, with volatility likely to remain elevated.
Trading recommendation: SELL 61.44, SL 62.10, TP 59.40
Market insights

US500 Price Map. Will Buyers Defend Key Layers Toward 7000?📊 US500/SPX500 Bullish Swing Trade Strategy | Professional Analysis 🚀
Current Price: $6,870.40 | Status: Bullish Momentum Building 🔥
🎯 TRADE OVERVIEW
Asset: US500 / SPX500 Index
Timeframe: DAY/SWING TRADE (Perfect for Active Traders)
Market Condition: BULLISH 📈
Risk Level: Calculated & Managed ✅
💡 WHY THIS SETUP WORKS
The SPX500 is trading near 52-week highs ($6,920.34), with technical indicators showing Strong Buy signals on daily timeframes. Market sentiment remains constructive with potential for mean reversion plays and breakout opportunities. The index has strong institutional support and is consolidating before the next leg up.
🎲 ENTRY STRATEGY: LAYERED APPROACH (THIEF STRATEGY)
Best Practice Approach: Use MULTIPLE LIMIT ORDERS at different price levels for optimal risk management.
Entry Layers - Place These Simultaneously:
Layer 1 - 6,800 (Low Risk Entry)
This is your first position entry at the strong support zone. This layer captures traders looking for early bounces and reduces your average entry cost significantly. Perfect for conservative traders who want maximum confirmation before committing capital.
Layer 2 - 6,825 (Medium Risk Entry)
This second layer adds confirmation as price moves higher. This is where momentum traders jump in. By staggering entries here, you're catching the middle ground between aggressive and conservative positions, giving you excellent risk-reward setup.
Layer 3 - 6,850 (Aggressive Breakout Entry)
This final layer targets breakout traders who wait for price confirmation. Use this only if you have capital left and see strong volume confirmation. This is your most aggressive entry but has the strongest conviction signal.
✅ Pro Tip: You can add MORE layers based on your risk tolerance & account size. Start small, build positions gradually. Never go all-in on one layer!
Why Layering Works 🎯
Layering is the professional way to build positions because it reduces average entry cost, protects against sudden whipsaws, captures multiple entry opportunities, and significantly increases your overall success probability. Instead of being wrong on one entry, you have three chances to be right!
🛑 STOP LOSS (SL): THIEF OG PROTECTION
SL Level: 6,750
Risk Zone: Below support level
This stop loss level protects you from breaking below a critical support zone. If price closes below 6,750, the bullish thesis is broken and you should exit to preserve capital.
📌 IMPORTANT DISCLAIMER:
⚠️ You are NOT required to use our suggested SL
⚠️ Adjust based on YOUR strategy & risk management rules
⚠️ YOUR MONEY = YOUR RULES | Trade with capital you can afford to lose
SL Management Tips:
Place your stop loss below key support levels that make sense with your trading strategy. Once you're in profit (usually +2% on SPX), consider moving your stop to breakeven so you're trading with house money. After solid confirmation and +3-5% profit, use trailing stops to let winners run. Most importantly, never risk more than 2-3% of your total account on a single trade.
🎁 PROFIT TARGET (TP): RESISTANCE CONFLUENCE
Primary Target: 7,000
Reasoning: Strong Resistance + Overbought Zone + Technical Trap Pattern
The 7,000 level represents a major psychological resistance and technical confluence where multiple indicators suggest profit-taking is likely. This is where smart money typically exits positions. The confluence of strong resistance levels, overbought RSI readings, and technical trap pattern all converge at this critical level, making it the ideal exit point for capturing the full move while protecting profits.
📌 CRITICAL NOTICE:
⚠️ Use YOUR OWN profit targets based on risk/reward ratio
⚠️ This is a SUGGESTED level only
⚠️ Protect Your Profits: Lock in gains before pullbacks
Exit Strategy:
Watch for volume divergence signals where price moves higher but volume decreases - this is a classic warning sign. Monitor RSI levels above 70, which indicate overbought conditions and potential reversals. Track support and resistance breaks throughout the move. Most importantly, don't be greedy. If you've hit your profit target, take it and move on. The best traders know when to say "I'm done for the day."
📍 RELATED PAIRS TO MONITOR (CORRELATION ANALYSIS)
Strong Positive Correlation 🔗
NASDAQ-100 (NQ100/COMP) - Correlation: +0.92
This is your tech-heavy index and moves almost in lockstep with US500. Why watch this? Because tech drives the market. If NASDAQ is weak while SPX is strong, watch out for sector rotation. The NASDAQ-100 currently sits at 25,692. If SPX breaks 7,000, expect NASDAQ targets of 26,500+ based on historical correlation patterns. This pair move confirms the strength of the rally.
DJIA (US30/Dow Jones) - Correlation: +0.89
The Dow Jones is your large-cap indicator. These are the blue-chip stocks. At 47,955, the Dow tends to lag SPX on rallies but confirms the trend strength. If Dow is not participating in SPX strength, it signals rotation OUT of mega-caps into mid-caps. Watch for this divergence as a warning signal.
Russell 2000 (RUT) - Correlation: +0.78
Small-cap participation is crucial. A weak Russell 2000 during SPX strength means only mega-caps are rallying. This is a RED FLAG for sustainability. If Russell is strong with SPX, the rally is broad-based and likely to continue. If Russell is weak, we're in a narrow rally that can reverse quickly.
Inverse Correlation (Risk Hedge) 🛡️
VIX (Volatility Index) - Correlation: -0.85
Currently at 15.41, this low volatility reading screams "risk-on" environment. Traders are comfortable, fear is low. But remember, VIX can spike suddenly. If VIX jumps above 20, consider taking profits and reducing exposure. A VIX spike signals institutional selling and risk-off sentiment.
US DOLLAR (DXY) - Correlation: -0.72
Trading at 98.97, a weak dollar SUPPORTS equities because US companies make more money when the dollar is weak (exports become cheaper). If the dollar strengthens suddenly, expect SPX pressure. Monitor Fed policy announcements that impact currency valuations - they directly impact your equity trades!
Sector Rotations to Track 💼
Tech Giants Matter:
NVIDIA (NVDA) at $182.41 is down -0.53% but still critical. This is THE stock to watch. If NVDA collapses, the entire rally is in question. NVIDIA is your AI barometer.
Meta Platforms (META) at $673.42 is up +1.80% and showing strength. This mega-cap strength confirms institutional confidence in the rally. When META leads, the market is feeling risk-on.
Microsoft (MSFT) at $483.16 is stable at +0.48%. This is your stability indicator. If MSFT can't go higher with SPX, it's a divergence warning.
Apple (AAPL) should be monitored for consumer health signals. Any weakness in AAPL suggests consumer spending concerns ahead.
🔍 TECHNICAL CONFIRMATION CHECKLIST
✅ Daily Chart: STRONG BUY - Moving Averages perfectly aligned in uptrend
✅ Weekly Chart: STRONG BUY - Macro uptrend completely intact, higher lows confirmed
✅ RSI: Not Yet Overbought - Means room to run before pullback expected
✅ MACD: Bullish Crossover Confirmed - Momentum indicator flashing green light
✅ Volume Profile: Good Distribution - Buying happening at higher price levels, not just sharp spikes
✅ Sentiment: Institutional Buying - Big money is flowing into SPX, not retail FOMO
This checklist confirms the setup is solid for the bullish premise. All signals are aligned, which means the probability is in your favor.
⚡ TRADER RULES & DISCLAIMERS
🎯 Golden Rules for This Trade:
Rule 1 - Only Risk What You Can Afford to Lose 💰
Don't use your rent money. Don't risk your emergency fund. Only trade capital that won't hurt your life if you lose it. This removes emotion from decision-making.
Rule 2 - Respect Your Stop Loss
No exceptions. Ever. A stop loss is not a suggestion - it's your insurance policy. Hit it and move on without hesitation. The traders who don't respect stops are the traders who blow up their accounts.
Rule 3 - Scale In and Out
Don't FOMO all-in on one entry. Build positions gradually with the three layers. Exit gradually with the three targets. This removes emotion and improves results dramatically.
Rule 4 - Lock Profits Before Pullbacks
Let winners run but protect gains. Your first 30% profit at 6,900 is EARNED. Take it. You only regret profits you didn't take.
Rule 5 - Track Correlations
Watch related pairs for divergence. If SPX goes up but NASDAQ goes down, something is wrong. Exit first, ask questions later.
Rule 6 - Use Alerts - Don't Stare at Screens 24/7
Set price alerts on TradingView. Let technology do the work. You have a life outside trading. Check alerts a few times per day.
Important Notices ⚠️
📋 This is TECHNICAL ANALYSIS ONLY - Not financial advice
🔒 NOT a recommendation to buy or sell
💡 Use this framework with YOUR OWN analysis - Don't blindly follow
🎓 Paper trade first if you're testing this strategy - Practice before risking real money
📊 Past performance ≠ Future results - Markets change constantly
💪 TRADER PSYCHOLOGY EDGE
Set your entries BEFORE market opens. Don't make emotional decisions when the market is moving fast. Your exit plan matters more than your entry plan. Where you exit determines your profit, not where you enter. Profits are made on discipline, not on aggression. The patient traders dominate the impatient ones.
One good trade beats ten desperate ones. Never try to "make back" losses with revenge trading. The best traders know when to step away from the market and recharge their minds.
🚀 ENGAGEMENT BOOSTERS FOR LIKES & VIEWS
If This Resonates:
👍 Like if you trade US500 index regularly
💬 Comment your entry price and targets
⭐ Bookmark this for your personal watchlist
🔔 Follow for daily swing trade setups and analysis
Share Your Thoughts:
"What's YOUR target on SPX? Comment below! 👇 Are you taking this trade or waiting for confirmation?"
"Have you tried the layered entry method? Tell me your experience in the comments!"

The Trading Range is about to be testedTomorrow we should see all time highs, but I'm thinking it will not stick and so the trading range play may be in effect. Vix also about to test it's previous channel under 14. Gold, possibly a false breakout, seems to be following the general market. Oil may have bottomed, but nothing definitive. Nat Gas is very oversold, but should eventually go lower.


How To Decide Short Trade In US500 IndexThis video explains how we decide a short trade in the US500 index by observing price behavior and market structure. The analysis focuses on how the US500 reacted from a defined supply zone, how momentum shifted, and what signals indicated a potential downside move. The goal of this breakdown is to show the process of identifying structure, reaction points, and momentum changes using pure price action.
This content highlights how supply zones, rejection behavior, and momentum alignment can help understand possible short-side opportunities—purely from an educational and analytical perspective, without offering any trading advice.

The Bull Is At The Gate, Already!I see lots of liquidity swept last month.
Then, November finishes with this bullish pin-bar.
The momentum remains with bulls.
Fundamentals & divergences in the rhetoric:
Labour market FED says is the weak point in the US economy,
Inflation projected to be tamed even by Tariffs,
* Jobs are created on a strong Stock market, in a lowering interest rate environment.
FED 10th Nov. says January cut unlikely.
But to improve jobs growth & affordability of household expenses for the unemployed / low income people, January cut rhetoric divergence, IE. more chance of occurring supporting stocks.
But and hold investors may be seeing a bottom finally.
Finally, USD is winding back on a bearish MTOP on daily chart which I earlier in the week said could easily retrace at a burst to parity & park at its 200 MA. Causing inflows of safe haven buying.
It didn’t happen with the DXY & is sucked lower opening the gates for GBPUSD, EURUSD & AUSUSD , EURUSD is the bull & let’s see if I’m right and the 1.1920 breakout zone is triggered.
Disclaimer : I’m currently long in EURUSD
and AUDUSD and the S&P, Google & Walmart.
The above is only my interpretation & mistakes can be made. So it’s not investment advice.
Researched & written exclusively by MusicalNight (Chris)

Fed cuts rates. Where do we go next?Rate cut of 25bps as expected but where do we go from here?
The S&P is attempting to break out into new all time highs but as we’ve seen recently, there doesn’t seem to be enough buy side liquidity or buyer conviction to push the market into a new leg up. Until we see a catalyst to take it higher I would expect more chop.

US500: The J-WOW-POWOW — Anatomy of an FOMC ShakeoutThe Market's Breath
The air is thick with anticipation. We stand 90 minutes away from the FOMC decision. The consensus? Rate cuts. The retail sentiment? Euphoria. But the Limitless Trader knows that when the crowd looks up, the smart money is often preparing to pull the rug.
This is what I call the J-WOW-POWOW. A double-edged sword of volatility designed to transfer wealth from the impatient to the strategic.
The Philosophy: Buy the Rumor, Sell the News
Why would the market dump on good news? Because, quite simply, it is already priced in. The charts have been whispering this bullish thesis for weeks. Now that the confirmation is here, it is time for profit-taking.
Let the institutions speak as to where the price will go eventually.
The Setup: The Shakeout & The Reload
We are looking at a classic "Flush and Rush" scenario.
The Short (The Flush): As the news hits, we expect an initial liquidity grab. We are eyeing a rejection around the 6850 region. This is where the bag holders are created—buying the breakout that isn't real.
The Target: We anticipate a swift move down to test the 6670 zone. This is the "shakeout"—clearing the board of weak hands.
The Long (The Reload): Once the dust settles and the tourists have left the casino, we look for the real move. Support at 6670 offers a pristine entry to ride the trend back up toward 6930.
Technical Parameters (Approximations):
Short Play:
Entry: ~6850
Stop Loss: 6930
Take Profit: 6670
Long Play:
Entry: ~6670
Stop Loss: 6585
Take Profit: 6930
I am not your mother or your father. Sit on the sidelines and watch the show, or engage the market with discipline. The choice, and responsibility, is as always, yours.
LET ME EMPHASIZE AGAIN! THIS IS FOR YOU TO EDUCATE YOURSELF. I NEVER COPY TRADE. WHEN YOU COPY TRADE, YOU LACK THE CONVICTION, THE EXPERIENCE, AND THE KNOW-HOW ON MANAGING AN ACTIVE TRADE. NO ONE WILL BE HOLDING YOUR HAND WHILE YOU TRADE.
Disclaimer: This is not financial advice. It is for educational and informational purposes only. Please conduct your own research and manage your risk accordingly.

US500 Awaits Fed Decision Near Record HighThe US500 (S&P 500) hovers just below its record high as market participants anticipate the upcoming monetary policy decision from the Fed. The index's flattening price action reflects a cautious but broadly bullish sentiment.
The US500 last closed near 6,840, losing about 0.1% on the day. This slight movement keeps the index less than 1% below its recent peak near 6,895. Over the 12-month period, the index shows a robust trend, advancing about 13 -14%.
Sentiment remains largely positive, though investors adopt a 'wait-and-see' approach ahead of the imminent Fed meeting. Markets are currently pricing in a high probability of another rate cut. Investor optimism for US equities is at its highest in about 1-year, fuelled by expectations of easier policy and liquidity. However, caution persists due to high valuations and concentration in large cap stocks.
Technically, the US500 remains in an uptrend, trading well above key moving averages. The short-term rally is losing momentum as the price tests the resistance at 6,895. The nearest support is the 6,800-6,815 range.
Consolidating above the 6,800-6,815 support may prompt the US500 to retest the next target at 6,895. Conversely, a break below the 6,800-6,815 range could lead the US500 to test the subsequent support at 6,750.
Analysis by Terence Hove, Senior Financial Markets Strategist at Exness.

BUY SPX NOW...time to buySPX 500 is in a clear upwards channel and has broken the last bit of resistance (white trendline line shown) - this is a clear confirmation that the next target will be the next resistance zone to the upside shown above (this is a great buy trade opportunity) - Time to buy the SPX 500 now
S&P 500 Index: Chart Analysis Ahead of Fed NewsS&P 500 Index: Chart Analysis Ahead of Fed News
On 2 December, we noted that the final month of the year is traditionally favourable for the S&P 500 index, as:
→ since around the 1950s, December has been positive in more than 70% of cases;
→ the average monthly gain is approximately +1.0%.
Today, with traders worldwide focused on the Federal Reserve’s interest rate decision and Chair Powell’s subsequent press conference, there is reason to highlight another statistic. According to media reports, in 20 out of 20 instances when equity markets were near record highs and the Fed cut rates, the S&P 500 rose over the following 12 months.
Given the current backdrop — proximity to all-time highs and expectations of rate cuts — it is possible that this could become the 21st such case.
An analysis of price action on the 4-hour chart of the S&P 500 suggests that the stock market is reflecting nervous anticipation of the news, as the index is trading at roughly the same levels as at the start of December.
Technical Analysis of the S&P 500 Chart
From the demand side:
→ the price has managed to hold firmly above the 6785 level (which may act as support going forward) and has broken above a previously formed descending channel (shown in red);
→ an ascending channel formed in early December, which can be interpreted as cautious optimism ahead of the news.
From the supply side:
→ the late-October record high may act as psychological resistance;
→ yesterday’s decline (indicated by the arrow) suggests that bears are ready to act more aggressively if given a catalyst.
Overall, taking the above into account, it is reasonable to suggest that the S&P 500 market is in a “calm before the storm” phase. Be prepared for volatility spikes later today, starting from 22:00 GMT+3.
This article represents the opinion of the Companies operating under the FXOpen brand only. It is not to be construed as an offer, solicitation, or recommendation with respect to products and services provided by the Companies operating under the FXOpen brand, nor is it to be considered financial advice.

The Bear sneak attackIt's possible with everyone waiting for the Fed tomorrow that we sell off today and convince the majority that the fed will save the market Wednesday. Maybe that's true, maybe not. Vix is showing a clear breakout and the next target is likely 20. Gold still looks bullish and probably tests it's high. BTC looks bearish. USoil looks bearish. NAT gas bearish.

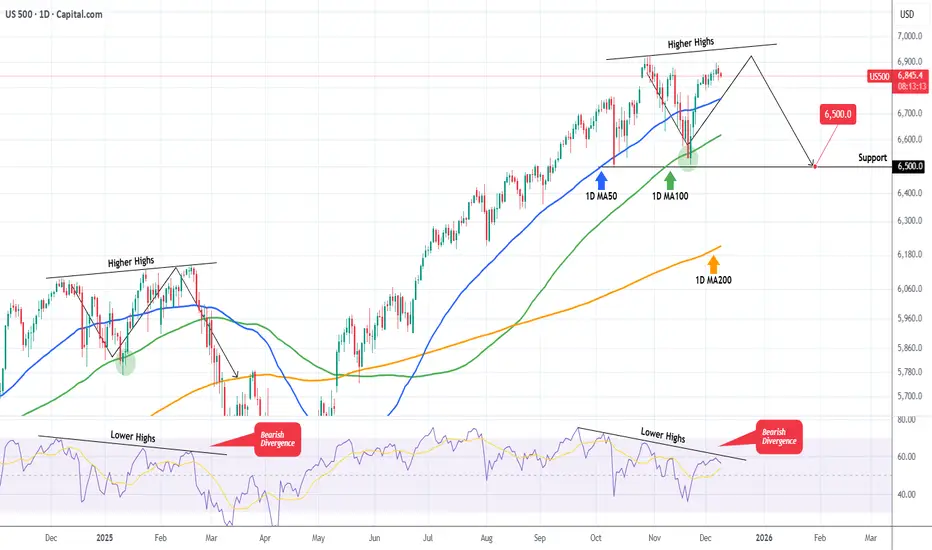
S&P500 The Bearish Divergence that may spoil the party.S&P500 (SPX) is extending a strong rally following the rebound on its 1D MA100 (green trend-line) almost 3 weeks ago. As we pointed out in a previous analysis, the price action of the past 2 months has been identical to the pattern after November 19 2024.
We are currently on the same 1D MA100 rebound towards the Higher Highs trend-line but the key development is that the 1D RSI on both fractals shows a huge Bearish Divergence, being on Lower Highs.
In February 2025 that led to the start of a strong correction in the stock markets. So as long as the 1D RSI Bearish Divergence holds, the S&P500 currently risks a technical correction towards at least the first Support level of 6500.
---
** Please LIKE 👍, FOLLOW ✅, SHARE 🙌 and COMMENT ✍ if you enjoy this idea! Also share your ideas and charts in the comments section below! This is best way to keep it relevant, support us, keep the content here free and allow the idea to reach as many people as possible. **
---
💸💸💸💸💸💸
👇 👇 👇 👇 👇 👇
S&P500 pullback as inflation risks remain tilted to the upsideThe S&P 500 fell 0.35%, snapping a four-day winning streak, as hawkish ECB commentary from Isabel Schnabel pushed global yields higher and weighed on risk appetite. Schnabel signalled comfort with expectations for another rate hike, warned that inflation risks remain tilted to the upside, and suggested the neutral rate may be rising due to AI and public investment. In response, euro overnight index swaps for Dec-2026 rose 8bps, contributing to the broader risk-off tone.
Equity losses in the US were broad-based, with 10 of 11 sectors lower, led by communication services (-1.77%) and materials (-1.66%). The Magnificent 7 fell 0.91% for its worst session in over two weeks, although semiconductors outperformed, helped by Nvidia (+1.72%). Despite the decline, the index remains less than 1% below its late-October record high, but momentum clearly cooled as yields climbed.
In after-hours trade, Nvidia gained a further ~2% after Donald Trump approved sales of its H200 AI chip to China, subject to a 25% government surcharge and sales only to “approved customers”—a potentially significant earnings tailwind if Chinese buyers are ultimately permitted to proceed.
This communication is for informational purposes only and should not be viewed as any form of recommendation as to a particular course of action or as investment advice. It is not intended as an offer or solicitation for the purchase or sale of any financial instrument or as an official confirmation of any transaction. Opinions, estimates and assumptions expressed herein are made as of the date of this communication and are subject to change without notice. This communication has been prepared based upon information, including market prices, data and other information, believed to be reliable; however, Trade Nation does not warrant its completeness or accuracy. All market prices and market data contained in or attached to this communication are indicative and subject to change without notice.

S&P 500 BUY | LONG TERMGreetings,
Looking for a reversal to sell and buy in long term.
Cheers,
Dikorocz

SPX500 | Markets Position Ahead of JOLTS & Fed DecisionSPX500 – Technical Overview
S&P 500 futures edged higher ahead of the JOLTS job openings report, the final major labor indicator before the Federal Reserve decides on interest rates tomorrow.
Markets are pricing an 89% probability of a 25 bps rate cut, suggesting strong expectations for policy easing.
Nvidia is also in focus as traders monitor tech-sector momentum and its influence on index direction.
Technical Analysis
SPX500 holds bearish momentum for today while trading below the 6873–6888 zone.
A deeper bearish continuation is likely below 6852, with downside targets at 6815 and 6798.
On the upside, a 1H or 4H close above 6888 would invalidate the bearish setup and shift momentum toward the ATH levels at 6918, with extended potential toward 6990.
Key Levels
Pivot Line: 6860
Support: 6837 · 6818 · 6798
Resistance: 6873 · 6888 · 6918


SPX selloff could have just begunRising Japanese 10Y bond yield will reverse the carry trade of borrowing in JPY and investing in other higher yielding assets in other countries. With Japan inflation on the rise and BOJ cornered by very high debt/gdp their ability to keep buying government debt could be limited.
Also long term cycle of Japan225 supports this idea
Since GFC all the central banks, mainly the USA FED have been supporting the markets by QE and the governments racking up massive debt to mitigate one crisis after another.
Have you wondered, if all the government are in debt, who is buying these debts? Well, its asset management firms like Blackrock and others using your pension and super funds to invest in these debts. In other words when you take a mortgage on your house you are staking your current and future savings, without you knowing it. Ha. Ha. Your mortgage is repackaged by your bank and sold to these funds, who use your super and pension as MARGIN money!!! That is why you are now allowed to use your super to borrow by law, because that right is given to your fund managers

$SPX is showing short-term weakness as price pressesCheck Bear-flag thesis from :
Dec 3
Dec 2
Nov 21
Nov 17
SPX is showing short-term weakness as price presses directly against the lower rail of the 1H rising channel. The dotted midline was lost earlier in the week, and repeated rejections there have kept the index operating in the weaker half of the structure. Candle flow has formed a clear sequence of lower highs, and prior micro-support around 6840–6860 is no longer being defended. EMA/VWAP clusters are stacked overhead, adding downward pressure. The broader channel remains intact, but short-term structure continues to lean bearish unless buyers can reclaim midline strength.
Upside invalidation is clean: bulls must break above 6,885–6,900 with strength and reclaim the ATH zone from inside, not just touch it.
Until that happens, rallies into channel mid or top = short opportunities.
Bearish Bias | Watch 6,840 | Bear Flag Until Proven Otherwise
#SPX #S&P500 SP:SPX TVC:SPX CBOE:SPX #SP500 #BearFlag

Gold, S&P500 and their ratioThis shows two previous instances of long term gold bull vs S&P stalled sideways, during a decade in both instances, while Gold enjoyed great bull markets.
The ratio got down to 0.65 and 0.30 previously, while now it's still much higher 1.63. So this shows Gold could still have much upside (and S&P much sideways action) if history repeats.
Of course it's impossible to predict when this will happen, but now it still seems like a great time to hold gold as a diversifier against stocks.

BUY SPX NOW...time to buy nowSPX 500 is in a clear upwards channel and has broken the last bit of resistance (white trendline line shown) - this is a clear confirmation that the next target will be the next resistance zone to the upside shown above (this is a great buy trade opportunity) - Time to buy SPX 500

Global Trade and Its Impact: A Comprehensive AnalysisEconomic Impacts of Global Trade
At the core, global trade acts as a catalyst for economic growth. By allowing countries to specialize in the production of goods and services where they have a comparative advantage, trade promotes efficiency and productivity. For instance, countries with abundant natural resources can focus on extraction and export, while those with advanced manufacturing capabilities concentrate on producing high-value goods. This specialization leads to lower production costs, greater product variety, and higher overall economic output.
Trade also contributes to economic diversification. For developing countries, exporting a range of goods reduces reliance on a single sector and mitigates economic risks associated with commodity price fluctuations. For developed economies, imports provide access to raw materials, advanced technologies, and cheaper consumer goods, enhancing competitiveness. Moreover, global trade stimulates foreign direct investment (FDI), as companies establish operations abroad to access new markets, which, in turn, creates jobs and fosters economic development.
However, the economic impact of trade is not uniformly positive. While aggregate national income may rise, certain sectors and communities may face disruptions. Industries unable to compete with imported goods may decline, leading to unemployment and regional economic disparities. Additionally, excessive dependence on global markets can expose countries to external shocks, such as global recessions or supply chain disruptions, as witnessed during the COVID-19 pandemic.
Social and Labor Impacts
Global trade significantly influences labor markets and societal structures. By opening new markets and stimulating economic growth, trade creates employment opportunities across sectors. Export-oriented industries often provide higher wages and skill development opportunities. International companies operating in multiple countries also contribute to knowledge transfer, training local workforces, and raising labor standards.
On the other hand, trade can exacerbate social inequalities. Workers in industries exposed to international competition may face wage stagnation or job losses. The shift of manufacturing to countries with lower labor costs, often called “offshoring,” has led to declining industrial employment in certain developed economies, causing social and political tensions. In developing nations, while trade can lift millions out of poverty, it may also lead to exploitative labor practices if regulatory frameworks are weak.
Global trade also fosters cultural exchange. Exposure to foreign goods, services, and media enables the spread of ideas, lifestyles, and technologies, influencing societal values and consumption patterns. While this cultural interconnection promotes understanding and innovation, it may also challenge local traditions and cultural identities, leading to debates over cultural homogenization.
Technological and Innovation Impacts
One of the less immediately visible but highly transformative impacts of global trade is technological advancement. Trade encourages competition, compelling firms to innovate to maintain market share. Access to international markets allows companies to scale up production, invest in research and development, and adopt best practices from other countries. Technology transfer often accompanies trade, as multinational corporations introduce advanced processes, machinery, and management practices to host countries.
For example, the proliferation of information and communication technologies (ICT) in developing countries has been facilitated by global trade, enabling digital services, e-commerce, and global connectivity. Furthermore, trade in high-tech goods, such as semiconductors, medical equipment, and renewable energy technology, accelerates the diffusion of innovation globally, contributing to economic development and environmental sustainability.
Environmental Impacts
While global trade boosts economic growth, it also has environmental consequences. Increased production and transportation of goods contribute to carbon emissions, resource depletion, and ecological degradation. The demand for agricultural products, minerals, and manufactured goods often leads to deforestation, overfishing, and industrial pollution. Moreover, the carbon footprint associated with global supply chains has become a pressing concern, prompting discussions on “green trade” and sustainable practices.
On the positive side, trade can facilitate the dissemination of environmentally friendly technologies. Countries can import renewable energy equipment, pollution-control technologies, and sustainable agricultural practices, helping to mitigate environmental challenges. International agreements and trade policies increasingly incorporate environmental standards, promoting responsible trade practices that balance economic growth with ecological preservation.
Geopolitical and Strategic Impacts
Global trade is closely linked to geopolitics. Countries that dominate trade in critical goods, such as energy, rare minerals, and advanced technology, wield significant strategic influence. Trade relationships can foster diplomatic cooperation, strengthen alliances, and reduce the likelihood of conflict by creating mutual economic dependencies. Conversely, trade disputes, tariffs, and sanctions can become tools of geopolitical leverage, shaping international relations.
Trade also contributes to regional integration. Organizations like the European Union, ASEAN, and NAFTA (now USMCA) exemplify how trade can promote regional stability, harmonize regulations, and create large economic blocs capable of influencing global markets. However, overreliance on a few trading partners can increase vulnerability to political and economic pressures, highlighting the need for diversified trade strategies.
Globalization, Inequality, and Policy Challenges
Global trade is a driving force behind globalization, connecting economies, societies, and cultures. It has lifted millions out of poverty, expanded consumer choice, and spurred innovation. However, it has also intensified inequality, both within and between nations. Wealthier countries and multinational corporations often capture the lion’s share of trade benefits, while poorer nations may struggle to move up the value chain.
Policymakers face the challenge of maximizing trade benefits while mitigating negative impacts. Trade agreements, tariffs, and subsidies must be designed to protect vulnerable industries and labor forces. Social safety nets, skills training, and investment in infrastructure are essential to ensure that trade-driven growth is inclusive. Furthermore, international cooperation is critical to addressing environmental impacts, labor standards, and fair competition.
Conclusion
In summary, global trade is a double-edged sword with profound and multifaceted impacts. Economically, it promotes growth, efficiency, and diversification, but can disrupt local industries. Socially, it generates jobs and facilitates cultural exchange, yet can exacerbate inequality. Technologically, trade drives innovation and knowledge transfer, while environmentally, it poses both challenges and opportunities. Geopolitically, trade shapes alliances, strategic dependencies, and regional integration.
The ultimate impact of global trade depends on the policies, governance, and strategies implemented by nations. When managed effectively, trade can be a powerful engine for sustainable development, economic prosperity, and international cooperation. Conversely, neglecting its social, environmental, and political dimensions can exacerbate inequality, environmental degradation, and geopolitical tensions. As the world continues to navigate the complexities of globalization, understanding and leveraging the impact of global trade remains essential for shaping a more equitable and prosperous future.
SPX: Fed will decide on SPX next move The inflation data, as posted through the PCE Price Index on Friday, was in the focus of markets during the previous week. This data came just a week before the FOMC meeting, scheduled for December 10th, increasing odds that Fed might cut interest rates by another 25 basis points. The PCE of 2,8% y/y in September was just a bit lower from anticipated 2,9%. In addition, Friday brought University of Michigan Consumer Sentiment for December, exposing decreased inflator expectations for both near and long term. The CME FedWatch Tool is now posting around 87% odds for a 25bps rate cut in December. On the other hand, analysts are noting that the market has already priced this cut, so the main current question is what is next for the US economy?
The S&P 500 continued its winning streak during the previous week. The index has closed the week at the level of 6.870, after previously reaching the weekly high at 6.893. The biggest weekly surprise came from Netflix, who agreed to buy Warner Bros.’ key studio and streaming assets, including HBO/HBO Max and major film-/TV-studio operations, in a deal valued at around $83 billion (equity value about $72 billion). The deal must clear regulatory review, and sources say the Trump administration views the merger “with heavy scepticism,” signalling a potentially difficult approval process under U.S. antitrust scrutiny.
Tech companies continue to dominate markets, however, Nvidia continues to struggle to gain momentum. The week ahead is promising to be a volatile one, considering the FOMC meeting, scheduled for Wednesday, December 10th. As analysts are noting, the market has already priced the 25bps rate cut. In case of any surprises on this side, a significant market correction might be triggered. In case of a rate cut, the markets might continue to price US equities at higher grounds.
