Crude oil is entering the seasonal growth windowCrude oil had tested the lower band of the Bollinger Bands indicator on the daily chart. Being a momentum instrument, it has a chance of testing the area below the previous intermediate-term low (testing 52-55k area), after which the price may turn back to $60: the fair price according to the STEO forecast from eia.gov
As WTI oil is entering the seasonal window of growth, so we can assume the mean-reversion scenario to dominate in the near future, especially considering the improving market sentiment.
Don't forget - this is just the idea, always do your own research and never forget to manage your risk!
USCRUDEOILCFD trade ideas

OILOil is losing its short-term trend line, and if this happens, it will have a cell and sell until the next trendline.

Energy is life: tailwind for the global economy?Oil prices in gold in a clear down trend, presumably on the back of increased shale production and greater renewables, and resurgence of nuclear. Unless demand accelerates (AI? middle class growth in India?), this is very supportive of economic growth.

USOIL UPDATEHello friends
Given the recent growth in oil prices, it is natural for the price to correct. Now we have obtained the most important price support areas for you and we have also specified the target. If you are willing to enter the transaction, be sure to observe capital management.
*Trade safely with us*

Oil on high time frame
"Regarding WTI oil, the price trend on high time frames is bearish, especially on the daily chart. After completing its pullback on the 4-hour chart, there are indications of further downside potential.
The market's volatility may be influenced by geopolitical tensions and political factors between Iran and the USA, as well as tariff issues. Despite these fluctuations, candle formations suggest the potential for prices to drop towards the $58 zone."
If you require more assistance or have any specific questions, feel free to ask!

Crude Oil's Bearish Trend Continues: Intraday Trading StrategiesDuring the US trading session on Monday, crude oil recovered part of the losses from the sharp decline at the opening of this week. Previously, OPEC+ unexpectedly increased production again, causing crude oil to continue the bearish trend that has been gradually taking shape since March.
Today, the price of crude oil first rose and then fell. After hitting a new low, the upward trend continued, but when it reached around $57.7, it encountered significant resistance. Looking ahead, it is expected that crude oil will experience an oscillation phase first, and then continue its downward trend.
Currently, crude oil is still in a bear - dominated trend. For intraday trading strategies, it is recommended to focus on short - selling on rallies and use buying on dips as a secondary approach. Pay close attention to the resistance range of $57.7 - $58.5 on the upside and the support range of $55.5 - $54.0 on the downside.
USOIL
sell@57.30-57.50
tp:56.50-56.00
Investment itself is not risky; it is only when investment is out of control that risks occur. When trading, always remember not to act on impulse. I will share trading signals every day. All the signals have been accurate without any mistakes for a whole month. No matter what gains or losses you've had in the past, with my help, you have the hope of achieving a breakthrough in your investment.

The decisive day of major data (USOIL)
Yesterday, it was pointed out in the analysis circle: The support of 58 needs to be tested. Sure enough, buying at low levels continued to expand profits. The current price is 59.6. From the pressure analysis, the market is still affected by data that oversupply, and institutions will not reduce production in a short time. Therefore, oil prices will fall further,
The oil price broke through 59. Due to supply reasons, the market still has a downward range. 60-61 is a good choice to sell in succession.
tp58-57

USOIL is ready to push againNo comment needed. All information is in the chart analysis.
Steps to follow:
Analyze yourself.
Take the position with SL and Take Profits.
Wait, it may take a couple of days, so take a break and step away from the screen from time to time, just like I do :)
Get the result.
I will update the trade every day.
Like, comment with your good mood or viewpoint, share with your circle. It’s together that we get stronger!
Good trades, Traders!
The golden bear

USOIL Today's strategyFrom a technical perspective, if USOIL can take advantage of the weakening of the DXY, stabilize and rebound near the current price, and break through the key resistance level, it may be able to form an upward trend. However, if it fails to effectively withstand the impact of the production increase by OPEC+, and breaks below the key support level, the price is likely to decline further.
Currently, it is necessary to closely monitor the competition around the price level of $55. If this level can be held, the probability of a rebound will increase. Once it is broken, the next support level may be around the $53 area. At the same time, continuously tracking the trend of the DXY and the subsequent policy dynamics of OPEC+ is of vital importance for judging the future trend of USOIL.
USOIL
buy@55-56
tp:57.5-58.5
I am committed to sharing trading signals every day. Among them, real-time signals will be flexibly pushed according to market dynamics. All the signals sent out last week accurately matched the market trends, helping numerous traders achieve substantial profits. Regardless of your previous investment performance, I believe that with the support of my professional strategies and timely signals, I will surely be able to assist you in breaking through investment bottlenecks and achieving new breakthroughs in the trading field.

USOIL | 4H | SWING TRADING Good morning, dear friends
Due to high demand, I’ve prepared a USOIL analysis for you. My target level is set at 63.600.
Once my target is reached, I’ll be sharing updates under this post.
Dear friends, your likes are always my biggest motivation to keep sharing analyses. That’s why I kindly ask each of my followers to show their support—please don’t hold back on the likes.
I sincerely thank everyone who supports me with their likes. It truly means a lot

Analysis of the Market Trend for Next WeekThe price of crude oil futures declined on Friday, falling by approximately 1% during the session, giving back the gains brought about by a brief technical rebound. Bearish demand signals continued to dominate traders' sentiment. The price of crude oil is likely to drop by more than 7% this week, which reflects the growing concerns in the market about the weakening of global demand. Traders remain cautious ahead of the crucial OPEC+ meeting scheduled for May 5th. It is expected that some member states will push for an acceleration of production increases before June. There are reports that Saudi Arabia has hinted that it has no intention of supporting oil prices through a new round of production cuts, which has further intensified the downward pressure on oil prices.
In terms of demand, the market remains skeptical about potential trade negotiations. The Ministry of Commerce of China stated that it is evaluating the proposal put forward by the United States to resume tariff negotiations. Analysts said that the trade environment remains unstable and fraught with uncertainties.
Crude oil showed a trend of rising first and then falling today. At the same time, the oil price correction broke below the support line, and the bearish trend of oil prices is expected to enter a further acceleration stage. After the rise first and then the fall, the demarcation line between the bulls and bears of oil prices is around $59.3. If it is under pressure again, it will indicate the continuation of the future trend.

OILIt is in the ascending channel for 15 minutes.
The blue line I drew is the middle 🔥
If it holds, it will climb to the channel ceiling again🔼 and if it breaks, it will correct to the channel floor🔽
Keep an eye on the blue line 🙂🕯

USOIL trading opportunities.After the "OPEC+ continued to increase production" on Monday, USOIL continued to fall to a four-year low near 55. However, it rebounded after opening low on Monday. It continued on Tuesday. Is it no longer able to fall?
Ludvig believes that it will continue to fall. Because the decline is caused by the growth of production capacity. The rise is caused by geopolitical strategic reserve materials. One of these two directly affects the trend of OIL, and the other indirectly.
The trend of economic data API/EAI will continue to be released. If the geopolitical weakening situation, the oil price data released is roughly negative, so it will continue to fall. But if the impact of geopolitics intensifies, this is a positive factor.
So the current trading direction that can be determined is to continue to short.
In terms of trading, traders with large funds can sell at the current price, and those with small funds can wait until the market returns to above 59 to sell.
The band trading center continues to update new real-time trading opportunities. If you don’t know how to trade, or don’t want to miss the next real-time trading opportunity, remember to follow me.

USOIL BEARISH BIAS RIGHT NOW| SHORT
USOIL SIGNAL
Trade Direction: short
Entry Level: 63.13
Target Level: 61.78
Stop Loss: 64.03
RISK PROFILE
Risk level: medium
Suggested risk: 1%
Timeframe: 1h
Disclosure: I am part of Trade Nation's Influencer program and receive a monthly fee for using their TradingView charts in my analysis.
✅LIKE AND COMMENT MY IDEAS✅

Oil is Doomed: Time to SELL (Part 1/3)A Perfect Storm for Oil Has Begun
The start of April triggered a brutal selloff in oil, and it's only the beginning. Here’s why:
🛑 Global Trade Wars
On April 2nd, Trump launched a full-scale trade war. New tariffs could reach 23% — the highest in a century. China, the world’s largest oil importer, now faces 145% tariffs. Global trade slowdown = weaker demand for oil. Result? Oil dropped 10% in just 2 days — one of the worst drops in history.
📉 US at Risk Too
Goldman Sachs raised recession odds from 15% to 35%. Atlanta FED sees weakening GDP. The whole world slows down — and so does oil demand.
🛢️ OPEC Surprise Output Hike
OPEC+ has started increasing output — over 2.2 million barrels per day in 2025. The April hike alone was supposed to be 138,000 bpd, but turned out to be 411,000 bpd — triple the forecast. This is a MAJOR bearish shock to the market.
Flashback: Spring 2020 — OPEC raised output during an economic crisis. Oil dropped 65% .


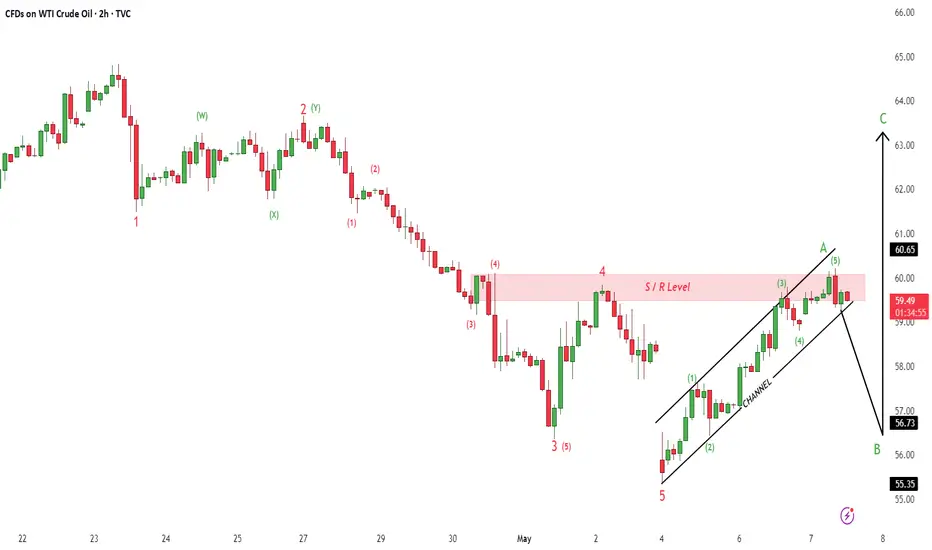
Crude OilU.S Oil Index
- Completed " 12345 " Impulsive Waves and " A " Corrective Wave
- Break of Structure
- Order Block
- Bullish Channel as an corrective pattern in Short Time Frame
- S / R Level
USOIL SENDS CLEAR BEARISH SIGNALS|SHORT
USOIL SIGNAL
Trade Direction: short
Entry Level: 64.59
Target Level: 60.50
Stop Loss: 67.30
RISK PROFILE
Risk level: medium
Suggested risk: 1%
Timeframe: 12h
Disclosure: I am part of Trade Nation's Influencer program and receive a monthly fee for using their TradingView charts in my analysis.
✅LIKE AND COMMENT MY IDEAS✅

OIL: Very bearish Monthly closeOIL ST/MT Outlook: Sell
From FA perspective, Oil is in downtrend:
1- Worldwide recession is/will create a lower demand for oil.
2- Risk: Agreements between Iran-USA and Ukraine-Russia will fade out any risk related.
From TA perspective:
1- Monthly close is a strong bearish. A continuation down is expected.
2- Next major stop is around $40.

Trend is Your friend Took 2 years to understand the above . I kept thinking I knew when the reversals happen and lost over 200k in the process. Still love to trade and one day it will come back even that I know 2 things will make your successful in this game
1 # most important RISK MANAGEMENT
2 # Trend is your friend stick to higer timeframes stop the 1 and 5min charts
3 # Fibonacci is king
4 # trendines and S/R Matter wait for retest
5 # chart patterns is a must for reversal wait for W OR M then Fibonacci it
Anyhow you get told all these things as a newbie but takes time to get it through your thick skull not saying I have mastered it .
Lastly to all newbies stay away from NATGAS she will either make you or most likely destroy. Forget indicators !
Anyhow else love to trade like me

OIL buy setup H1Hello! Friends,
Greetings. Please leave a Like if you like the idea.
Before start talking about technical Let's share your LOVE by giving me LIKES to support this work. Thanks in advance.

WTI Crude Oil selling pressure below 6200The price sentiment for WTI Crude Oil remains bearish, in line with the prevailing downtrend. Recent price action shows an oversold rally, which has stalled near a previous consolidation zone around 6200 — a key resistance level.
Key Resistance Level: 6200
This level marks a previous intraday consolidation area and could act as a ceiling for the current rally.
Bearish Scenario:
If WTI fails to break above 6200, it may resume its decline toward:
5860 (near-term support)
5713
5550 (longer-term support)
Bullish Scenario:
A confirmed breakout and daily close above 6200 would shift momentum and open upside targets at:
6375
6533
6700
Conclusion:
WTI Crude Oil remains under bearish pressure unless it breaks and closes above 6200. Traders should monitor this level closely for signs of rejection or breakout.
This communication is for informational purposes only and should not be viewed as any form of recommendation as to a particular course of action or as investment advice. It is not intended as an offer or solicitation for the purchase or sale of any financial instrument or as an official confirmation of any transaction. Opinions, estimates and assumptions expressed herein are made as of the date of this communication and are subject to change without notice. This communication has been prepared based upon information, including market prices, data and other information, believed to be reliable; however, Trade Nation does not warrant its completeness or accuracy. All market prices and market data contained in or attached to this communication are indicative and subject to change without notice.

WTI OIL Bearish Cross confirming more selling ahead.WTI Oil (USOIL) has been trading within a Channel Down pattern since the December 06 2024 Low. The last Bearish Leg started on a 1D MA200 (orange trend-line) rejection and was confirmed with a 1D MACD Bearish Cross 3 days after.
At the moment we have had a 1D MA50 (blue trend-line) rejection and today we will complete a new 1D MACD Bearish Cross. As a result, we almost have a new sell confirmation. Once completed, sell and target $53.50 (-19% from the point of the rejection).
-------------------------------------------------------------------------------
** Please LIKE 👍, FOLLOW ✅, SHARE 🙌 and COMMENT ✍ if you enjoy this idea! Also share your ideas and charts in the comments section below! This is best way to keep it relevant, support us, keep the content here free and allow the idea to reach as many people as possible. **
-------------------------------------------------------------------------------
Disclosure: I am part of Trade Nation's Influencer program and receive a monthly fee for using their TradingView charts in my analysis.
💸💸💸💸💸💸
👇 👇 👇 👇 👇 👇
