WTI OIL Bearish Cross confirming more selling ahead.WTI Oil (USOIL) has been trading within a Channel Down pattern since the December 06 2024 Low. The last Bearish Leg started on a 1D MA200 (orange trend-line) rejection and was confirmed with a 1D MACD Bearish Cross 3 days after.
At the moment we have had a 1D MA50 (blue trend-line) rejection and today we will complete a new 1D MACD Bearish Cross. As a result, we almost have a new sell confirmation. Once completed, sell and target $53.50 (-19% from the point of the rejection).
-------------------------------------------------------------------------------
** Please LIKE 👍, FOLLOW ✅, SHARE 🙌 and COMMENT ✍ if you enjoy this idea! Also share your ideas and charts in the comments section below! This is best way to keep it relevant, support us, keep the content here free and allow the idea to reach as many people as possible. **
-------------------------------------------------------------------------------
Disclosure: I am part of Trade Nation's Influencer program and receive a monthly fee for using their TradingView charts in my analysis.
💸💸💸💸💸💸
👇 👇 👇 👇 👇 👇
USCRUDEOILCFD trade ideas

USOIL Will Go Down! Sell!
Here is our detailed technical review for USOIL.
Time Frame: 8h
Current Trend: Bearish
Sentiment: Overbought (based on 7-period RSI)
Forecast: Bearish
The market is approaching a significant resistance area 61.191.
Due to the fact that we see a positive bearish reaction from the underlined area, I strongly believe that sellers will manage to push the price all the way down to 56.009 level.
P.S
Overbought describes a period of time where there has been a significant and consistent upward move in price over a period of time without much pullback.
Disclosure: I am part of Trade Nation's Influencer program and receive a monthly fee for using their TradingView charts in my analysis.
Like and subscribe and comment my ideas if you enjoy them!

Oil - Short Term Sell Trade Update!!!Hi Traders, on April 17th I shared this idea "Oil - Looking To Sell Pullbacks In The Short Term"
I expected to see bearish continuation until the two Fibonacci resistance zones hold. You can read the full post using the link above.
The price is currently holding in the first Fibonacci resistance zone.
Until both the Fibonacci resistance zones hold my bearish view still remains.
If you enjoy this idea, don’t forget to LIKE 👍, FOLLOW ✅, SHARE 🙌, and COMMENT ✍! Drop your thoughts and charts below to keep the discussion going. Your support helps keep this content free and reach more people! 🚀
-------------------------------------------------------------------------------------------------------------------
Disclosure: I am part of Trade Nation's Influencer program and receive a monthly fee for using their TradingView charts in my analysis.

SHORT OIL | IMPULSE CORRECTON STRATEGY Direction: Trending downwards
Moving Average: Blue < Red
Pattern Impulse: Impulse correction
Fib Retracement: 38.2
MACD < 0
1st Target = 55.15
2nd Target = 52.53


Can oil prices continue to be shorted? Of courseSaudi Arabia made a major strategic shift, willing to accept low oil prices and unwilling to cut supply.
Oil prices fell sharply as a result.
It is expected that oil prices will hit 55-56 in the short term, so the operation is still mainly shorting oil prices. Overcapacity.

Shorting the USOIL Looking at the longer trajectory of the Oil chart, I am not too bullish and optimistic about its future.
Weekly chart reveals it is still trending down in the channel with mid Jan this year giving the bulls a false hope only to falls further south. I expect the price to slightly moves up to the resistance level (OR higher to create a bull trap) at 66.08 before it comes down again. My profit target is around 51.54.
The risk/reward ratio looks good to me. Always have a STOP LOSS no matter how confident you think you are in your charting. IT is still based on probability from historical patterns and it may or may not repeats itself........Nothing is 100% certain in today's volatile market.
Please DYODD

USOIL 2025/04/29Scenario USOIL TF H4
- Stick to your stop loss to protect your trades
- Manage your positions patiently until you hit the target
- Profit always in risk, take the risk or lose the chance

"US Oil Spot/ WTI" Energy Market Heist Plan (Day Trade)🌟Hi! Hola! Ola! Bonjour! Hallo! Marhaba!🌟
Dear Money Makers & Robbers, 🤑💰✈️
Based on 🔥Thief Trading style technical and fundamental analysis🔥, here is our master plan to heist the "US Oil Spot/ WTI" Energy Market. Please adhere to the strategy I've outlined in the chart, which emphasizes short entry. Our aim is the high-risk GREEN Zone. It's a Risky level, oversold market, consolidation, trend reversal, trap at the level where traders and bullish robbers are stronger. 🏆💸"Take profit and treat yourself, traders. You deserve it!💪🏆🎉
Entry 📈 : "The heist is on! Wait for the Neutral Level breakout then make your move at (59.90) - Bearish profits await!"
however I advise to Place sell stop orders above the Moving average (or) after the Support level Place sell limit orders within a 15 (or) 30 minute timeframe most NEAREST (or) SWING low or high level for Pullback entries.
📌I strongly advise you to set an "alert (Alarm)" on your chart so you can see when the breakout entry occurs.
Stop Loss 🛑: "🔊 Yo, listen up! 🗣️ If you're lookin' to get in on a sell stop order, don't even think about settin' that stop loss till after the breakout 🚀. You feel me? Now, if you're smart, you'll place that stop loss where I told you to 📍, but if you're a rebel, you can put it wherever you like 🤪 - just don't say I didn't warn you ⚠️. You're playin' with fire 🔥, and it's your risk, not mine 👊."
📌Thief SL placed at the nearest/swing High or Low level Using the 4H timeframe (63.00) Day/Scalping trade basis.
📌SL is based on your risk of the trade, lot size and how many multiple orders you have to take.
Target 🎯: 57.50
🔥🛢"US Oil Spot/ WTI" Energy Market Heist Plan (Scalping/Day Trade) is currently experiencing a Bearish trend.., driven by several key factors.👇👇👇
📰🗞️Read the Fundamental, Macro Economics, COT Report, Seasonal Factors, Intermarket Analysis, Inventory and Storage Analysis, Sentimental Outlook, Future trend predict.
Before start the heist plan read it. go ahead to check 👉👉👉🔗🔗🌎🌏🗺
⚠️Trading Alert : News Releases and Position Management 📰 🗞️ 🚫🚏
As a reminder, news releases can have a significant impact on market prices and volatility. To minimize potential losses and protect your running positions,
we recommend the following:
Avoid taking new trades during news releases
Use trailing stop-loss orders to protect your running positions and lock in profits
💖Supporting our robbery plan 💥Hit the Boost Button💥 will enable us to effortlessly make and steal money 💰💵. Boost the strength of our robbery team. Every day in this market make money with ease by using the Thief Trading Style.🏆💪🤝❤️🎉🚀
I'll see you soon with another heist plan, so stay tuned 🤑🐱👤🤗🤩

Market Analysis and Trading Strategy of USOILThe USOIL market has witnessed significant fluctuations recently. Yesterday, the price broke below the key support level of $61.5, and then it has been declining all the way. As of today, it has approached the vicinity of $59.5. This downward trend reflects that the bearish force currently dominates the market.
From a technical analysis perspective, once the support level of $61.5 is broken, its nature will transform into a strong resistance level. The rapid decline of the price to $59.5 indicates strong bearish momentum. Currently, the focus of the market is on the $59 mark, which is of crucial importance. If this support level is breached, according to the continuity of the price trend and the technical pattern, USOIL is highly likely to continue to decline further. The next important support level is around $57.5. Conversely, if the price can be effectively supported near $59, based on the technical repair demand after being oversold, the price is expected to rebound.
Based on the above analysis, in terms of trading strategy, investors can consider taking a short position near $60. If the price breaks below $59, the short position can be held, with the target price set at $57.5. If the price stabilizes and rebounds near $59, the stop-loss order should be executed in a timely manner to avoid expanding losses. Given the frequent release of important data recently and the significant impact of these data, market volatility will increase significantly. Investors must trade with caution, strictly control their positions, and set reasonable stop-loss levels to cope with the possible sharp price fluctuations.
I am committed to sharing trading signals every day. Among them, real-time signals will be flexibly pushed according to market dynamics. All the signals sent out last week accurately matched the market trends, helping numerous traders achieve substantial profits. Regardless of your previous investment performance, I believe that with the support of my professional strategies and timely signals, I will surely be able to assist you in breaking through investment bottlenecks and achieving new breakthroughs in the trading field.

WTI CRUDE OIL: Buy signal at the bottom of the Channel Up.WTI Crude Oil turned bearish on its 1D technical outlook (RSI = 42.387, MACD = -1.000, ADX = 27.186) as it crossed under the 4H MA50. Still, it hit and is so far contained at the bottom of the Channel Up, which makes it a strong short term buy opportunity. Aim for the 4H MA200 (TP = 65.00).
## If you like our free content follow our profile to get more daily ideas. ##
## Comments and likes are greatly appreciated. ##

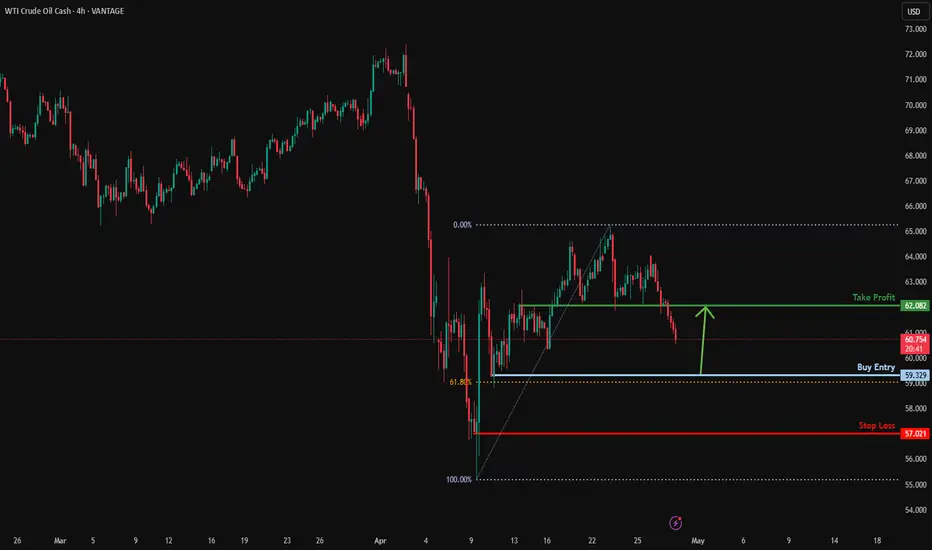
Could the price bounce from here?USO/USD is falling towards the support level which is a pullback support that lines up with the 61.8% Fibonacci retracement and could bounce from this level to our take profit.
Entry: 59.32
Why we like it:
There is a pullback support level that lines up with the 61.8% Fibonacci retracement.
Stop loss: 57.02
Why we like it:
There is a pullback support level.
Take profit: 62.08
Why we like it:
There is an overlap resistance level.
Enjoying your TradingView experience? Review us!
Please be advised that the information presented on TradingView is provided to Vantage (‘Vantage Global Limited’, ‘we’) by a third-party provider (‘Everest Fortune Group’). Please be reminded that you are solely responsible for the trading decisions on your account. There is a very high degree of risk involved in trading. Any information and/or content is intended entirely for research, educational and informational purposes only and does not constitute investment or consultation advice or investment strategy. The information is not tailored to the investment needs of any specific person and therefore does not involve a consideration of any of the investment objectives, financial situation or needs of any viewer that may receive it. Kindly also note that past performance is not a reliable indicator of future results. Actual results may differ materially from those anticipated in forward-looking or past performance statements. We assume no liability as to the accuracy or completeness of any of the information and/or content provided herein and the Company cannot be held responsible for any omission, mistake nor for any loss or damage including without limitation to any loss of profit which may arise from reliance on any information supplied by Everest Fortune Group.
Crude Oil | Support Level 62.700-61.700Crude Oil reached support level.
Take Profit : 71.750
Stop Loss : 60.680

Rising Wedge and Triple topThe price has broken out of the rising wedge pattern followed by a pullback that has formed a triple top on the 1-hour timeframe, if the price makes a lower low, we will see a bearish impulse
WE ONLY TRADE PULLBACKS

USOIL Crab Harmonic PatternThe potential for an increase in oil prices is on the horizon, especially as buyers seem to be showing interest at the golden Fibonacci level of 60.7 USD, which aligns with harmonic patterns resembling a crab.
This fascinating interplay between market psychology and technical analysis highlights how traders often react to specific price levels.
As we observe these developments, it’s essential to keep an eye on market trends and the underlying factors influencing oil prices.


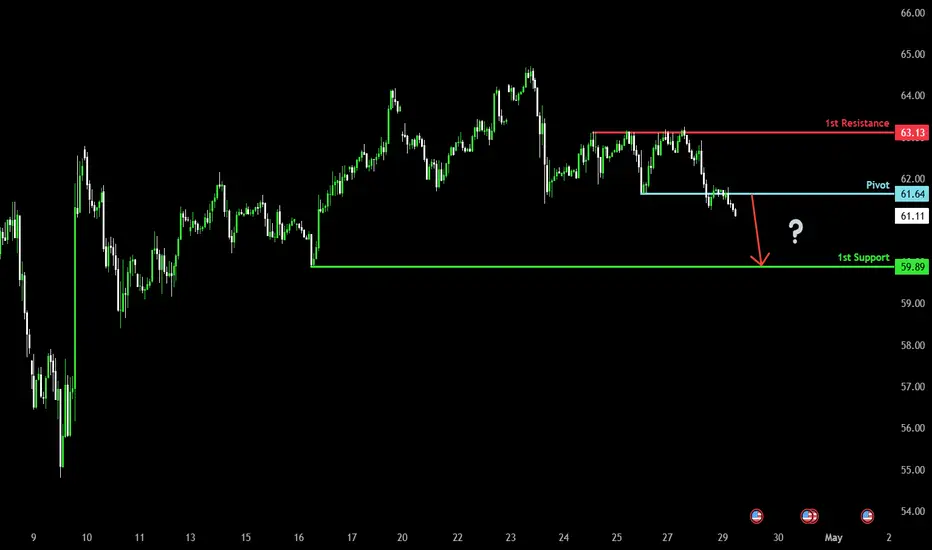
Bearish drop off pullback resistance?WTI Oil (XTI/USD) has rejected off the pivot which is a pullback resistance and could drop to the pullback support.
Pivot: 61.64
1st Support: 59.89
1st Resistance: 63.13
Risk Warning:
Trading Forex and CFDs carries a high level of risk to your capital and you should only trade with money you can afford to lose. Trading Forex and CFDs may not be suitable for all investors, so please ensure that you fully understand the risks involved and seek independent advice if necessary.
Disclaimer:
The above opinions given constitute general market commentary, and do not constitute the opinion or advice of IC Markets or any form of personal or investment advice.
Any opinions, news, research, analyses, prices, other information, or links to third-party sites contained on this website are provided on an "as-is" basis, are intended only to be informative, is not an advice nor a recommendation, nor research, or a record of our trading prices, or an offer of, or solicitation for a transaction in any financial instrument and thus should not be treated as such. The information provided does not involve any specific investment objectives, financial situation and needs of any specific person who may receive it. Please be aware, that past performance is not a reliable indicator of future performance and/or results. Past Performance or Forward-looking scenarios based upon the reasonable beliefs of the third-party provider are not a guarantee of future performance. Actual results may differ materially from those anticipated in forward-looking or past performance statements. IC Markets makes no representation or warranty and assumes no liability as to the accuracy or completeness of the information provided, nor any loss arising from any investment based on a recommendation, forecast or any information supplied by any third-party.
"US Oil Spot / WTI" Energy Market Heist Plan (Scalping/Day)🌟Hi! Hola! Ola! Bonjour! Hallo! Marhaba!🌟
Dear Money Makers & Robbers, 🤑 💰💸✈️
Based on 🔥Thief Trading style technical and fundamental analysis🔥, here is our master plan to heist the "US Oil Spot / WTI" Energy Market. Please adhere to the strategy I've outlined in the chart, which emphasizes long entry. Our aim is to escape near the high-risk MA Zone. Risky level, overbought market, consolidation, trend reversal, trap at the level where traders and bearish robbers are stronger. 🏆💸"Take profit and treat yourself, traders. You deserve it!💪🏆🎉
Entry 📈 : "The vault is wide open! Swipe the Bullish loot at any price - the heist is on!
however I advise to Place buy limit orders within a 15 or 30 minute timeframe nearest or swing low or high level for pullback entries.
Stop Loss 🛑:
📍 Thief SL placed at the recent/swing low level Using the 3H timeframe (60.50) Day/Scalping trade basis.
📍 SL is based on your risk of the trade, lot size and how many multiple orders you have to take.
🏴☠️Target 🎯: 68.70
💰💵💴💸"US Oil Spot / WTI" Energy Market Heist Plan (Day / Scalping Trade) is currently experiencing a bullishness🐂.., driven by several key factors.☝☝☝
📰🗞️Get & Read the Fundamental, Macro Economics, COT Report, Seasonal Factors, Intermarket Analysis, Inventory and Storage Analysis, Future trend targets with targets... go ahead to check 👉👉👉🔗🔗
⚠️Trading Alert : News Releases and Position Management 📰 🗞️ 🚫🚏
As a reminder, news releases can have a significant impact on market prices and volatility. To minimize potential losses and protect your running positions,
we recommend the following:
Avoid taking new trades during news releases
Use trailing stop-loss orders to protect your running positions and lock in profits
💖Supporting our robbery plan 💥Hit the Boost Button💥 will enable us to effortlessly make and steal money 💰💵. Boost the strength of our robbery team. Every day in this market make money with ease by using the Thief Trading Style.🏆💪🤝❤️🎉🚀
I'll see you soon with another heist plan, so stay tuned 🤑🐱👤🤗🤩

#USOIL 4HUSOIL (4H Timeframe) Analysis
Market Structure:
The chart is forming a classic Head and Shoulders pattern, which often signals a potential reversal from an uptrend to a downtrend. The left shoulder, head, and right shoulder are clearly visible, and the neckline is an important support zone to monitor.
Forecast:
A sell opportunity may be considered if the price breaks and closes below the neckline with confirmation. This breakdown could indicate the start of a bearish trend continuation.
Key Levels to Watch:
- Entry Zone: Look for a sell setup once the neckline is broken and retested as resistance.
- Risk Management:
- Stop Loss: Positioned above the right shoulder to minimize risk.
- Take Profit: Target nearby support zones or use a measured move technique based on the pattern's height.
Market Sentiment:
As long as the neckline holds and the breakdown is confirmed, bearish momentum is likely. A failure to break below the neckline would delay or invalidate the selling setup.

Heading into 61.8% Fibonacci resistance?WTI Oil (XTI/USD) is risng towards the pivot which has been identified as a pullback resistance and could reverse to the 1st suport which acts as a pullback support.
Pivot: 65.64
1st Support: 57.71
1st Resistance: 71.18
Risk Warning:
Trading Forex and CFDs carries a high level of risk to your capital and you should only trade with money you can afford to lose. Trading Forex and CFDs may not be suitable for all investors, so please ensure that you fully understand the risks involved and seek independent advice if necessary.
Disclaimer:
The above opinions given constitute general market commentary, and do not constitute the opinion or advice of IC Markets or any form of personal or investment advice.
Any opinions, news, research, analyses, prices, other information, or links to third-party sites contained on this website are provided on an "as-is" basis, are intended only to be informative, is not an advice nor a recommendation, nor research, or a record of our trading prices, or an offer of, or solicitation for a transaction in any financial instrument and thus should not be treated as such. The information provided does not involve any specific investment objectives, financial situation and needs of any specific person who may receive it. Please be aware, that past performance is not a reliable indicator of future performance and/or results. Past Performance or Forward-looking scenarios based upon the reasonable beliefs of the third-party provider are not a guarantee of future performance. Actual results may differ materially from those anticipated in forward-looking or past performance statements. IC Markets makes no representation or warranty and assumes no liability as to the accuracy or completeness of the information provided, nor any loss arising from any investment based on a recommendation, forecast or any information supplied by any third-party.

OIL TRADE IDAHello
Hi everyone. Regarding oil movements, I see a long opportunity at the level of 59.61. If the price closes below 58.56, there is a possibility of a temporary rise before continuing to drop to 55.
good luck all
**My trading strategy is not intended to be a signal. It's a process of learning about market structure and sharpening my trading my skills also for my trade journal**
Thanks a lot for your support

XTIUSD – 4H Short Position ExplanationI have entered a short position on XTIUSD (WTI Crude Oil) based on a multi-timeframe bearish confluence setup:
Weekly and Daily Trend: The overall structure on both the weekly and daily charts is bearish, showing a consistent downtrend and favoring sell setups.
Daily Chart Structure: Recently, price formed a lower high on the daily timeframe, indicating continued bearish pressure and a rejection from a key resistance zone.
4H Price Action: On the 4-hour chart, price has broken a major support level, confirming the bearish momentum. This breakdown increases the probability of further downside movement.
Trendline & Structure: The pair is respecting a descending trendline, further supporting the bearish scenario.
RSI Confirmation: The RSI has dropped below 40 and continues to trend downward, reflecting bearish strength without yet being oversold.
This trade aligns with the higher timeframe trend, with a clear break of support and momentum favoring sellers. The risk is managed above the broken structure, and the setup offers a favorable risk-to-reward ratio.

CRUDE OIL Move Down Ahead! Sell!
Hello,Traders!
USOIL was making a
Bullish correction but
It is in the downtrend
Overall, so as the price
Is hovering beneath the
Horizontal resistance
Of 64.80$ from where
We will be expecting a
Local bearish correction
Sell!
Comment and subscribe to help us grow!
Check out other forecasts below too!
Disclosure: I am part of Trade Nation's Influencer program and receive a monthly fee for using their TradingView charts in my analysis.
