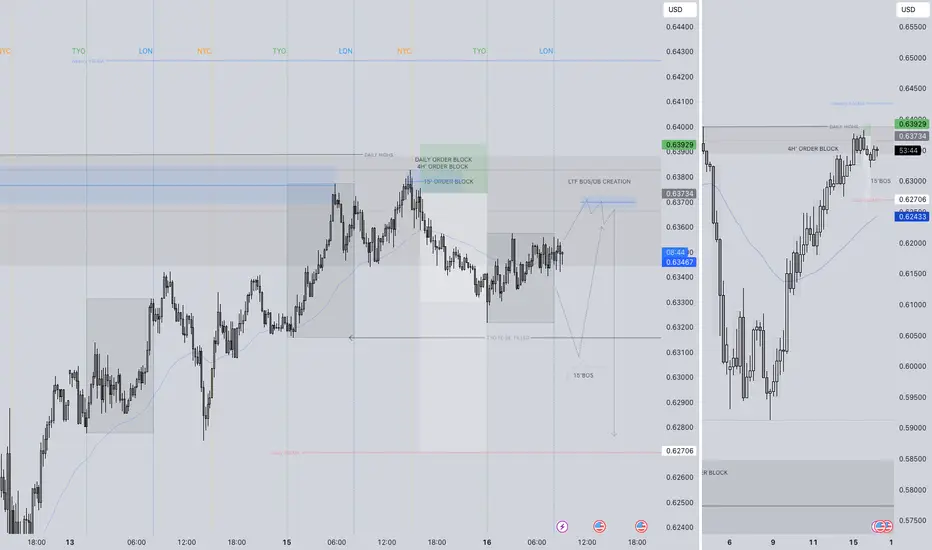
AUDUSD SHORT FORECAST Q2 W16 D16 Y25AUDUSD SHORT FORECAST Q2 W16 D16 Y25
GM.
Here's a short forecast for AUDUSD short based of 4 hour order block.
awaiting short confirmation in turn around in price in turn creating a lower time frame order block to be used to short from.
Let's await price action!
FRGNT X
USDAUD trade ideas
AUDUSD(20250416)Today's AnalysisMarket news:
U.S. import prices fell 0.1% in March from the previous month, the first month-on-month decline since September last year.
Technical analysis:
Today's buying and selling boundaries:
0.6346
Support and resistance levels:
0.6414
0.6388
0.6372
0.6320
0.6304
0.6278
Trading strategy:
If the price breaks through 0.6346, consider buying, the first target price is 0.6372
If the price breaks through 0.6320, consider selling, the first target price is 0.6304

AUDUSD Discretionary Analysis: Recovery Mode ActivatedIt’s that feeling when the engine’s been cold for a while, but now it’s starting to rev. AUDUSD is flashing signs it wants to push up — not in a rush, but with purpose. I’m seeing strength building, like it’s getting ready to climb. Recovery mode’s not just activated — it’s already in motion. I’m calling for upside here. If it plays out, I’ll be riding the move. If not, hey, I’ll wait for the next setup. But right now? I like the long.
Just my opinion, not financial advice.

AU Short
AUD/USD – Short Entry @ 0.63426
Entry Justification
Price approached a well-defined resistance zone with momentum, aggressively sweeping through all visible fair value gaps without meaningful rejection, signaling liquidity grab behavior. The rally was ultimately capped just beneath a higher time frame supply area, where sell-side pressure emerged.
During yesterday’s NY session, price stalled and left clear signs of exhaustion. Today’s Asia session provided the technical confirmation needed — a clean Break of Structure on the intraday entry timeframe, signaling the end of the bullish leg and offering alignment with the higher timeframe bearish narrative.
Macro Alignment
- RBA remains dovish with no clear path to tightening
- Risk-off sentiment driven by macro (China tariffs, soft commodities, USD resilience)
- AUD remains fundamentally weak relative to USD in current conditions
Trade Logic
- Resistance test and liquidity sweep
- Break of structure post-liquidity event
- Aligned with macro bearish bias and current market sentiment
- Entry taken on confirmation of shift in order flow during low-volume session (Asia), offering optimal R:R
Risk Management Note
- Hold remainder through CPI only if price action remains clean and reactive to USD data

AUDUSD Short/Sell IdeaAUDUSD has been weak for many weeks because of the current trade war between China and the USA. Australia relies heavily on Chinese trade, and Australia is indirectly affected as a result of these tariff wars.

AUDUSD InsightHello to all our subscribers!
Please share your personal opinions in the comments. Don’t forget to hit the booster and subscribe.
Key Points
- White House spokesperson Caroline Leavitt stated, “The ball is in China’s court, and China needs to negotiate with us,” indicating that the U.S. expects China to come to the negotiation table first.
- In its first tariff talks with the United States, the European Union focused on mutual zero tariffs on automobiles and the issue of Chinese steel overcapacity.
- China requested joint action with Australia regarding tariff issues, but Australia refused, emphasizing its intention to reduce dependence on China and strengthen ties with countries like Indonesia, India, and the United Arab Emirates.
Major Economic Events This Week
+ April 16: U.K. March CPI, Eurozone March CPI, U.S. March Retail Sales, Bank of Canada Rate Decision
+ April 17: ECB Rate Decision, Fed Chair Powell’s Speech
+ April 18: Easter
AUDUSD Chart Analysis
Previously, the pair showed strong downward momentum, breaking below the 0.60000 level. However, it successfully rebounded and is now retesting resistance at the 0.64000 level. This area is a strong resistance zone, so a downward move is more likely. If the pair faces resistance as expected, a pullback to the 0.60000 level is anticipated. On the other hand, if it breaks through this resistance, a rise toward the 0.66000 level can be expected.

Shorting AUDUSD Looks good currently hit a resistance level broke structure of that resistance area aiming for higher time frame support. This is not financial advice. happy trading
33

AUD/USD⚔️ Strategy Options:
🟢 Bullish Tactical Play (Range Swing):
Only valid if price closes weekly above 0.6450.
Entry: Buy limit on retest of 0.6310
SL: 0.6150
TP1: 0.6500
TP2: 0.6850
This is a short-term retracement play against a longer-term bearish trend.
🔴 Bearish Trend Continuation:
Ideal if weekly closes below 0.6200
Entry: Sell retrace at 0.6300
SL: 0.6460
TP1: 0.6000
TP2: 0.5800–0.5650
This aligns with macro pressure (risk-off + China slowdown) and offers clean structure.

Turn or Burn Deep retracement within this current TR. Volume price analysis suggest manipulation as price is rising but demand volume is declining, Either supply is deeply diminished allowing ease of movement or is this slow profit taking by larger interest.
In a bullish scenario price creates momentum to push, close, and maintain above .64080. In what my opinion is more favorable based on market conditions, price takes out one of the previous highs in this range near .64000 where liquidity rest and resumes the htf downtrend. Catalyst being AUD unemployment rates and Fed Powell Speech, FOMO would likely induce a buy trap / false breakout.

AUD-USD BEARISH BIAS|SHORT|
✅AUD_USD will soon retest a key resistance level of 0.6409
So I think that the pair will make a pullback
And go down to retest the demand level below at 0.6318
SHORT🔥
✅Like and subscribe to never miss a new idea!✅
Disclosure: I am part of Trade Nation's Influencer program and receive a monthly fee for using their TradingView charts in my analysis.

Bearish drop off multi swing high resistance?AUD/USD has reacted off the resistance level which is a multi swing high resistance and could drop from this level to our take profit.
Entry: 0.6386
Why we like it:
There is a multi swing high resistance.
Stop loss: 0.6447
Why we like it:
There is an overlap resistance level.
Take profit: 0.6265
Why we like it:
There is a pullback support level that lines up with the 23.6% Fibonacci retracement.
Enjoying your TradingView experience? Review us!
Please be advised that the information presented on TradingView is provided to Vantage (‘Vantage Global Limited’, ‘we’) by a third-party provider (‘Everest Fortune Group’). Please be reminded that you are solely responsible for the trading decisions on your account. There is a very high degree of risk involved in trading. Any information and/or content is intended entirely for research, educational and informational purposes only and does not constitute investment or consultation advice or investment strategy. The information is not tailored to the investment needs of any specific person and therefore does not involve a consideration of any of the investment objectives, financial situation or needs of any viewer that may receive it. Kindly also note that past performance is not a reliable indicator of future results. Actual results may differ materially from those anticipated in forward-looking or past performance statements. We assume no liability as to the accuracy or completeness of any of the information and/or content provided herein and the Company cannot be held responsible for any omission, mistake nor for any loss or damage including without limitation to any loss of profit which may arise from reliance on any information supplied by Everest Fortune Group.

AUDUSD Short Setup Based on DXY AnalysisHello traders!
After closely analyzing the Dollar Index (DXY), I've spotted a key development that has shaped my bearish bias on AUDUSD. The DXY recently broke below a higher timeframe low, rejecting strongly off the July 2023 low after sweeping liquidity on the Weekly chart. This kind of price action signals potential bullish momentum on the dollar in the coming days.
As a result, I’m anticipating weakness across major USD pairs, AUDUSD, EURUSD, GBPUSD, and NZDUSD included.
Here’s my trade setup for AUDUSD:
Entry: 0.63550
Target 1: 0.62748
Target 2: 0.62061
Target 3: 0.61506
Target 4: 0.60951
Stop Loss: 0.64020
I’m expecting a move to the downside if the resistance level at 0.6355 continues to hold, especially with DXY looking primed for further upside.
📈 This idea is based on a combination of liquidity grabs, higher timeframe structure, and DXY confluence, a powerful trio when it comes to swing setups.
If this analysis resonates with your view or adds value to your trading, a boost would be greatly appreciated! 🙌
Stay sharp and trade safe! 💰
DXY (Dollar Index) on Weekly Timeframe

AUDUSD keeps surging upwardFrom a technical analysis perspective, the moving average system presents a typical bullish arrangement pattern. The 5-day moving average and the 10-day moving average are continuously rising and diverging 🚀, providing a solid support foundation for the exchange rate of the Australian dollar against the US dollar. At the moment, the MACD indicator is above the zero axis, and its histogram bars are also continuously expanding 📈, which clearly indicates that the bullish momentum is in a strong state 💪. At the same time, although the KDJ indicator is in the overbought area, there has been no significant sign of a turn, which means that the current upward trend is highly likely to continue 😎.
In terms of fundamentals, Australia's recent economic data has been rather remarkable 🌟. For example, Australia's employment data has shown a good growth trend, and the unemployment rate has decreased, indicating that the vitality of Australia's labor market is increasing 💪, which in turn provides strong positive support for the Australian dollar 😃. In addition, Australia's commodity export data is also quite excellent. As a resource-exporting country, the stable increase in commodity prices and the growth in export volume have greatly promoted Australia's economic development 🚀 and further enhanced the attractiveness of the Australian dollar 😍. In contrast, there is a certain degree of uncertainty in the economic policies of the United States. Especially, the progress of the fiscal stimulus plan has been slow, which has somewhat weakened the market's confidence in the US dollar 😕. Based on considerations of risk, investors have started to gradually shift their funds to other currencies, including the Australian dollar, injecting strong impetus into the rise of AUDUSD 💥.
💰💰💰 GBPUSD💰💰💰
🎯 Buy@1.3200 - 1.3230
🎯 TP 1.3300 - 1.3350
Traders, if you're fond of this perspective or have your own insights regarding it, feel free to share in the comments. I'm really looking forward to reading your thoughts! 🤗
👇The accuracy rate of our daily signals has remained above 98% within a month! 📈 We sincerely welcome you to join our channel and share in the success with us! 👉

AUDUSD ShortI noticed we have a bearish structure on the 15m, and the entire push was created from the 15m Orderblock we're currently in. We've had a bearish reaction from there (1m BOS), and now I'm waiting to see if the price will revisit the OB left behind for a potential continuation to the downside.
My first target is 1:3 (30pips) and overall i expect price to fill previous Asia.

HTF Supply Area + CHOCH on LTFAUDUSD Dumped Heavily Recently So it's time to Short it & Go With The Flow
HTF Supply Area + CHOCH On LTF
Took a short entry, SL Above The Supply Area + Targeting 50% Of the Whole Move

AUD/USD BUYERS WILL DOMINATE THE MARKET|LONG
Hello, Friends!
AUD/USD pair is trading in a local downtrend which we know by looking at the previous 1W candle which is red. On the 9H timeframe the pair is going down too. The pair is oversold because the price is close to the lower band of the BB indicator. So we are looking to buy the pair with the lower BB line acting as support. The next target is 0.622 area.
Disclosure: I am part of Trade Nation's Influencer program and receive a monthly fee for using their TradingView charts in my analysis.
✅LIKE AND COMMENT MY IDEAS✅

Gold 2H Chart Insight: Awaiting RetracementAfter analysing the 2-hour chart, we observe that the price is currently trading just below a key resistance level without any significant correction following its recent move. This lack of retracement, combined with the resistance overhead, suggests that a pullback is likely. We anticipate the price to retrace toward the potential target highlighted on the chart.
⚠️ Please remember:
Every trade carries risk. Protecting your capital should always be the top priority.
Wishing you a successful and green trading week!

AUD/USD is Overbought: Awaiting CorrectionFenzoFx—AUD/USD is in a strong bullish run, nearing the $0.6407 resistance. The Stochastic Oscillator signals overbought conditions, indicating the Australian dollar is overpriced in the short term.
While the trend remains bullish, consolidation may follow, with potential support at $0.6276.
>>> No Deposit Bonus
>>> %100 Deposit Bonus
>>> Forex Analysis Contest
All at F enzo F x Decentralized Forex Broker

AUDUSD SHORT FORECAST Q2 W16 D15 Y25AUDUSD SHORT FORECAST Q2 W16 D15 Y25
Good Morning Traders!
A very similar setup to what was forecast yesterday! Take a look.
We are sitting in varies higher time frame order blocks with confluence stacking.
We have had a move off the point of interest identified yesterday and a 15' order block was created on the bearish move.
Let price action gravitate to our 15' order block in London for a continued short.
FRGNT X

AUD/USD Bullish Breakout Setup – RBR Zone StrategyAUD/USD 1H Chart Analysis
1. Trend Shift Identified
⚡ CHoCH (Change of Character) detected!
Price broke above a previous high → Potential trend reversal from bearish to bullish.
🔸 Bearish → Bullish Shift!
2. Key Zone: RBR Zone
🔵 RBR (Rally-Base-Rally) Zone!
This is a strong demand zone where buyers stepped in.
Price is expected to return here before continuing upward.
⬇️ Price retracement
⬆️ Reentry opportunity!
3. Trade Setup
📍 Entry: In the blue RBR zone
🛑 Stop Loss: Below zone at 0.61002
🎯 Target: At 0.63307
Trade Idea:
Risk: 🔻 Small (below RBR zone)
Reward: 🔺 Big (up to previous structure)
R:R Ratio = 3:1 ✔️
4. EMA (Exponential Moving Average)
📈 9 EMA is trending upward
Price is above the EMA → Bullish momentum confirmed
Summary
Buy setup forming after trend reversal
Watch for price reaction in the RBR zone
If support holds → 🚀 to the target!

AUDUSD: Detailed Support & Resistance Analysis 🇦🇺🇺🇸
Here is my latest structure analysis for AUDUSD
for this week.
Resistance 1: 0.6385 - 0.6430 area
Resistance 2: 0.6455 - 0.6470 area
Resistance 3: 0.6518 - 0.6560 area
Support 1: 0.6078 - 0.6135 area
Support 2: 0.5914 - 0.5954 area
Consider these structures for pullback/breakout trading!
❤️Please, support my work with like, thank you!❤️
I am part of Trade Nation's Influencer program and receive a monthly fee for using their TradingView charts in my analysis.

Sellers Trapped! AUD/USD Flips Structure to BullishAustralian Dollar / U.S. Dollar (AUD/USD)
📆 Timeframe: 1-Day (1D)
📈 Technical Breakdown:
1. Sideways Consolidation Zone
The price has been consolidating within a clear horizontal range.
This range is defined by upper resistance and lower support zones, with several rejections confirming the boundaries.
2. Downtrend Resistance Line Broken
A long-standing resistance trendline has been breached to the upside.
This breakout suggests a potential trend reversal or continuation rally if price holds above.
3. Seller Trap Identified
There was a strong liquidity sweep below the support zone, labeled “Sellers Got Trapped.”
This is a classic liquidity grab, where shorts were likely triggered before price reversed sharply upward.
4. EMA 50 as Dynamic Support
Price has reclaimed the 50 EMA (0.62701), indicating a shift in short-term momentum towards the bulls.
If the price remains above this moving average, it could act as a dynamic support in the near term.
5. RSI (Relative Strength Index) at 57.62
RSI is in bullish neutral territory, suggesting there’s still room for upward momentum before overbought levels (>70).
No bearish divergence is currently visible.
✅ Bullish Outlook:
Breakout above resistance trendline ✅
Recovery above EMA 50 ✅
Seller trap below range ✅
RSI supports further move ✅

AUDUSD SELL TRADEAUSSIE Has been in a bearish cycle for some time now and currently we have reacted off our extreme 1hr orderblock with a 15mmin internal choch, best believe we are ready for a minimum of 100pips drop
