AUDUSD Bears "Flag Down" Potential OpportunitiesOn the Technical Analysis stand-point, FX:AUDUSD has been Consolidating in an Ascending Channel since the beginning of this year after having a sharp decline which started in October last year. Now the past 6 Months, Price Action seems to be forming a strong Continuation Pattern, the Bear Flag!
Based on the Retracement from the Swing High @ .6942 to the Swing Low @ .60872, Price has made a 38.2% Retracement to .64081, resulting in a False Break, pushing Price back into Pattern!
Price has been trading Under the 200 EMA since the start of the "Flagpole" and with the separation between it and the 34 EMA Band, feeds the Bearish Bias after we see Price heavily rejected after touching the 34 EMA Band!
*Once Price makes a Breakout of the Rising Support of the Channel -> Bear Flag Confirmed
*Increase in Volume after Break -> Breakout Validated
If we get a True Breakout that is Validated by the checklist of factors, we could be looking at great opportunities to take FX:AUDUSD down to the current 5 Year Low of .55063 set back in March 16th 2020 (Initial Outbreak of Covid) based on the Flagpole and Potential Extension of a Valid Break and Retest of the Bear Flag!
Now, Fundamentally what is driving the Weaker Aussie Dollar is the fear of the impact of what the US Tariffs will do to Australia's "Key Trading Partners" being China, Japan and South Korea all being high on the Reciprocal Tariff List. Because of this, the RBA has now priced in 100 Basis Points worth of Rate Cuts to come with the expectations of a "dampened broader outlook for global trade and economic growth."
www.tradingview.com
Stay Tuned!
USDAUD trade ideas

Fri 4th Apr 2025 AUD/USD Daily Forex Chart Buy SetupGood morning fellow traders. On my Daily Forex charts using the High Probability & Divergence trading methods from my books, I have identified a new trade setup this morning. As usual, you can read my notes on the chart for my thoughts on this setup. The trade being a AUD/USD Buy. Enjoy the day all. Cheers. Jim

Possible ScenariosWe had a great little pullback in the red circle and went up to the last big resistance.
From there we had a good rejection.
Now i would like to see a pullback to the next zones and like to expect a second try to breack the resistance
---------------------------------------------------------------
Got any questins? Dont hesitate to aske me :)
Bullish Setup on AUD/USD – Are You In?Hi traders ! , Analyzing AUD/USD on the 1H timeframe, spotting a potential long entry :
🔹 Entry: 0.62851
🔹 TP: 0.63934 🎯
🔹 SL: 0.61863 🔻
AUD/USD is respecting the lower boundary of the ascending channel and bouncing off support. If this trend continues, we could see a push toward 0.63934. RSI is neutral, leaving room for further upside.
⚠️ DISCLAIMER: This is not financial advice. Every trader makes their own decision.

10-03-2025 _ Short Term Bullish Idea _ AUDUSD H11- Impulsive move to the up side
2- Followed by slow correction
3- Retracement to 61.8% of Fibo. Retracement
4- Hidden Divergence
5- Bullish Flag Pattern
6- Expect another move to the UP Side.

AUDUSD(20250403)Today's AnalysisToday's buying and selling boundaries:
0.6297
Support and resistance levels:
0.6380
0.6349
0.6329
0.6266
0.6246
0.6215
Trading strategy:
If the price breaks through 0.6266, consider buying, the first target price is 0.6297
If the price breaks through 0.6246, consider selling, the first target price is 0.6215

AUD/USD For Bullishwait for pull-back near by entry point and then go long
general trend is up trend
have fun :)


FXAN & Heikin Ashi Trade IdeaOANDA:AUDUSD
In this video, I’ll be sharing my analysis of AUDUSD, using FXAN's proprietary algo indicators with my unique Heikin Ashi strategy. I’ll walk you through the reasoning behind my trade setup and highlight key areas where I’m anticipating potential opportunities.
I’m always happy to receive any feedback.
Like, share and comment! ❤️
Thank you for watching my videos! 🙏

AUDUSDAUDUSD is showing a bearish structure on the daily chart and now is the right to time to start selling. I am targeting 0,6 and below

DeGRAM | AUDUSD back in the channelAUDUSD is in an ascending channel above the trend lines.
The price is moving from the support level and has already returned to the channel.
The chart has formed a harmonic pattern and is now holding above the 38.2% retracement level.
The 30m Timeframe indicators have formed a hidden bearish divergence.
We expect the growth to continue after the retest of the lower channel boundary.
-------------------
Share your opinion in the comments and support the idea with like. Thanks for your support!

AUD/USD - Confirmed Strong Bullish TrendHi all,
Been having a very solid week and thank you all for the Support.
Currently we have had a lovely push off this Support pushing into the 4th wave of Elliot's Wave.
On higher TF price is displaying that all corresponding time frames have swept sell side Liquidity meaning we are bullish and looking to stay bullish..
With this amount of volume in todays market I would expect there to be alot of volatility over the next 24 hours and within that time I will be looking for a strong pull back towards the Support/Resistance area.
Targets are Buy side Liquidity
Good luck to all the traders that decide to follow

AUDUSD small buyAs you saw Trumps tarrifs everything went massive up , i could see audusd still heading upwards, but time will tell, risky buy , but let's hope for the best, wish you luck !
2 RRR
GL Traders
Not Advice !

Inverse head and shoulders AUDUSD - ENTRY
03/04/2025
INVERSE HEAD AND SHOULDERS
FIB 78.6
CLEAN BULLISH WICK 3PIN
AUD/USD trades in negative territory near 0.6280 in Thursday’s early Asian session.
China will face a 54% tariff under the new Trump policy, weighing on the Aussie.
China’s Caixin Services PMI climbed to 51.9 in March, stronger than expected.
The AUD/USD pair remains under selling pressure around 0.6280 during the early Asian session on Thursday. The Australian Dollar (AUD) pares losses against the Greenback after the stronger Chinese economic data. However, the upside might be limited as US President Donald Trump announced sweeping global reciprocal tariffs, prompting traders to turn cautious.
The Trump administration on Wednesday announced that the US will impose a 10% baseline tariff on all imports to the United States (USD) and slap additional duties on around 60 nations with the largest trade imbalances with the US. China was hit hard, facing a tariff of at least 54% on many goods. The policy announcement prompted traders to go into risk-off mode and exert some selling pressure on the Aussie as China is a major trading partner to Australia.

AUDUSD Tap Reading/ Trading Math Analysis Reversal Predictions BDear Trader,
Please find attached my analysis of $Subject, which uses mathematical calculations to identify potential reversal times and price levels.
The analysis details projected south and north price targets (horizontal lines on the chart), along with estimated time frames for possible reversals (vertical lines on the chart, accurate to within +/- 1-2 candles). Please note that all times indicated on the chart, including the vertical lines representing potential reversal times, are based on the UTC+4 time zone.
To increase the probability of these analysis, I recommend monitoring the 5-minute and 15-minute charts for the following key reversal candlestick patterns:
Doji’s
Hammer/Inverted Hammer
Double/Triple Bottom/Top
Shooting Star
Morning Star
Hanging Man
I welcome your feedback on this analysis, as it will inform and enhance my future research.
3rd Apr12:05 PM
3rd Apr 4:30 PM
3rd APr 6:10 PM
3rd APr 6:30 PM
3rd Apr 10:25PM
4th Apr 2:10 AM to 2:30 AM
4th 4:30 AM to 5:35 AM
4th 10:30 AM
Regards,
Shunya Trade
⚠️ Disclaimer: This post is educational content and does not constitute investment advice, financial advice, or trading recommendations. The views expressed here are based on technical analysis and are shared solely for informational purposes. The stock market is subject to risks, including capital loss, and readers should exercise due diligence before investing. We do not take responsibility for decisions made based on this content. Consult a certified financial advisor for personalized guidance.

Aussie H4 | Overlap resistance at 78.6% Fibonacci projectionThe Aussie (AUD/USD) is rising towards an overlap resistance and could potentially reverse off this level to drop lower.
Sell entry is at 0.6324 which is an overlap resistance that aligns with the 78.6% Fibonacci projection.
Stop loss is at 0.6370 which is a level that sits above the 127.2% Fibonacci extension, 100% projection and a swing-high resistance.
Take profit is at 0.6264 which is a swing-low support.
High Risk Investment Warning
Trading Forex/CFDs on margin carries a high level of risk and may not be suitable for all investors. Leverage can work against you.
Stratos Markets Limited (www.fxcm.com):
CFDs are complex instruments and come with a high risk of losing money rapidly due to leverage. 63% of retail investor accounts lose money when trading CFDs with this provider. You should consider whether you understand how CFDs work and whether you can afford to take the high risk of losing your money.
Stratos Europe Ltd (www.fxcm.com):
CFDs are complex instruments and come with a high risk of losing money rapidly due to leverage. 63% of retail investor accounts lose money when trading CFDs with this provider. You should consider whether you understand how CFDs work and whether you can afford to take the high risk of losing your money.
Stratos Trading Pty. Limited (www.fxcm.com):
Trading FX/CFDs carries significant risks. FXCM AU (AFSL 309763), please read the Financial Services Guide, Product Disclosure Statement, Target Market Determination and Terms of Business at www.fxcm.com
Stratos Global LLC (www.fxcm.com):
Losses can exceed deposits.
Please be advised that the information presented on TradingView is provided to FXCM (‘Company’, ‘we’) by a third-party provider (‘TFA Global Pte Ltd’). Please be reminded that you are solely responsible for the trading decisions on your account. There is a very high degree of risk involved in trading. Any information and/or content is intended entirely for research, educational and informational purposes only and does not constitute investment or consultation advice or investment strategy. The information is not tailored to the investment needs of any specific person and therefore does not involve a consideration of any of the investment objectives, financial situation or needs of any viewer that may receive it. Kindly also note that past performance is not a reliable indicator of future results. Actual results may differ materially from those anticipated in forward-looking or past performance statements. We assume no liability as to the accuracy or completeness of any of the information and/or content provided herein and the Company cannot be held responsible for any omission, mistake nor for any loss or damage including without limitation to any loss of profit which may arise from reliance on any information supplied by TFA Global Pte Ltd.
The speaker(s) is neither an employee, agent nor representative of FXCM and is therefore acting independently. The opinions given are their own, constitute general market commentary, and do not constitute the opinion or advice of FXCM or any form of personal or investment advice. FXCM neither endorses nor guarantees offerings of third-party speakers, nor is FXCM responsible for the content, veracity or opinions of third-party speakers, presenters or participants.

AUDUSD Setup – Sell into Strength We look to Sell at 0.628
The primary trend is still bearish, and although we’re seeing a short-term bounce, rallies are likely to be capped near 0.628, which lines up with bespoke resistance and yesterday’s high.
🔽 Preferred Trade:
Sell into rallies toward 0.628
🎯 Targets:
First support: 0.625
Second support: 0.623
Momentum remains in favor of the bears unless price breaks above that resistance zone. We trade what we see—not what we feel.

What Is an ABCD Pattern, and How Can You Use It in Trading?What Is an ABCD Pattern, and How Can You Use It in Trading?
Are you looking to improve your trading strategy and technical analysis skills? The ABCD trading pattern may be just what you need. This tool may help you identify potential market reversals and decide when to enter a trade. Keep reading to learn more about the ABCD pattern and how to apply it to your trading strategy.
What Is an ABCD Pattern?
The ABCD pattern is one of the basic harmonic patterns. It gives traders an idea of where the market might reverse. Therefore, when combined with other forms of technical analysis, it may be a great addition to your trading arsenal.
The ABCD pattern comprises two legs, AB and CD, and one retracement, BC, with D as an entry point. More specifically, an ABCD can be identified by:
- AB Leg: A trend starts at A and makes a high or low at B.
- BC Retracement: The price retraces from B to C.
- CD Leg: The trend continues from C to D.
- D Entry Point: Once another high or low forms and traders enter at D.
These price movements create the “zig-zag” or “lightning bolt” shapes.
In fact, ABCD patterns are present across every market and every timeframe. The up-down movements in financial assets represent opportunities to identify and trade ABCD patterns.
Why Use the ABCD Pattern in Your Trading Strategy?
Before we move on to identifying and trading the ABCD pattern, it’s worth explaining why you might want to consider using it. Here are a few reasons traders favour the ABCD pattern:
- It’s one of the harmonic patterns suitable for traders of all experience levels.
- It’s versatile and works for stocks, commodities, and cryptocurrencies*, not just forex trading.
- Traders use ABCD patterns to make informed decisions about potential turning points in the market.
- It can form the basis of a working trading strategy if used correctly alongside other forms of technical analysis.
- It provides quite an effective risk/reward ratio if reversals are caught.
How Traders Identify an ABCD Trading Pattern
The first step in finding ABCDs is to look for that classic zig-zag shape. Once you’ve found one, it’s time to apply Fibonacci ratios to confirm the pattern. If you’re struggling, you can consider using pre-made ABCD pattern indicators or scanners to help your eyes get used to spotting them.
The ABCD pattern requires that the BC leg is between a 38.2% to 78.6% retracement of AB, ideally between 61.8% and 78.6%. This means that if you put a Fibonacci retracement tool at A and B, C should be between 0.382 and 0.786.
The second CD leg should be a 127.2% to 161.8% extension of the BC retracement. For extra confirmation, consider specifying that AB is equal to the same length as CD.
While it can be tempting to start trading based on these conditions, you’ll find that, in practice, identifying point D can be trickier than it seems. That’s why traders typically use Fibonacci ratios, key levels, candlestick patterns, and higher timeframe convergence to confirm their entries, which we will touch on shortly.
ABCD Pattern Examples
Now that we understand how to identify the ABCD pattern, we can start applying it to real price action.
Note that the ratios won’t always be perfect, so allowing for slight variability above or below the defined ratios is acceptable.
Bullish ABCD Pattern
For a bullish formation, the following must be present:
- The AB leg should be between the high A and low B.
- The BC bullish retracement should be between the low B and high C, which is below the high A.
- The CD leg should be between the high C and low D.
- BC is a 38.2% to 78.6% retracement of AB, preferably between 61.8% and 78.6%.
- CD is a 127.2% to 161.8% extension of BC.
Additionally, you may look for AB to be an identical or similar length to CD.
Entry: Traders set a buy order at D.
Stop Loss: The theory suggests traders place a stop below a nearby support level or use a set number of pips.
Take profit: Traders place take-profit orders at the 38.2%, 50%, or 61.8% retracement of CD or hold for higher prices if they believe there’s the potential for further bullishness.
Bearish ABCD Pattern
The bearish ABCD chart pattern is essentially the same, just with the reversed highs and lows. As such:
- The AB leg should be between the low A and high B.
- The BC bullish retracement should be between the high B and low C.
- The CD leg should be between the low C and high D.
- BC is a 38.2% to 78.6% retracement of AB, preferably between 61.8% and 78.6%.
- CD is a 127.2% to 161.8% extension of BC.
You can choose to apply the same AB = CD rules in a bearish ABCD pattern if desired.
Entry: Traders typically place a sell order at D.
Stop Loss: A stop may be placed above a nearby resistance level or at a set number of pips.
Take profit: Traders often take profits at the 38.2%, 50%, or 61.8% retracement of CD or hold for lower prices if there’s a bearish trend on a higher timeframe.
ABCD Pattern Strategy
A momentum-based ABCD trading strategy can help traders confirm potential reversals by incorporating indicators like the RSI (Relative Strength Index). This approach often adds an extra layer of confluence.
Entry
- Traders may wait for point D to form and for the RSI to indicate overbought or oversold conditions, typically above 80 or below 20.
- Additional confirmation can be sought if there is a divergence between price and RSI, signalling weakening momentum.
- Once the RSI crosses back into normal territory, it can suggest a reversal, providing an opportunity to enter the market.
Stop Loss
- A stop loss is often placed slightly above or below point D, depending on whether the formation is bearish or bullish, respectively. This helps potentially manage risk in case the reversal doesn’t hold.
Take Profit
- Traders can consider taking profits at Fibonacci retracement levels of leg CD, such as 38.2%, 50%, or 61.8%.
- Another common target is point C, but traders may also hold the position for longer if further price movement is anticipated.
Looking for Additional Confluence
Given that trading the ABCDs usually relies on setting orders at specific reversal points, consider looking for extra confirmation to filter potential losing trades. Below, you’ll find three factors of confluence you can use to confirm your entries.
Key Levels
If your analysis shows that D is projected to be in an area of significant support or resistance, there’s a greater chance that the level will hold and the price will reverse in the way you expect.
ABCD Timeframe Convergence
One technique to potentially enhance the reliability of ABCD chart patterns is to check for multiple timeframes. When you identify the formation on a lower timeframe—say, the 5-minute chart—you can then look to a higher timeframe chart, such as the 30-minute or 1-hour chart to see the overall trend.
If the pattern converges with the longer-term trend, it strengthens the analysis and increases the likelihood of an effective trade.
Candlestick Patterns
Some traders look for particular candlestick patterns to appear. The hammer and shooting star patterns are commonly used by ABCD traders for extra confirmation, as are tweezer tops/bottoms and engulfing candles. You could choose to wait for one of these candlesticks to form before entering with a market order.
Common Mistakes to Avoid When Identifying an ABCD Chart Pattern
Of course, ABCD patterns aren’t a silver bullet when it comes to effective trading. There are several common mistakes made by inexperienced traders when trading these types of patterns, such as:
- Confusing the ABCD with other harmonic patterns, like the Gartley or three-drive pattern.
- Trading every potential ABCD formation they see. It’s preferable to be selective with entries and look for confirmation.
- Not being patient. ABCDs on higher timeframes can take days, even weeks, to play out.
Experienced traders wait for the pattern to develop before making a trading decision.
- Ignoring key levels. Instead, you could allow them to guide your trades and look for the ABCD pattern in these areas.
The Bottom Line
The ABCD pattern is a versatile tool that can enhance a trader’s ability to identify potential market reversals and refine their overall strategy. When combined with other forms of technical analysis, such as momentum indicators, an ABCD trading strategy can be an invaluable addition to your trading arsenal.
For traders looking to apply the ABCD pattern in forex, stock, commodity, and crypto* markets, consider opening an FXOpen account and take advantage of low-cost, high-speed trading across more than 600 assets. Good luck!
FAQ
What Is an ABCD Trading Pattern?
The ABCD trading pattern is a simple harmonic pattern used by traders to identify potential market reversals. It consists of three price movements: the AB leg, BC retracement, and CD leg, with point D marking a potential entry for a reversal trade. It helps identify changes in trend direction.
How Can You Use the ABCD Pattern in Trading?
Traders identify the ABCD pattern by finding the characteristic zig-zag shape and using Fibonacci ratios to confirm it. Entry points are typically placed at point D, with stop losses and profit targets based on the formation’s structure. Confluence with other technical analysis tools improves its reliability.
Is the ABCD Pattern Bearish or Bullish?
The ABCD pattern can be either bearish or bullish. A bullish ABCD indicates a potential upward reversal, while a bearish ABCD suggests a downward reversal. The structure remains the same, but the highs and lows are reversed.
What Is the ABCD Strategy?
The ABCD strategy revolves around identifying trend reversals using the formation and confirming entry points through tools like Fibonacci retracements or momentum indicators like the RSI for added accuracy.
*At FXOpen UK, Cryptocurrency CFDs are only available for trading by those clients categorised as Professional clients under FCA Rules. They are not available for trading by Retail clients.
This article represents the opinion of the Companies operating under the FXOpen brand only. It is not to be construed as an offer, solicitation, or recommendation with respect to products and services provided by the Companies operating under the FXOpen brand, nor is it to be considered financial advice.

AUD/USD Daily Time Frame (DTF) AnalysisAUD/USD Daily Time Frame (DTF) Analysis
The AUD/USD pair remains in a downtrend, recently breaking below the minor key support level at 0.62900. However, after this breakdown, sellers failed to drive the price lower toward the next key support, leading to a retracement towards the minor resistance level at 0.63500. This area has formed a double top pattern, signaling potential price reversal and strengthening the bearish outlook.
With price currently trading below key levels, our strategy remains focused on anticipating liquidity formation between these two minor key levels. We plan to wait for a retracement towards the previous support level before executing a sell limit order at 0.62700, with a stop-loss (SL) set at 0.63870, placed above the liquidity zone, and a take-profit (TP) target at 0.59910, aligned with the next major support level.
Fundamental Outlook: Key Developments Impacting the AUD
Impact of U.S. Tariffs: On April 3, 2025, President Donald Trump announced a 10% baseline tariff on all imports, escalating global trade tensions. This announcement triggered a sharp sell-off in risk assets, leading to a 2% decline in the Australian Securities Exchange (ASX) 200 index. Export-driven stocks, such as Ansell and Breville Group, were particularly affected. In response, the Australian dollar depreciated as investors shifted toward safe-haven currencies like the Japanese yen and Swiss franc. (Source: Reuters)
Market Volatility and Risk Aversion: The imposition of these tariffs has heightened concerns about a potential global economic slowdown, prompting investors to move away from risk-sensitive assets, including the AUD. The resulting risk-off sentiment has contributed to further weakness in the Australian dollar, as market participants continue to favor safer currency alternatives amid heightened geopolitical and economic uncertainty.
📌 Disclaimer:
This analysis is for informational and educational purposes only and should not be considered financial advice. Trading involves substantial risk, and past performance is not indicative of future results. Always conduct your own research and consult with a financial professional before making any investment decisions.

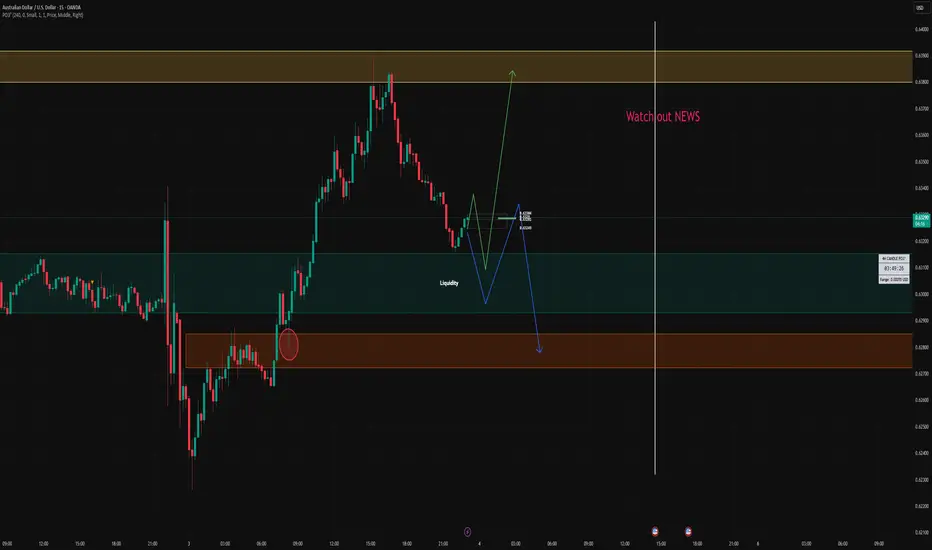
Smart Money Play with Extreme POI MitigationTimeframe: 4H
Risk-Reward: 4.66R (~5R)
Entry Type: Smart Money Concept (SMC) Supply & Demand
In this trade, I took a buy position after identifying a bullish market structure on the 4-hour timeframe. I mapped out two Points of Interest (POIs):
1. A close POI – a nearer demand zone where I initially looked for a reaction.
2. An extreme POI – a deeper demand zone where price could mitigate before continuing bullish.
Trade Progression:
Initially, price tapped into the close POI but failed to hold, leading to liquidity sweep and stop-loss breach.
Price then moved further down to my extreme POI, where it found strong support and reversed.
A major news event on USD acted as a catalyst, driving price swiftly to my Take Profit (TP) level.
Key Takeaways:
✔ Liquidity Grab: The stop hunt at the close POI cleared weak buyers before moving in the intended direction.
✔ Extreme POI Respect: Smart money often mitigates deeper institutional zones before continuing trend direction.
✔ News-Driven Volatility: The USD event accelerated price movement, hitting my TP faster than expected (~5R trade).
This trade perfectly aligns with Smart Money Concepts (SMC) and liquidity dynamics, reinforcing the importance of patience and POI selection.
What’s your outlook on AUD/USD for the coming sessions? Share your thoughts below!
#AUDUSD #SMC #ForexTrading #Liquidity #POI #PriceAction #SmartMoney

Australian dollar rally continues, Trump tariffs loomThe Australian dollar has posted strong gains for a second straight day. In the European session, AUD/USD is trading at 0.6306, up 0.47% on the day.
The Reserve Bank of Australia maintained the cash rate at 4.10% on Tuesday, in a move that was widely expected by markets. Still, the Australian dollar reacted positively, gaining 0.48% on Tuesday.
The RBA statement noted that underlying inflation continued to ease in line with the Bank's forecast, but the Board "needs to be confident that this progress will continue" so that inflation remains sustainable at the midpoint of the 2%-3% target band. The statement said there was "significant" uncertainty over global trade developments, pointing to the threat of further US tariffs and possible counter-tariffs from targeted countries.
The central bank's decision was made in the midst of a hotly contested election campaign, and a rate cut would likely have been attacked by the opposition parties as political interference.
In a press conference after the meeting, Governor Michele Bullock acknowledged the uncertainty over the global outlook due to US trade policy but sought to assure the markets by saying that Australia was "well placed" to weather the potential storm of a global trade war.
US President Trump has not specifically targeted Australia with any tariffs but China is Australia's number one trading partner and a US-China trade war would inflict damage on Australia's economy.
The new US tariffs are expected to be announced later today and take effect on Thursday. The financial markets remain volatile as investors look for some clarity from Washington about the tariffs, as it remains unclear which countries will be targeted and the extent of the tariff rates.

Falling towards pullback support?AUD/USD is falling towards the support level which is an overlap support that lines up with the 50% Fibonacci retracement and could bounce from this level to our take profit.
Entry: 0.6270
Why we like it:
There is an overlap support level that lines up with the 50% Fibonacci retracement.
Stop loss: 0.6236
Why we like it:
There is a pullback support level
Take profit: 0.6329
Why we like it:
There is a pullback resistance level that lines up with the 61.8% Fibonacci retracement.
Enjoying your TradingView experience? Review us!
Please be advised that the information presented on TradingView is provided to Vantage (‘Vantage Global Limited’, ‘we’) by a third-party provider (‘Everest Fortune Group’). Please be reminded that you are solely responsible for the trading decisions on your account. There is a very high degree of risk involved in trading. Any information and/or content is intended entirely for research, educational and informational purposes only and does not constitute investment or consultation advice or investment strategy. The information is not tailored to the investment needs of any specific person and therefore does not involve a consideration of any of the investment objectives, financial situation or needs of any viewer that may receive it. Kindly also note that past performance is not a reliable indicator of future results. Actual results may differ materially from those anticipated in forward-looking or past performance statements. We assume no liability as to the accuracy or completeness of any of the information and/or content provided herein and the Company cannot be held responsible for any omission, mistake nor for any loss or damage including without limitation to any loss of profit which may arise from reliance on any information supplied by Everest Fortune Group.

01-04-2025 _ Short Term Bullish Idea _ AUDUSD M151- Price has reached 50% of Fibo Retracement of the last move UP.
2- Price has bounced from a Support / Resistance Zone.
3- No Divergence against.
There, one can expect a move to the up side.
