USDAUD trade ideas

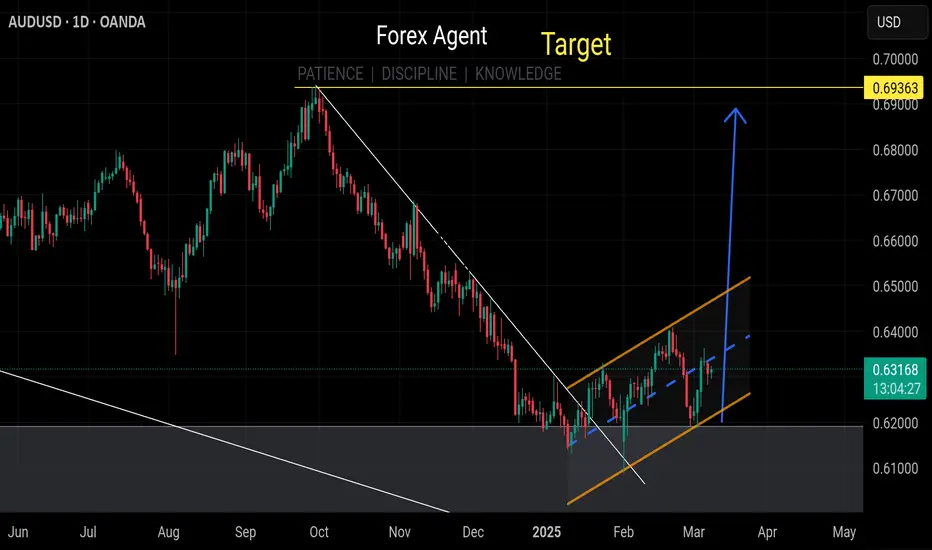
AUD/USD - Trade IdeaHere we are currently looking at long positions, this can also been considered as a breakout Trade.
We have a Liquidity Trend Line that we are respecting.
We are currently in short sell positions into the two possible demand zones. I would prioritise our second Demand zone as that would be between our 71% level.
From there I will be looking for long Term Breakout trades

AUDUSD - Trade IdeaHi everyone! The AUD/USD looks bearish on the daily and 4-hour time frames and is following a downtrend momentum. After creating a CHoCH and BOS on the 1-hour time frame, I decided to short this trade when it retests the 15 OB. Below is my trade idea; please conduct your own analysis before entering any trades.
Sell limit order
Entry @ 0.63265
SL - 0.63645, 38pips
TP1 - 0.62885, 38pips
TP2 - 0.62500, 76pips
TP3 - 0.61885, 138pips
Have a great trading week ahead

Golden Waves of AUD: Short & Mid-Term Uptrend📈 AUD Analysis on Short & Mid-Term Timeframes
🔍 Although the country remains somewhat ambiguous, the market is correcting upward.
💡 The completion of the ABC wave is expected to further boost the uptrend.
🎯 The key mid-term level is 0.62858; maintaining this level could lead to a continuation of the uptrend towards 0.64400.

Aussie is bearishQM pattern appeared and ichimikou signaled that heading south is probable .our target could be on the fibo level or order block formation .
let's see the result

Daily AU Updates March 11th 2025Hello Traders! Take it easy, not everyday is a trading day. I have not taken any trades on AU recently. Still hunting a swing idea. However, I was able to catch some short scalps on UJ during Asian Session and NY Session.

AUDUSD Under Pressure! SELL!
My dear subscribers,
AUDUSD looks like it will make a good move, and here are the details:
The market is trading on 0.6335 pivot level.
Bias - Bearish
Technical Indicators: Both Super Trend & Pivot HL indicate a highly probable Bearish continuation.
Target - 0.6271
About Used Indicators:
The average true range (ATR) plays an important role in 'Supertrend' as the indicator uses ATR to calculate its value. The ATR indicator signals the degree of price volatility.
———————————
WISH YOU ALL LUCK

AUDUSD buy opportunityHello,
The AUD/USD daily chart presents a compelling bullish setup, signaling a potential trend reversal. Price is currently reacting from a strong support zone between 0.6187 and 0.6200, where buyers are stepping in. This zone aligns with previous demand areas and a possible trendline support, adding to its significance. A symmetrical triangle pattern is also forming, with price bouncing from the lower trendline. A breakout above the upper trendline could confirm a bullish continuation.
Additionally, Fibonacci retracement levels from the previous downtrend indicate that the 23.6% level near 0.6297 is acting as initial resistance. If broken, the key upside targets include the 61.8% level at 0.6619 and the 70% level at 0.6689, aligning with a strong resistance zone. The first major take-profit target stands at 0.6689, with a secondary target at 0.6945, the previous major high.
For trade execution, an ideal buy entry ranges from 0.6200 to 0.6250, with a stop loss set below 0.6180. Traders should watch for confirmation through a breakout or additional bullish candlestick patterns before entering. Given the prolonged downtrend, this setup suggests a potential trend reversal, making it a high-probability trade if the technicals play out as expected.
Disclosure: I am part of Trade Nation's Influencer program and receive a monthly fee for using their TradingView charts in my analysis.

Different Ways to Manage Your TradesFinding the perfect trade setup is just one part of the equation. How you manage that trade can be the difference between consistent profits and missed opportunities. In this video, I’ll break down the different ways you can manage your trades and how each method impacts your results.
We’ll cover essential trade management techniques, including setting fixed take-profits and stop-loss levels, using trailing stops to lock in gains, scaling out of positions with partial profits, and actively monitoring trades for dynamic adjustments. Each method has its own strengths and weaknesses, and the key is finding what aligns with your trading style, risk tolerance, and market conditions.
I’ll also share insights on how I utilize trade management to maximize returns while keeping risk under control. Whether you prefer a hands-off approach or actively managing your trades in real time, this video will help you refine your execution and make smarter decisions.
Watch the full breakdown now, and let me know in the comments, how do you manage your trades?
- R2F Trading

#051 Trust The Process AUDUSD 1610SGT 11032025Selling the Resistance on the main account but on oanda mt4 I am buying.
it seems that overall trend is down currently on the 15 Minutes but who cares
1611SGT 11032025

Falling towards 61.8% Fibonacci support?The Aussie (AUD/USD) is falling towards the pivot and could bounce to the 1st resistance which acts as a pullback resistance.
Pivot: 0.6245
1st Support: 0.6184
1st Resistance: 0.6329
Risk Warning:
Trading Forex and CFDs carries a high level of risk to your capital and you should only trade with money you can afford to lose. Trading Forex and CFDs may not be suitable for all investors, so please ensure that you fully understand the risks involved and seek independent advice if necessary.
Disclaimer:
The above opinions given constitute general market commentary, and do not constitute the opinion or advice of IC Markets or any form of personal or investment advice.
Any opinions, news, research, analyses, prices, other information, or links to third-party sites contained on this website are provided on an "as-is" basis, are intended only to be informative, is not an advice nor a recommendation, nor research, or a record of our trading prices, or an offer of, or solicitation for a transaction in any financial instrument and thus should not be treated as such. The information provided does not involve any specific investment objectives, financial situation and needs of any specific person who may receive it. Please be aware, that past performance is not a reliable indicator of future performance and/or results. Past Performance or Forward-looking scenarios based upon the reasonable beliefs of the third-party provider are not a guarantee of future performance. Actual results may differ materially from those anticipated in forward-looking or past performance statements. IC Markets makes no representation or warranty and assumes no liability as to the accuracy or completeness of the information provided, nor any loss arising from any investment based on a recommendation, forecast or any information supplied by any third-party.

AUDUSD Potential Bullish Bat PatternOn the 4-hour chart, AUDUSD is in a short-term shock and decline, and the bears have the upper hand. At present, we can pay attention to the area below 0.6207, which is a potential buying position for the bullish bat pattern, and this position is in the previous demand area.

Bullish trendAUDUSD is just starting bullish movement, but is on a retracement level now to retest the resistance that turn support. so I'm taking advantage of that, to SELL and take profit at the support level. From that support level I start looking for a strong BUY. LET'S SEE HOW THE OUTCOME.

AUDUSD - Downward movement to 0.62780Given the bearish order flow on the daily and weekly time frames, CHoCH on the 1H time frame, I think the AUD could move to a strong bottom of the structure after a short and minor upward move. The upward move is just a minor pullback on the 1H time frame.

AUDUSD SELL IS ONAUDUSD was and still BEARISH since beginning of OCTOBER 2024 and the selling presure is still ongoing, these are my target ranging from intraday to long term:
Short Term/Intraday Target: 0.62 to 0.61
Long Term: 0.56(Major Support from the Monthly Time Frame)

audusd 1h audusd with daily in control. we look at 1 hour drop base drop. To consider a short, this zone removed and opposing zone

AUDUSD INTRADAY Key Trading level at 0.6286The AUD/USD currency pair is currently exhibiting a bullish sentiment, supported by the continuation of the longer-term prevailing uptrend. Recent intraday price action shows a period of sideways consolidation near the breakout level, which was previously a resistance zone and has now transitioned into a new support area.
Bullish Scenario:
The key trading level to watch is 0.6286, representing the previous consolidation price range. A corrective pullback from the current levels, followed by a bullish bounce from the 0.6286 support level, could trigger upside momentum targeting:
0.6365 - Immediate resistance level
0.6385 - Secondary resistance level
0.6408 - Longer-term resistance level
Bearish Scenario:
Alternatively, a confirmed loss of the 0.6286 support level, accompanied by a daily close below that point, would invalidate the bullish outlook. This scenario may lead to further retracement and a potential retest of lower support levels at:
0.6240 - Initial downside support
0.6200 - Deeper support level
Conclusion:
Traders should closely monitor the 0.6286 level for potential bullish bounce signals or a breakdown confirmation. A successful bounce could favor long positions targeting higher resistance levels, while a breakdown would shift the bias to short positions, aiming for deeper retracement zones. Proper risk management and trend validation are essential to mitigate potential false breakouts.
This communication is for informational purposes only and should not be viewed as any form of recommendation as to a particular course of action or as investment advice. It is not intended as an offer or solicitation for the purchase or sale of any financial instrument or as an official confirmation of any transaction. Opinions, estimates and assumptions expressed herein are made as of the date of this communication and are subject to change without notice. This communication has been prepared based upon information, including market prices, data and other information, believed to be reliable; however, Trade Nation does not warrant its completeness or accuracy. All market prices and market data contained in or attached to this communication are indicative and subject to change without notice.

Idea on a TradeThe Australian dollar has rallied slightly during the trading session on Monday as we continue to dance around the 50 day EMA. However, the 50 day EMA of course, has been an area that the market comes back and forth from. So, I think we’re still looking at the market as one that is very much stuck in the same range it’s been in for quite some time between the 0.62 level on the bottom, and the 0.64 level on the top.

Fibonacci Retracements - Gauging a Dip in Price Part 2 In a previous post on February 19th, we highlighted 2 ways to gauge the extent of a dip in the price of a particular instrument, after a phase of upside strength. This post outlined concepts related to relatively limited and shallow corrections in price, such as those where prices are moving back down to old highs, or a 10-day moving average. You can find this report on our timeline, so please take a look.
The next challenge comes when the price of a particular instrument sees a more extended up or downside move, then the question becomes, is there anything that might aid us to gauge this type of price activity?
Technical analysts and traders will often use Fibonacci retracements as a tool to identify possible levels of support and resistance in financial markets. However, due to their calculation, these are commonly used when a more extended price move materialises.
The good news is that these are available on the Pepperstone charting system and can be utilised within any timeframe that you may wish to analyse.
Using Fibonacci Retracements:
Whether you are looking at a move to the up or downside, Fibonacci retracements can be helpful to identify support levels that may halt a price sell-off of a particular instrument within an on-going uptrend, or resistance levels that may cap any recovery within an on-going downtrend.
However, if these support or resistance levels are broken on a closing basis, they can also be useful in providing insight into whether there is an increased potential for a more sustained move in the direction of that break.
From a trading standpoint, Fibonacci retracements can provide valuable insights into market behaviour and can assist traders to make more informed decisions. The support and resistance levels they identify may be used to determine potential entry and exit points for trades, as well as areas to set stop-loss and take-profit orders for existing positions.
What to Know About Fibonacci Retracements:
Leonardo Fibonacci was a 12th century mathematician who developed the Fibonacci number sequence. Certain ratios are derived from the sequence, including 0.618, which is also known as the Golden mean. This is an important ratio that occurs throughout art, the natural world and even the human body.
Within financial markets, we use 3 set percentage retracements obtained from ratios within the Fibonacci sequence, to measure the potential extent of price declines or rallies. We use the 38.2%, the 50% (which isn’t a true Fibonacci retracement, but has become accepted by traders, as it highlights half the original move), and the 61.8%.
While there are other percentages available on all charting systems, these are the main one’s technical analysts focus on when looking at potential retracement calculations.
Downside Move: Significant High to Significant Low
In a downside move, we run the Fibonacci retracement from a significant price high to a significant price low. These are levels that stand out to you as being important extremes on the chart of the instrument you are focused on; within whatever timeframe you are analysing.
The Pepperstone charting system will then automatically calculate the 3 set percentages and provide you with 3 potential resistance areas that may cap any upside recovery in price. (See chart above).
Upside Move: Significant Low to Significant High
Within an upside move, we run the Fibonacci retracement analysis from a significant price low to a significant price high. Here the Pepperstone system will automatically calculate 3 potential support areas that may halt any downside correction in price. (See chart above).
Using Retracement Levels to Trade:
While there is no guarantee that Fibonacci retracements will identify support or resistance levels that work every time, they can offer traders levels that are worthwhile monitoring.
This can be useful if an instrument is trading within a confirmed uptrend, and we are looking to use a dip in the price as an opportunity to buy at a lower level.
Or, if an instrument is trading within a downtrend, and we are looking to use any recovery in price as an opportunity to sell at a higher level.
Traders may also use Fibonacci retracements to place stop losses just above the identified resistance level or below the support.
This is because, if for example a 38.2% Fibonacci retracement level is broken on a closing basis, it can highlight the potential of a more sustained move in the direction of the break, which could potentially be to the 50% retracement, and if this is in turn breached, on to the 61.8% level, as seen in the chart above.
In the example above, if the decline in price continued and the 61.8% support was broken on a closing basis, the Fibonacci rule suggests a more sustained phase of price weakness maybe seen towards the significant low used within the original calculation (100% retracement).
If such activity is seen within an on-going downtrend in price, the opposite is true. A sustained rally that closes above the 61.8% potential resistance, could lead to a more sustained phase of price strength towards the significant high originally identified after a downside move in price (100% retracement).
In Conclusion:
Whatever timeframe you utilise on your charts; the Fibonacci retracement can be a useful tool in highlighting support or resistance levels during a correction or recovery phase in price.
Initiating trading decisions as a retracement level is neared, can sometimes offer opportunities to establish a position before the original move is resumed. However, equally, it also allows stop losses to be placed relatively close to an entry point, as confirmed breaks of a retracement level can suggest a price moves may continue further.
The material provided here has not been prepared in accordance with legal requirements designed to promote the independence of investment research and as such is considered to be a marketing communication. Whilst it is not subject to any prohibition on dealing ahead of the dissemination of investment research, we will not seek to take any advantage before providing it to our clients.
Pepperstone doesn’t represent that the material provided here is accurate, current or complete, and therefore shouldn’t be relied upon as such. The information, whether from a third party or not, isn’t to be considered as a recommendation; or an offer to buy or sell; or the solicitation of an offer to buy or sell any security, financial product or instrument; or to participate in any particular trading strategy. It does not take into account readers’ financial situation or investment objectives. We advise any readers of this content to seek their own advice. Without the approval of Pepperstone, reproduction or redistribution of this information isn’t permitted.


AUDUSD Long H4Remember, successful trading relies on proper risk management and a disciplined approach. Use stop-losses to safeguard your assets and carefully plan each trade. Analysis is the key to making informed decisions. Stay updated and continue refining your strategies!