AUDUSD BEARISH(SELL) TECHNICAL SCENARIO.AUD/USD Market Analysis Scenario
Pair: AUD/USD
Bias: Bearish
Entry Consideration: Upon confirmation of rejection or reversal near the resistance zone.
Key Levels
Resistance: 0.64960 (critical supply zone)
1st Target: 0.64200
Final Target: 0.63800
Technical Scenario
The AUD/USD pair is currently trading below a strong resistance at 0.64960, which has acted as a key reversal zone in the recent past. Price action near this level indicates a potential bearish reversal pattern, such as a bearish engulfing, double top, or rejection wicks on higher time frames (H4 or D1).
If the pair fails to break above 0.64960, we can expect a downward movement toward the first support target at 0.64200, where minor demand might provide temporary consolidation. If bearish momentum continues, the pair could head further down to the final target at 0.63800, a previous swing low and stronger demand area.
USDAUD trade ideas

AUD/USD, Are Bull Set for a Breakout ?This analysis dates from the 3rd of May, this is in no way financial advice and should be taken into account in an objective way. Make your own opinion about it, don't take it for granted.
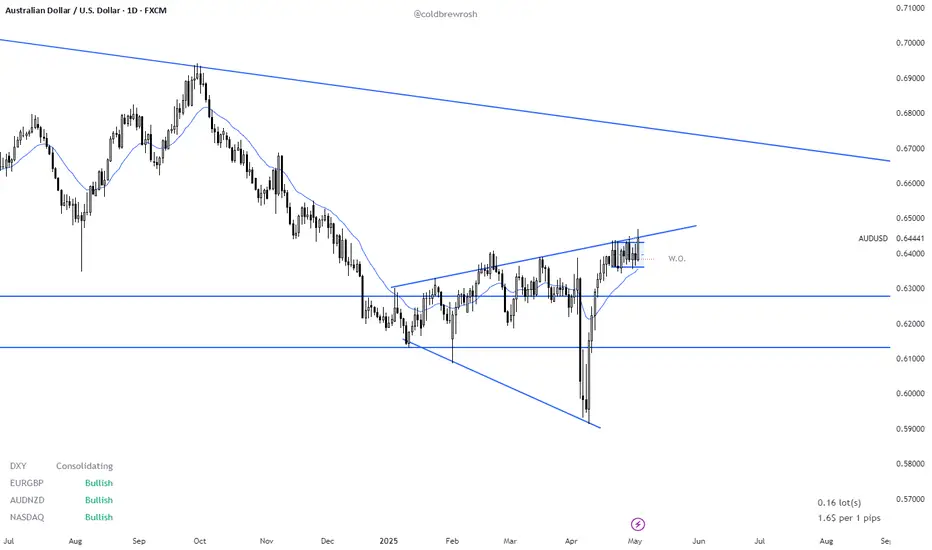
- AUD/USD is trading around the 0.64000 area on the daily chart, it has been consolidating around that area since April 21st following a 7 consecutive bull rally. Where it is heading to next still needs to be determined. Nevertheless, there is a clear Expanding Triangle dating since the start of 2025. (see image attached),(13th January, 03rd of Feb, 09th of April for the lower bar and 27 January, 20th Feb, 17th March, 23rd of April for the upside channel).
- This expanding triangle is similar to the one identified on NZD/USD which had an upside breakout and is now consolidating around the 0.59200.
- Whether there is an upcoming BO on Aussie Dollar is still TBT, but odds slightly favor the bulls following the strong rally in the first half of April. Nevertheless, it has been trading in a trading range since April 21st and there are no confirmed breakout yet. Needs to be closely watched in the coming days!! If bulls manage to get consecutive strong bull bars, this could set the stage for an measured move up for at a minimum a test of the 0.66000 area (downside channel from Feb 2021 to Nov 2024 on the Monthly).
- The Bear reversal case is harder to argue for, as they only managed to get one strong bear bar (04th April), with no follow through selling, The market has been trading for longer on the upper bracket of the extending triangle which means the market participant agree more on higher prices. Stay tuned for further updates !! Peace.
AUDUSD — Potential Long SetupThere’s a key level at 0.6449, which the price is currently approaching. Be mindful of major economic events — they increase uncertainty and can significantly affect the setup.
Invalidation: if price starts to drop below 0.6410.
Target: a breakout above 0.6449.

AUD_USD WILL KEEP GROWING|LONG|
✅AUD_USD is trading in an
Uptrend and the pair made a
Bullish breakout of the key
Horizontal level of 0.6450
And the breakout
Is confirmed so as the pair keeps
Growing we will be expecting a
Further bullish move up
LONG🚀
✅Like and subscribe to never miss a new idea!✅
Disclosure: I am part of Trade Nation's Influencer program and receive a monthly fee for using their TradingView charts in my analysis.

AUDUSD READY TO LAUNCH: HTF Bias + OB + FVG + PRIME SETUPBias:
We’re operating within a clear bullish higher time frame bias, confirmed by previous swing structure and continuous displacement to the upside. Price has consistently made higher highs and higher lows on the 4H and Daily chart.
Entry Zone:
✅ 4H Fair Value Gap (FVG) — a clean imbalance from prior bullish displacement. Price has now retraced into this inefficiency, a key area where smart money typically looks to re-accumulate.
✅ 1H Order Block (OB) — precisely overlapping the 4H FVG, strengthening the setup. This is the last bearish candle before the bullish move that created a market structure shift, now acting as a support zone.
This dual confluence—FVG + OB at a retracement level—marks a premium setup.

Australian dollar hits five-month high after Australian electionThe Australian dollar continues to impress and has posted strong gains on Monday. European session, AUD/USD is trading at 0.6491, up 0.72% on the day and its highest level since early December 2025.
Prime Minister Anthony Albanese cruised to a resounding victory in Saturday's national election. Albanese' centre-left Labor Party increased its majority and thumped the Liberal Party opposition. The coalition's defeat was marked by its leader, Peter Dutton losing his own seat.
The long shadow of US President Donald Trump was a factor in the election. Dutton adopted right-wing policies such as promising tougher immigration laws and establishing a platform to reduce the waste of public funds. The similarities between Dutton and Trump hurt the Liberal leader as many voters were upset with Trump's 10% tariffs on Australia.
At the start of the year, Albanese was trailing badly in the opinion polls. However, he struck a receptive chord among voters on domestic issues such as health care and housing, and benefited from the anti-Trump sentiment, which proved to be a winning recipe.
US nonfarm payrolls, a key gauge of the US labor market, dipped slightly to 177 thousand in April, down from a revised 185 thousand in March. This easily beat the market estimate of 130 thousand. The positive unemployment report points to a resilient labor market which remains strong despite the US economy declining in the first quarter.
The markets have responded by lowering the odds of a rate hike in June to 33%, down sharply from 60% a week ago, according to the CME's FedWatch. The Federal Reserve meets on Wednesday and is virtually certain to maintain the benchmark rate of 4.25%-4.5%.

AUD/USD Key Rejection Zone Identified – Bearish Momentum in PlayPrice recently tested a significant resistance level (R.L) and showed rejection after forming a lower structure (L.S). The bearish pressure is visible as price fails to break above 0.64640 and starts consolidating below the resistance. A clean break below the marked lower support zone (around 0.64116) could signal further downside potential toward the 0.63707 area.
📍 Resistance Holding
📍 Lower High Formed
📍 Eyes on Key Support Break
Chart timeframe: 30 min
Instrument: AUD/USD

The VWAP Blueprint: Your Gateway to Smart Money MovesVWAP: Volume Weighted Average Price
What is VWAP?
VWAP stands for Volume Weighted Average Price. It’s a trading benchmark that gives the
average price an asset has traded at throughout the day, weighted by volume. This makes it
more accurate than a simple moving average, especially for intraday analysis.
Unlike regular moving averages that treat every price equally, VWAP emphasizes price levels
where heavier trading occurred, providing a realistic snapshot of the true average market price institutions and algorithms are interacting with.
The VWAP Bounce + Rejection Entry Strategy helps you enter trades at optimal zones of value
using the Volume-Weighted Average Price (VWAP). This dynamic line acts as a magnet for
price and often becomes a bounce zone when volume aligns.
Instead of guessing support or resistance levels, this strategy lets you use VWAP as a real-
time value guide, waiting for price to pull into it, show rejection, and bounce away with
momentum.
How VWAP Works
The VWAP is calculated cumulatively from the market open:
VWAP = (Cumulative Price × Volume) / Cumulative Volume
With each tick or candle:
Multiply the price by volume.
Add it to the previous cumulative total.
Divide by the total volume so far.
This means VWAP resets daily and builds throughout the session, offering real-time insight
Into what traders are willing to pay based on volume-weighted interest.
Why VWAP Matters
When price pulls back into VWAP and bounces with rejection, it signals that traders are
defending value. Smart money often uses VWAP as a tool for entries or exits. When you align
with that behavior and combine it with a clean rejection candle, you get a high-probability
trade setup that’s based on logic and flow, not emotion.
1. Institutional Benchmark
Institutions and smart money often aim to buy below VWAP (to secure a better-than-average
price) and sell above VWAP. So the line often acts as a magnet or barrier where decisions
cluster.
2. Intraday Bias Gauge
Price above VWAP: Buyers dominate; bullish bias.
Price below VWAP: Sellers control; bearish bias.
3. Support/Resistance & Mean Reversion
VWAP behaves like a dynamic equilibrium level. Price frequently:
Pulls back to VWAP during trends
Here's a clear down trend 50 and 200 ma cross over. Await a pull back to trend or ma for continuation.
Reverts to VWAP in consolidations
Finds support/resistance at or around VWAP
How to Use VWAP in Trading
1. Trend Confirmation
Use VWAP as a bias filter: if price is cleanly above, favor longs if below, favor shorts.
Combine it with higher highs/lows (or lower highs/lows) to validate trend strength.
2. Entry Opportunities
In an uptrend: look for pullbacks to VWAP as a buy zone
In a downtrend: look for retests of VWAP as a short opportunity.
3. Mean Reversion Strategy
If price is far extended from VWAP, and volume shows divergence or exhaustion, consider
fading the move with a target toward VWAP (especially in range-bound sessions).
4. Anchored VWAP
You can anchor VWAP to specific candles, like a major high, low, or news release, to gauge
value zones within a custom context.
Best Timeframes for VWAP
Intraday trading (1min to 15min): Ideal for scalpers and day traders.
VWAP resets daily it’s not designed for swing trading unless you're using anchored VWAP.
Pro Tips
Don’t use VWAP in isolation pair it with:
Market structure (HH/LL, BOS/CHoCH)
Volume spikes or divergence
Liquidity zones (order blocks, FVGs, imbalance)
Session opens (London/NY open confluence)
Use VWAP for confluence with other tools, not as a single trigger.
VWAP is more than just a line it's a window into the heartbeat of the market. It shows where
real money is positioned and whether you’re trading with or against that flow.
Used with structure and context, VWAP becomes a weapon for precision entries, smart risk, and clean execution.
Vwap entry types
1. VWAP Bounce (Mean Reversion Entry)
Best for: Range-bound or early in the session.
Entry: Price pulls back to VWAP and shows signs of rejection (e.g., pin bar, engulfing candle).
Confirmation: Look for confluence with support/resistance, order blocks, or volume spikes.
Stop: Below the recent swing low (if long).
Target: Prior high or key level.
2. VWAP Break and Retest (Trend Continuation)
Best for: Trending markets.
Entry: Price breaks above VWAP with momentum and retests it from the other side.
Confirmation: Lower time frame bullish structure, bullish candle on retest.
Stop: Below VWAP or structure low.
Target: pivot levels or structure high, fib levels.
3. VWAP Reclaim (Reversal Entry)
Best for: Capturing a shift in momentum.
Entry: Price moves below VWAP, then reclaims it (closes back above with strength).
Confirmation: Break of market structure + volume surge
Stop: Below reclaim candle.
Target: Range high or key fib levels.
4. VWAP Confluence with Other Indicators
Combine with:
Moving Averages: e.g., 9, 50 and 200 SMA OR EMA
Fibonacci retracement levels
Order blocks / Liquidity zones
Pivot points
Use VWAP as a dynamic support/resistance level and enter when multiple signals align.
Vwap examples

A Simple breakdown on AUDUSD Let's take a closer look and see how indecisive the AUDUSD is gonna be going back and forth and from my Analysis I'll be capitalizing from every move of the price ...

AUDUSD LONG FORECAST Q2 W19 D5 Y25
AUDUSD LONG FORECAST Q2 W19 D5 Y25
Professional Risk Managers👋
Welcome back to another FRGNT chart update📈
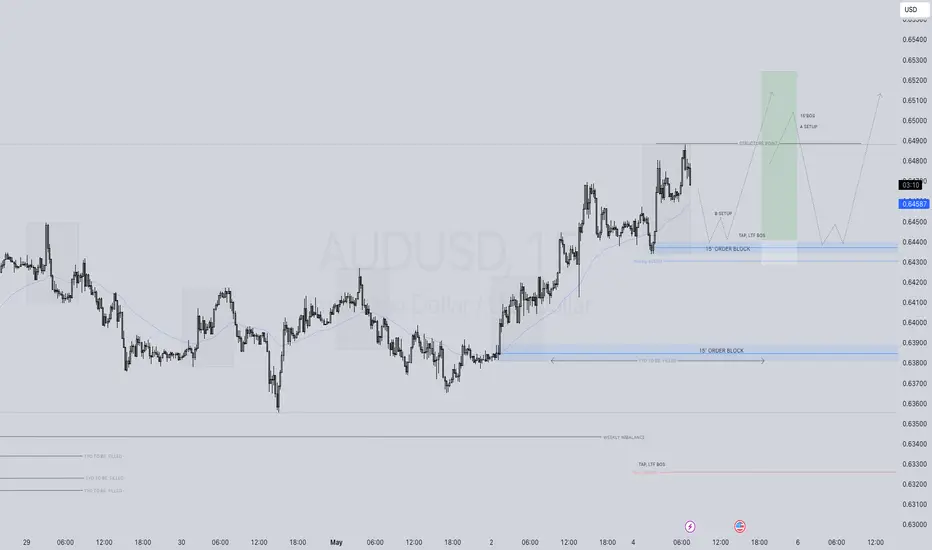
Diving into some Forex setups using predominantly higher time frame order blocks alongside confirmation breaks of structure.
Let’s see what price action is telling us today!
💡Here are some trade confluences📝
✅Weekly 50 EMA
✅Intraday 15' order block
✅Tokyo ranges to be filled
✅Intraday bullish breaks of structure to be confirmed
🔑 Remember, to participate in trading comes always with a degree of risk, therefore as professional risk managers it remains vital that we stick to our risk management plan as well as our trading strategies.
📈The rest, we leave to the balance of probabilities.
💡Fail to plan. Plan to fail.
🏆It has always been that simple.
❤️Good luck with your trading journey, I shall see you at the very top.
🎯Trade consistent, FRGNT X
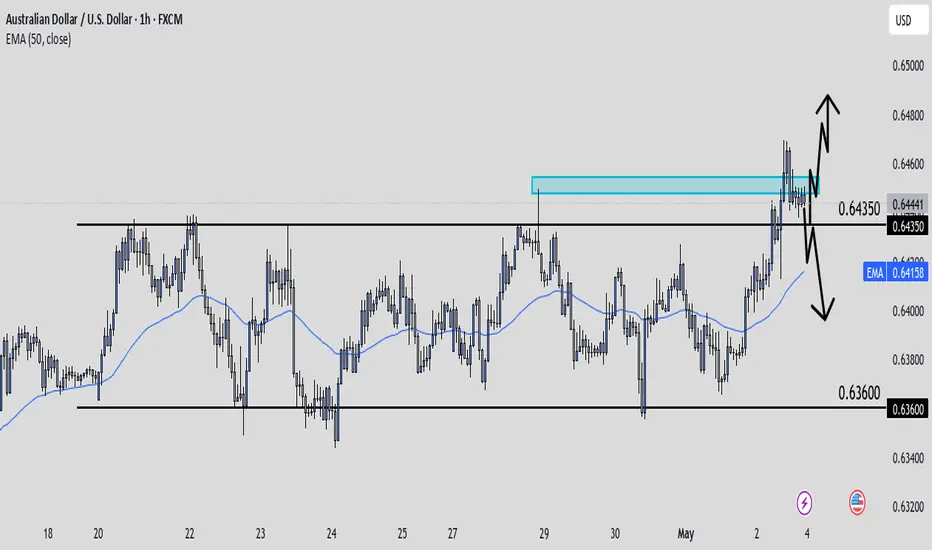
AudUsd Trade IdeaAU is showing a clear range between 64350 and 63600. With last weeks higher time frame closing below the previous high at 64500 I would want to see smaller frames shifting bearish below 64350 to confirm our move to the downside where 63600 could potentially get smacked again in the range continuation.
AUDUSD SHORT FORECAST Q2 W18 D2 Y25AUDUSD SHORT FORECAST Q2 W18 D2 Y25
Professional Risk Managers👋
Welcome back to another FRGNT chart update📈
Diving into some Forex setups using predominantly higher time frame order blocks alongside confirmation breaks of structure.
Let’s see what price action is telling us today!
💡Here are some trade confluences📝
✅Weekly 50 EMA
✅Intraday 15' order block
✅Tokyo ranges to be filled
✅Intraday 15' order block trading levels
🔑 Remember, to participate in trading comes always with a degree of risk, therefore as professional risk managers it remains vital that we stick to our risk management plan as well as our trading strategies.
📈The Xrest, we leave to the balance of probabilities.
💡Fail to plan. Plan to fail.
🏆It has always been that simple.
❤️Good luck with your trading journey, I shall see you at the very top.
🎯Trade consistent, FRGNT

AUDUSD looking Bullish?!!Hello traders I hope you are having a wonderful week!!!
We have this wonderful resistance which we broke out of and now we might be looking at buys.
This resistance has also been a market high for a few days now.
That white line there is my Pivot for next week and it serves as a great spot to put my SL.

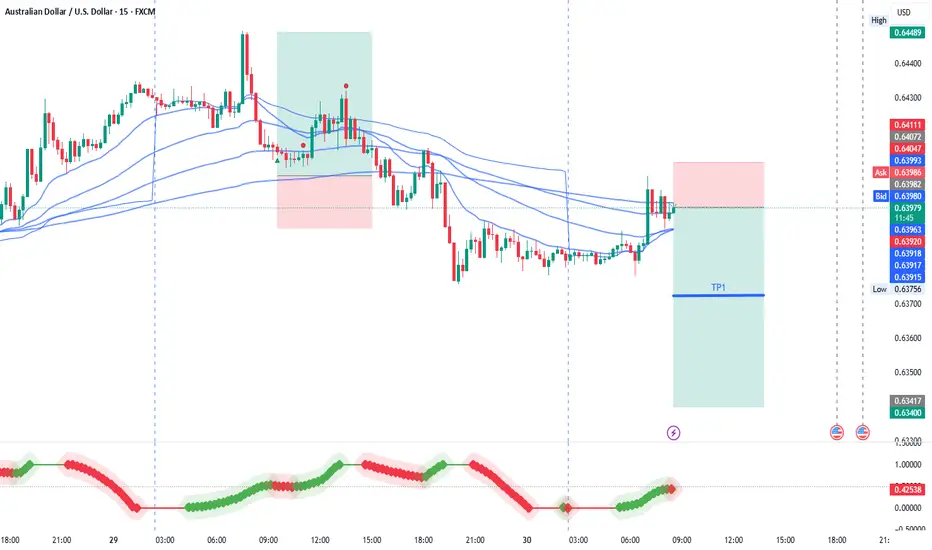
AUDUSD SHORT IDEAUnder current market conditions, the area near 0.6398 has been identified as a critical resistance zone, where the AI model detects a high-probability trade setup.
From a technical perspective, a clear directional bias based on recent price action patterns. Suppose the market demonstrates increased volume and price stability above key moving averages in the 0.6398 area. In that case, traders are advised to monitor for trend-continuation entry opportunities in alignment with the prevailing momentum.
Profit targets are defined at 0.6372 and 0.6344, corresponding to logical technical support zones. These levels are designed for staged profit-taking across different trade management styles. Stop-loss should be strictly enforced at the designated level; once breached, the strategy is considered invalidated in order to limit potential downside.
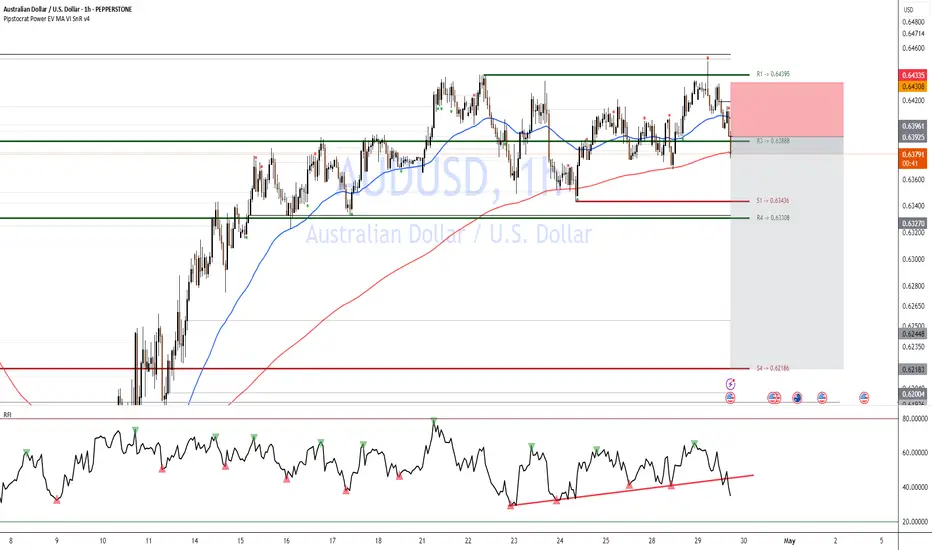
AUSSIE bearish move Short-setup: Breakdown of Support (AUD/USD)
Trigger: Price has decisively broken below R3 (0.63888) and the 200-hour MA (red) on the 1h chart.
Confirmation: RFI just dipped below its ascending trendline and failed to reclaim it—momentum is bearish.
Entry: Short at market 0.6385–0.6380 (just below R3).
Initial Stop: Above R1 (0.64395) ≈ 55 pips stop.
Targets:
T1: S1 (0.63436) (~40 pips → RRR ≈ 1 : 0.7)
T2: R4 (0.63308) (~55 pips → RRR ≈ 1 : 1)
⚡ Highlight: This is a bank-order-flow style fade—selling the break of minor support after a test of the 200-hour MA confluence.
🔑 Rationale
Support→Resistance flip at R3 gives logical entry & SL.
200-hour MA rejection confirms sellers overpowering buyers.
RFI confirms sustained bearish momentum.
High RRR (>1:1) ensures edge even with moderate win-rate.
AUD_USD GROWTH AHEAD|LONG|
✅AUD_USD is trading in an
Uptrend and the pair is
Consolidating above the
Horizontal support level
Around 0.6371 and we are
Already seeing a bullish
Rebound from the level
So we are bullish biased
And we will be expecting
The pair to go further
Up this week
LONG🚀
✅Like and subscribe to never miss a new idea!✅
Disclosure: I am part of Trade Nation's Influencer program and receive a monthly fee for using their TradingView charts in my analysis.

AUDUSD is ready to push againNo comment needed. All information is in the chart analysis.
Steps to follow:
Analyze yourself.
Take the position with SL and Take Profits.
Wait, it may take a couple of days, so take a break and step away from the screen from time to time, just like I do :)
Get the result.
I will update the trade every day.
Like, comment with your good mood or viewpoint, share with your circle. It’s together that we get stronger!
Good trades, Traders!
The golden bear

Bullish rise?The Aussie (AUD/USD0 has bounced off the pivot which is an overlap support and could rise to the 1st resistance that lines up with the 127.2% Fibonacci extension.
Pivot: 0.6361
1st Support: 0.6290
1st Resistance: 0.6536
Risk Warning:
Trading Forex and CFDs carries a high level of risk to your capital and you should only trade with money you can afford to lose. Trading Forex and CFDs may not be suitable for all investors, so please ensure that you fully understand the risks involved and seek independent advice if necessary.
Disclaimer:
The above opinions given constitute general market commentary, and do not constitute the opinion or advice of IC Markets or any form of personal or investment advice.
Any opinions, news, research, analyses, prices, other information, or links to third-party sites contained on this website are provided on an "as-is" basis, are intended only to be informative, is not an advice nor a recommendation, nor research, or a record of our trading prices, or an offer of, or solicitation for a transaction in any financial instrument and thus should not be treated as such. The information provided does not involve any specific investment objectives, financial situation and needs of any specific person who may receive it. Please be aware, that past performance is not a reliable indicator of future performance and/or results. Past Performance or Forward-looking scenarios based upon the reasonable beliefs of the third-party provider are not a guarantee of future performance. Actual results may differ materially from those anticipated in forward-looking or past performance statements. IC Markets makes no representation or warranty and assumes no liability as to the accuracy or completeness of the information provided, nor any loss arising from any investment based on a recommendation, forecast or any information supplied by any third-party.

AUDUSD - BULL FLAG (Bullish)🧠 Technical Overview
Pair: AUD/USD
Timeframe: 4H
Current Price: ~0.63864
General Structure:
Strong prior uptrend leading into a consolidation phase.
Price is forming a classic bull flag pattern (bullish continuation).
Fibonacci extension levels are plotted from the recent impulse leg to project targets.
🔥 Pattern Analysis
Bull Flag:
Parallel, downward-sloping channel following a strong bullish move, indicating healthy retracement.
Price is currently testing the upper boundary of the flag (~0.6394).
Breakout Plan:
Break and close above the flag resistance would confirm bullish continuation.
Immediate target lies at 0.6508 (previous structure high and 1.0 Fibonacci extension).
Higher Fibonacci extension targets are located at:
1.618 Fib ≈ 0.6553
2.0 Fib ≈ 0.6573
2.618 Fib ≈ 0.6622
🔍 Indicators
(Indicators not shown in the image, but inferred from price action):
A breakout supported by higher volume would strengthen confirmation.
RSI pushing above 60 would further confirm bullish momentum.
🧩 Summary
Bias: Bullish
Key triggers:
A strong breakout and close above 0.6394–0.6400.
Retest and continuation move would offer a more conservative entry.
Risk:
Caution required if breakout occurs on low volume.
Invalidation of the setup if price falls below 0.6380 (flag base) or decisively below 0.6318 (key structural support).
✍️ Quick Trade Plan Example
Setup Details
Entry Break and close above 0.6400
Stop Loss Below 0.6380 (or tighter below 0.6368)
Take Profit 1 0.6508
Take Profit 2 0.6553
Take Profit 3 0.6622
Final tip:
If price breaks out impulsively, aggressive entries can be considered. If the breakout is slow and grinding, it would be safer to wait for a pullback and a confirmed bullish rejection.

Long on USD/AUDI am longing USD/AUD from 1.5750
Target 1 - 1.6050
Target 2 - 1.63
I believe we have completed an Elliot wave structure and expect to see upside from this location.
In addition, the stochastic RSI on the daily time frame is oversold.

AUDUSD Will Move Lower! Short!
Take a look at our analysis for AUDUSD.
Time Frame: 1D
Current Trend: Bearish
Sentiment: Overbought (based on 7-period RSI)
Forecast: Bearish
The market is on a crucial zone of supply 0.641.
The above-mentioned technicals clearly indicate the dominance of sellers on the market. I recommend shorting the instrument, aiming at 0.629 level.
P.S
Please, note that an oversold/overbought condition can last for a long time, and therefore being oversold/overbought doesn't mean a price rally will come soon, or at all.
Disclosure: I am part of Trade Nation's Influencer program and receive a monthly fee for using their TradingView charts in my analysis.
Like and subscribe and comment my ideas if you enjoy them!

Shorts BiasThe Australian dollar is currently under pressure against the U.S. dollar, trading below key resistance levels. Recent technical indicators suggest weakening bullish momentum, and upcoming Australian inflation data may increase the likelihood of the Reserve Bank of Australia implementing further rate cuts. This monetary policy outlook adds to the bearish sentiment for the AUD.

AUD-USD Will Keep Growing! Buy!
Hello,Traders!
AUD-USD started the trading
Week with a strong bullish
Move up from the horizontal
Support of 0.6371 while trading
In an uptrend so we are bullish
Biased mid-term and we will
Be expecting a further bullish
Continuation, but its best to
Wait and see how the price
Interacts with the local
Key level of 0.6439 as
We might see a local
Pullback from this supply
Area giving us a better
Entry price for the long
Buy!
Comment and subscribe to help us grow!
Check out other forecasts below too!
Disclosure: I am part of Trade Nation's Influencer program and receive a monthly fee for using their TradingView charts in my analysis.
