AUDUSD SHORT FORECAST Q2 W18 D29 Y25AUDUSD SHORT FORECAST Q2 W18 D29 Y25
Professional Risk Managers👋
Welcome back to another FRGNT chart update📈
Diving into some Forex setups using predominantly higher time frame order blocks alongside confirmation breaks of structure.
Let’s see what price action is telling us today!
💡Here are some trade confluences📝
✅Weekly 50 EMA
✅Intraday 15' order block
✅Tokyo ranges to be filled
✅Intraday 15' order block trading levels
🔑 Remember, to participate in trading comes always with a degree of risk, therefore as professional risk managers it remains vital that we stick to our risk management plan as well as our trading strategies.
📈The rest, we leave to the balance of probabilities.
💡Fail to plan. Plan to fail.
🏆It has always been that simple.
❤️Good luck with your trading journey, I shall see you at the very top.
🎯Trade consistent, FRGNT X
USDAUD trade ideas

AUDUSD BEARISH AUD/USD Bearish Divergence – Sell Setup Pending Confirmation
Description:
AUD/USD is showing signs of weakness as a bearish divergence forms between price and RSI/MACD on the H1/H4 chart. While price makes higher highs, momentum indicators are printing lower highs — suggesting a potential shift in momentum.
🔽 Trade Setup:
Entry: Sell Stop below recent swing low at
Stop Loss: Above recent high at
Take Profit 1: – Prior support zone
Take Profit 2: – Extended fib target or next major support
Risk/Reward: Minimum 1:2 R/R
📉 Technical Confluence:
Bearish Divergence (RSI/MACD)
Key Resistance Zone holding
Rejection Candles / Wicks on higher timeframe
Structure potentially forming Lower High
🔔 Trade Plan:
Waiting for confirmation via sell stop trigger to avoid premature entries. Patience is key — only act if price breaks the structure with momentum. Monitor price action closely around the entry zone.
📊 Timeframe: H1 / H4
📍 Market Bias: Short-term Bearish

[AUDUSD] Trade ideaSwithing bias on this forex pair for a short position now.
Let's see where we can go ...
Great Trade !

AUDUSD in SHORT POSITION.Entered short position after spotting a prominent bearish divergence.
.Confirmed double top formation for added confluence.
.Market has already formed Lower High (LH) and/or Lower Low (LL).
.Conditions aligned and ready for short positioning.

Bearish to fill demandAUDUSD current phase of consolidation ending soon. Will breakout one way or the other but I'm betting bearish.
Noteable supply one at top of consolidation, with massive liquidity grab above. Coming back into this supply after asia session 28th April.
Waiting for confirmation on the drop.
I will be looking for a break in structure to the downside on the 30min and then a retest up to supply before aiming for this demand zone over the long term at 0.60600

check the trendConsidering the price behavior at the current resistance level, possible scenarios have been identified. As long as the price fluctuates above the 38.2% level, the upward trend is likely to continue.

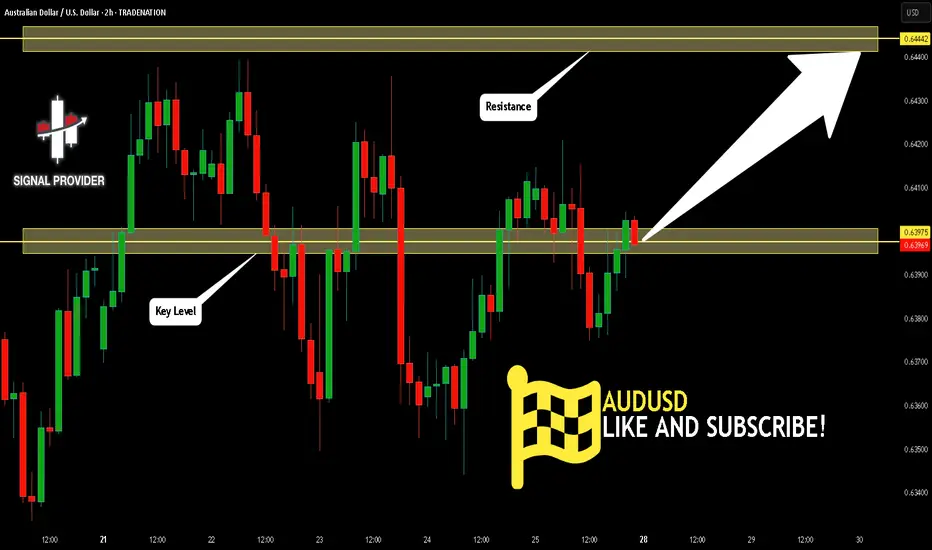
AUDUSD Will Move Higher! Buy!
Take a look at our analysis for AUDUSD.
Time Frame: 2h
Current Trend: Bullish
Sentiment: Oversold (based on 7-period RSI)
Forecast: Bullish
The market is testing a major horizontal structure 0.639.
Taking into consideration the structure & trend analysis, I believe that the market will reach 0.644 level soon.
P.S
The term oversold refers to a condition where an asset has traded lower in price and has the potential for a price bounce.
Overbought refers to market scenarios where the instrument is traded considerably higher than its fair value. Overvaluation is caused by market sentiments when there is positive news.
Disclosure: I am part of Trade Nation's Influencer program and receive a monthly fee for using their TradingView charts in my analysis.
Like and subscribe and comment my ideas if you enjoy them!
AUDUSD Is Showing Bullish PotentialA break above 0.6403 opens the door for a potential long entry, with a target above 0.6439. This setup becomes invalid if price drops below 0.6375.

AUDUSDSwing trade
- possibility of a short position
- rejected and retested off our daily resistance line
- bearish candle sticks
- breaking through the upwards trend line
- breaking through our 15m demand line
- now we wait ( is it a falls breakout?- will it break through and retest and continue towards the demand zone

AUDUSD BEARISH Technically:
AUDUSD printing bearish divergence
AUDUSD printing double top
AUSUSD respecting bearish trendline.

AUDUSD BEARISH Technically:
AUDUSD printing bearish divergence
AUDUSD printing double top
AUDUSD respecting bearish trendline

AUDUSD SHORT FORECAST 5' ORDER BLOCK Q2 W17 D25 Y25 AUDUSD SHORT FORECAST Q2 W17 D25 Y25
Professional Risk Managers👋
Welcome back to another FRGNT chart update📈
Diving into some Forex setups using predominantly higher time frame order blocks alongside confirmation breaks of structure.
Let’s see what price action is telling us today!
💡Here are some trade confluences📝
✅Weekly 50 EMA
✅Intraday bearish breaks of structure
✅Tokyo ranges to be filled
✅5' order block point of interest
✅Previous daily candle bearish close
🔑 Remember, to participate in trading comes always with a degree of risk, therefore as professional risk managers it remains vital that we stick to our risk management plan as well as our trading strategies.
📈The rest, we leave to the balance of probabilities.
💡Fail to plan. Plan to fail.
🏆It has always been that simple.
❤️Good luck with your trading journey, I shall see you at the very top.
🎯Trade consistent, FRGNT X

AUDUSD Will Go Down! Short!
Here is our detailed technical review for AUDUSD.
Time Frame: 1D
Current Trend: Bearish
Sentiment: Overbought (based on 7-period RSI)
Forecast: Bearish
The market is approaching a significant resistance area 0.638.
Due to the fact that we see a positive bearish reaction from the underlined area, I strongly believe that sellers will manage to push the price all the way down to 0.622 level.
P.S
The term oversold refers to a condition where an asset has traded lower in price and has the potential for a price bounce.
Overbought refers to market scenarios where the instrument is traded considerably higher than its fair value. Overvaluation is caused by market sentiments when there is positive news.
Disclosure: I am part of Trade Nation's Influencer program and receive a monthly fee for using their TradingView charts in my analysis.
Like and subscribe and comment my ideas if you enjoy them!

My Thoughts #002Here is an idea 💡
I just think the pair is set to push Lower...
Because the pair then went and made a Choch and meaning that we are moving from bullish pattern to bearish pattern
Anything could invalidate my set up
So use proper risk management
Let's do the most

AUThis isnt a signal just a view, best to wait for TIME and PRICE, let the market show its hand with a sweep of LQ and a valid pd.array mitigation, solid Market structure shift with all this combined u can reduce your doubt and fear...

AUDUSD BuyOverall AUDUSDUSD is currently on a Bullish trend. Price action on the 1hr chart just recently broken a Bearish trendline. On the lower time frame (3 minute) there was a bullish change of character, and price is currently above the 200ema. Market execution buy with SL at recent low.

AUDUSD 30M CHART PATTERNThis second chart is for AUD/USD (30-minute timeframe) and shows a bearish harmonic pattern, likely pointing to a short (sell) trade setup.
Here’s the breakdown:
Red Arrows: Mark resistance levels and potential pattern completion—suggesting a short entry.
Green Zone: Ideal entry area for selling.
Blue Path: Projected price decline after completing the pattern.
**

AUD/USD Recovery Amid Rate Cut ExpectationsHello,
OANDA:AUDUSD shows a slight recovery from multi-year lows, with AUD market expectations of a rate cut by the central bank. The Aussie experiences some relief, but risks remain skewed to the downside as key US inflation reports approach. Further downside is anticipated towards the strong monthly support at 0.600436.
No Nonsense. Just Really Good Market Insights. Leave a Boost
TradeWithTheTrend3344

AUDUSD A Fall Expected! SELL!
My dear subscribers,
My technical analysis for AUDUSD is below:
The price is coiling around a solid key level - 0.6418
Bias - Bearish
Technical Indicators: Pivot Points High anticipates a potential price reversal.
Super trend shows a clear sell, giving a perfect indicators' convergence.
Goal - 0.6412
About Used Indicators:
By the very nature of the supertrend indicator, it offers firm support and resistance levels for traders to enter and exit trades. Additionally, it also provides signals for setting stop losses
Disclosure: I am part of Trade Nation's Influencer program and receive a monthly fee for using their TradingView charts in my analysis.
———————————
WISH YOU ALL LUCK

AUDUSD Short Position IdeaUnder current market conditions, the area near 0.6407 has been identified as a critical resistance zone, where the AI model detects a high-probability trade setup.
From a technical perspective, a clear directional bias based on recent price action patterns. If the market demonstrates increased volume and price stability above key moving averages in the 0.6407 area, traders are advised to monitor for trend-continuation entry opportunities in alignment with the prevailing momentum.
Profit targets are defined at 0.6367 and 0.6333, corresponding to logical technical support zones. These levels are designed for staged profit-taking across different trade management styles. Stop-loss should be strictly enforced at the designated level; once breached, the strategy is considered invalidated in order to limit potential downside.

SELL AUDUSDAUDUSD seems to be following this channel for now. Price is currently bearish, I would like to see a visit to the falling trend line support

AUDUSD SHORT FORECAST Q2 W18 D28 Y25AUDUSD SHORT FORECAST Q2 W18 D28 Y25
Professional Risk Managers👋
Welcome back to another FRGNT chart update📈
Diving into some Forex setups using predominantly higher time frame order blocks alongside confirmation breaks of structure.
Let’s see what price action is telling us today!
💡Here are some trade confluences📝
✅Weekly 50 EMA
✅Intraday 15' order block
✅Tokyo ranges to be filled
✅Intraday 5' & 15' order block trading levels
🔑 Remember, to participate in trading comes always with a degree of risk, therefore as professional risk managers it remains vital that we stick to our risk management plan as well as our trading strategies.
📈The rest, we leave to the balance of probabilities.
💡Fail to plan. Plan to fail.
🏆It has always been that simple.
❤️Good luck with your trading journey, I shall see you at the very top.
🎯Trade consistent, FRGNT X

AUDUSD SHORT FORECAST Q2 W17 D25 Y25AUDUSD SHORT FORECAST Q2 W17 D25 Y25
Professional Risk Managers👋
Welcome back to another FRGNT chart update📈
Diving into some Forex setups using predominantly higher time frame order blocks alongside confirmation breaks of structure.
Let’s see what price action is telling us today!
💡Here are some trade confluences📝
✅Weekly 50 EMA
✅Intraday bearish breaks of structure
✅Tokyo ranges to be filled
✅Daily highs rejection
✅Previous daily candle bearish close
🔑 Remember, to participate in trading comes always with a degree of risk, therefore as professional risk managers it remains vital that we stick to our risk management plan as well as our trading strategies.
📈The rest, we leave to the balance of probabilities.
💡Fail to plan. Plan to fail.
🏆It has always been that simple.
❤️Good luck with your trading journey, I shall see you at the very top.
🎯Trade consistent, FRGNT X
