USD/CAD(20250411)Today's AnalysisMarket news:
The annual rate of the US CPI in March was 2.4%, a six-month low, lower than the market expectation of 2.6%. The market almost fully priced in the Fed's interest rate cut in June. Trump said inflation has fallen.
Technical analysis:
Today's buying and selling boundaries:
1.4013
Support and resistance levels:
1.4170
1.4112
1.4073
1.3952
1.3914
1.3855
Trading strategy:
If the price breaks through 1.4013, consider buying, the first target price is 1.4073
If the price breaks through 1.3952, consider selling, the first target price is 1.3914
USDCAD trade ideas

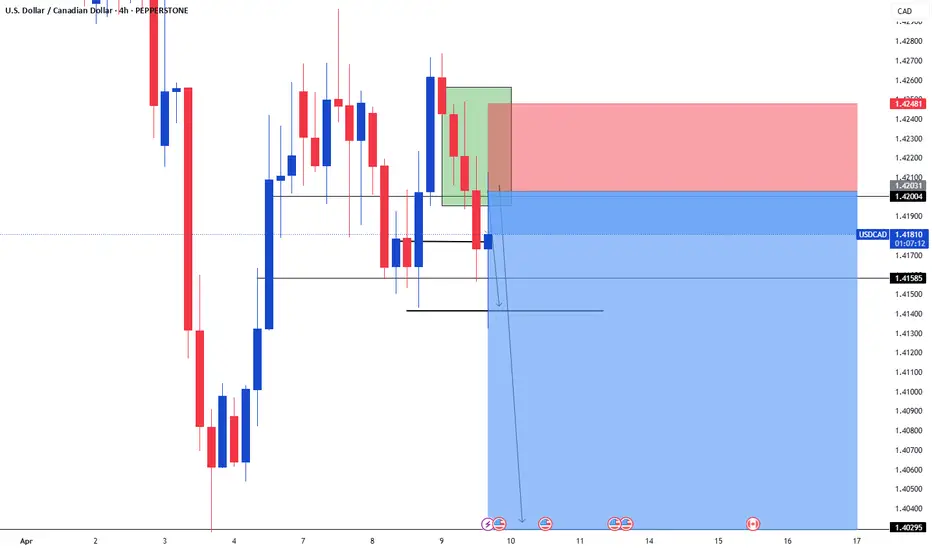
USDCAD BEARISHUSDCAD bearish in h1
break lower low and print new lower high
at current its on good fib level 0.61%
continue its bearish trend and to comlplete its d point of ab=cd patten

USD/CAD bears eyeing deeper downside flushUSD/CAD bears will be eyeing a meaningful downside flush with the pair breaking and closing beneath the 200-day moving average on Thursday, hitting fresh year-to-date lows in the process.
The price now finds itself below 1.3947, the high set in August last year. The break may encourage others to join the bearish move, generating a setup where shorts could be established with a stop placed above the level for protection.
1.38115 screens as an initial target, with other minor levels such as 1.3748, 1.3700 and 1.3647 also in play. Momentum indicators favour retaining a bearish bias, with RSI (14) trending strongly lower but not yet oversold. MACD further bolsters the bearish signal.
If the price were to reverse back above the 200DMA, the overall bearish bias would be invalidated.
Good luck!
DS

USDCADmy view on usd cad supported by market structure and a wave pattern ive being following for a couple months.

Usdcad Usdcad on a 1 week , 1 day and 4hrs we will see that the market is on a down trend but we are expecting a possible retracment to the support level that was just broken so we sell more

USDCAD on measure support Pullback from hereUSDCAD is currenlty on major weekly support and price would move Likly upward. this is also downtrend channel support.

USD_CAD REBOUND AHEAD|LONG|
✅USD_CAD is falling again to retest the support around 1.3900
But it is a strong key level
So I think that there is a high chance
That we will see a bullish rebound and a move up
LONG🚀
✅Like and subscribe to never miss a new idea!✅
Disclosure: I am part of Trade Nation's Influencer program and receive a monthly fee for using their TradingView charts in my analysis.

USDCAD selloff ? I see USD in trouble and see this waterfall here , it could go wrong if USD somehow does something to prevent it. Lets see what markets has prepared for us today !
2.6 RRR
GL Traders
Not Advice

USDCAD | 10.04.2025BUY 1.40750 | STOP 1.40000 | TAKE 1.41750 | Lateral price movement within the local channel of descending direction.

6 April - ShortGrade A setup with MT down and CT up. Drew trendline and waiting for it to break down the trendline

USDCAD: Growth & Bullish Forecast
It is essential that we apply multitimeframe technical analysis and there is no better example of why that is the case than the current USDCAD chart which, if analyzed properly, clearly points in the upward direction.
Disclosure: I am part of Trade Nation's Influencer program and receive a monthly fee for using their TradingView charts in my analysis.
❤️ Please, support our work with like & comment! ❤️

1Hr scalp sell update2If you took this trade two days as planned congrats because you are now in profit. With high impact news in a few hours you can Trail stop the trade or manually close the trade half an hr or 15mins before the high impact news.
Lets hope it hit TP before high impact news.
USDCAD → Weak dollar provokes continuation of downtrendFX:USDCAD under the pressure of a weak dollar and downtrend may renew its lows. The fundamental background for the dollar is weak, the market reacts accordingly.
The dollar continues to fall - a reaction to the tariff war. Besides, additional pressure is created by the issue of interest rates reduction.
The currency pair is under the pressure of the downtrend. After a false resistance breakout, the price is consolidating in the selling zone. The trend change is confirmed by the cascade of resistances. Emphasis on the local range 1.4245 - 1.42018. The price exit from the consolidation will provoke the continuation of the fall
Resistance levels: 1.4245, trend boundary
Support levels: 1.4202, 1.415
Possible retest of resistance before further decline. But the price exit from the current range and consolidation of the price below 1.4202 - 1.4205 will provoke the growth of sales and further fall to 1.405 (zone of interest).
Regards R. Linda!

USDCAD Watch out for bullish bat patternOn the 4-hour chart, USDCAD is expected to form a potential bullish bat pattern. Currently, we can focus on buying opportunities around 1.4058. The upside target is 1.4140. After breaking through, the upper resistance is 1.4190.

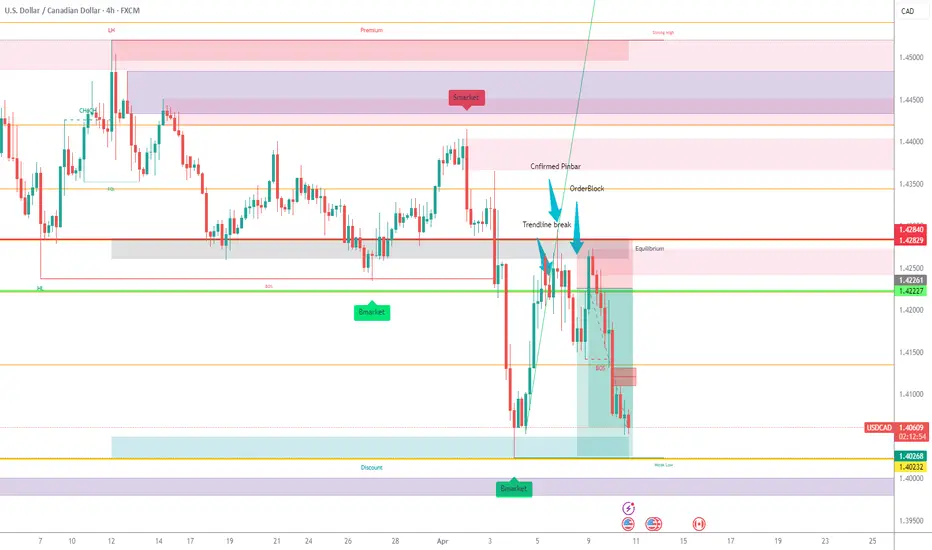
Crowd's Bullish Narrative Meets Structural Reality📅 Week of: April 7–11, 2025
🚩 USD/CAD
Bias: Bearish
Trade Duration: 2–5 Days
Status: Breakdown Confirmed – Retest Completed
Current Reflexivity Phase: Phase 4 – Emotional Flush & Capitulation
Strategy Type: Structural Breakdown + Sentiment Dislocation
Execution Style: Reactive, not predictive
Theme: "Crowd's Bullish Narrative Meets Structural Reality"
🧠 Strategic Thesis
USD/CAD has clearly broken and successfully retested previous support (1.4248) as resistance. The market now enters an emotional flush phase as late bullish positions unwind, reinforcing bearish momentum driven by strengthening CAD due to bullish crude oil dynamics.
🔍 Structure Breakdown Highlights
Clean structural rejection at the retest (1.4248 resistance zone)
Strong bearish momentum confirmed; consistent lower highs
Sellers firmly control price action, no fresh demand emerging
📊 COT & Sentiment Snapshot
Leveraged Funds: Unwinding longs slowly
Institutional Traders: Accumulating CAD positions steadily
Retail Sentiment: Persistently bullish on USD despite structural evidence
📌 Translation: Institutional flows quietly pivoting to CAD; retail optimism still providing contrarian fuel.
🧠 Behavioral Finance Triggers
“Crowds trust the story. Price tells the truth.”
Emotional denial among bullish USD traders, fueling further downside upon forced exits
Rejection confirmed; sentiment lagging clear structural signals
🔄 Reflexivity Model – Phase Breakdown
Phase Description
Phase 1: USD bullish narrative builds retail optimism
Phase 2: Structural breakdown—completed
Phase 3: Retest & crowd denial—completed
Phase 4: ✅ Current – Emotional flush underway
🛠️ Execution Plan
Entry: Short already executed at 1.42354
Risk Management: Stop-loss above confirmed retest (1.42567)
Exit Plan: Scale out strategically on downside momentum
🕰️ Execution Timeline
Wednesday–Friday: Maintain short bias, trail stops, secure partial gains into weekend
✅ Strategic Summary
USD bullish crowd now forced to reckon with structural realities—stay positioned for emotional flush continuation.
"You don’t need to predict. Just follow the failure."

Bullish bounce?USD/CAD is falling towards the support level which is a pullback support that is slightly below the 161.8% Fibonacci extension and could bounce from this level to our take profit.
Entry: 1.4047
Why we like it:
There is a pullback support level that is slightly below the 161.8% Fibonacci extension.
Stop loss: 1.3993
Why we like it:
There is a pullback support level that lines up with the 78.6% Fibonacci projection.
Take profit: 1.4159
Why we like it:
There is a pullback resistance level.
Enjoying your TradingView experience? Review us!
Please be advised that the information presented on TradingView is provided to Vantage (‘Vantage Global Limited’, ‘we’) by a third-party provider (‘Everest Fortune Group’). Please be reminded that you are solely responsible for the trading decisions on your account. There is a very high degree of risk involved in trading. Any information and/or content is intended entirely for research, educational and informational purposes only and does not constitute investment or consultation advice or investment strategy. The information is not tailored to the investment needs of any specific person and therefore does not involve a consideration of any of the investment objectives, financial situation or needs of any viewer that may receive it. Kindly also note that past performance is not a reliable indicator of future results. Actual results may differ materially from those anticipated in forward-looking or past performance statements. We assume no liability as to the accuracy or completeness of any of the information and/or content provided herein and the Company cannot be held responsible for any omission, mistake nor for any loss or damage including without limitation to any loss of profit which may arise from reliance on any information supplied by Everest Fortune Group.
Take profit: 1.4159
Why we like it:
There is a pullback resistance level.
Enjoying your TradingView experience? Review us!

USDCAD Trendline Breakout Ready for a Long SellHello Traders
In This Chart EURUSD HOURLY Forex Forecast By FOREX PLANET
today EURUSD analysis 👆
🟢This Chart includes_ (EURUSD market update)
🟢What is The Next Opportunity on EURUSD Market
🟢how to Enter to the Valid Entry With Assurance Profit
This CHART is For Trader's that Want to Improve Their Technical Analysis Skills and Their Trading By Understanding How To Analyze The Market Using Multiple Timeframes and Understanding The Bigger Picture on the Charts

USD/CAD🔹Symbol: USD/CAD
🔹Price: 1.42126
🔹Stop loss: 1.42683
🔹Take profit 1: 1.41508
🔹Take profit 2: 1.40824
🔹Take profit 3: 1.40343
Low risk: % 1.5 🟢 2
📊Check your chart before entering.
♦️Check before use to make sure there is no important news.


USDCAD Bearish Momentum Ahead ?The USDCAD is currently situated within a downward trend channel, having broken through its horizontal support zone, which has now turned into resistance. If the price attempts to surpass this horizontal resistance, it might face rejection at the upper channel resistance. Let's observe what happens.

USDCAD Sells Trend continuation of bearish impulse move after retracement. Being safe and only taking it back to 61.8
