USD/CAD SENDS CLEAR BEARISH SIGNALS|SHORT
Hello, Friends!
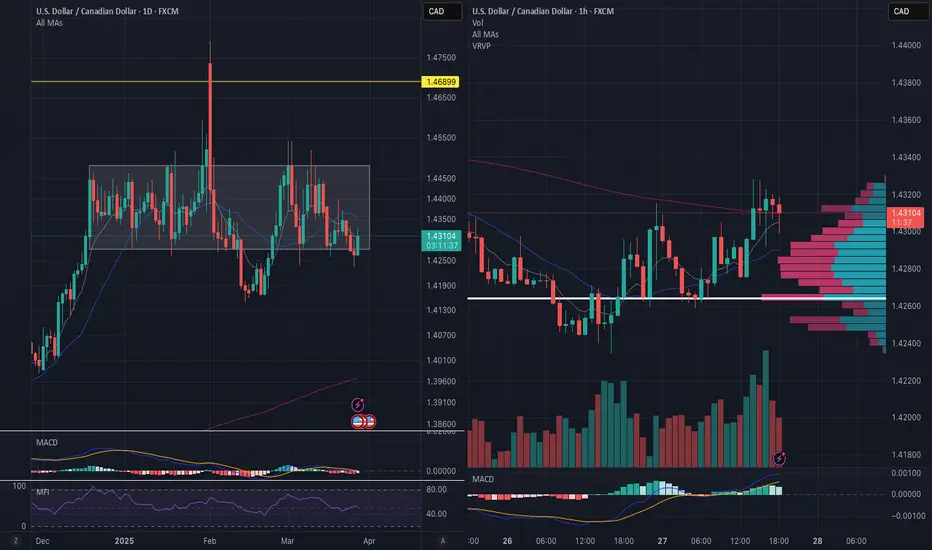
The BB upper band is nearby so USD/CAD is in the overbought territory. Thus, despite the uptrend on the 1W timeframe I think that we will see a bearish reaction from the resistance line above and a move down towards the target at around 1.427.
Disclosure: I am part of Trade Nation's Influencer program and receive a monthly fee for using their TradingView charts in my analysis.
✅LIKE AND COMMENT MY IDEAS✅
USDCAD trade ideas

USDCAD MIGHT DROP!Price just formed a falling wedge pattern. It’s a sign there’ll be a possible further decline In price to a support level of 1.40933 . A sell opportunity is envisaged upon breaking the lower board of the wedge pattern.

USD/CAD 30H ANALYSIS SELL SETUPSuggested Entry: 1.4315 (current price region aligns with minor resistance)
Target (TP) Levels
1. 1.4260 — First TP (initial support zone)
2. 1.4210 — Final TP (stronger support level)
Stop Loss (SL)1.43500
Suggested SL: 1.4355 (above recent highs and resistance zone)
Key Support & Resistance Levels
Resistance: 1.4355 / 1.4315
Support: 1.4260 / 1.4210
This structure aligns with your bearish bias (noted by the red arrow targeting lower zones). Ensure you monitor price action for confirmation before entering. Would you like a refined risk-reward ratio calculation?

USD/CAD Bearish Trade Setup – Resistance Rejection & Target ProjUSD/CAD Bearish Trade Setup – Key Resistance & Target Projection
Analysis:
Timeframe: 30-minute chart
Current Price: 1.43248
Indicators:
EMA (200, Blue): 1.43024 (Key Dynamic Support)
EMA (30, Red): 1.43142 (Short-term trend)
Resistance Zone (Supply Area): 1.43300 - 1.43450
Support Level (Rejection Zone): 1.43085 - 1.43024
Trade Setup:
Entry Zone: Around the rejection level near 1.43142
Stop Loss: 1.43435 (Above the resistance zone)
Take Profit Target: 1.42355 (EA Target Point)
Projection:
Price is expected to reject the resistance zone, drop below the 200 EMA, and test the lower target at 1.42355.
If price confirms rejection at resistance, a short (sell) opportunity is valid.
A break above the stop-loss level could invalidate the bearish bias.
Conclusion:
Bearish momentum is anticipated if price respects the resistance zone.
Confirmation from price action (candlestick patterns) will strengthen the trade setup.

U.S. CAN ratioCanada isn’t looking so hot right now. Maybe Doug Ford should keep his mouth shut. I’m seeing a 1.8:1 ratio coming up, which means almost two Canadian Dollars to one US Dollar. Watch. Canada will adopt the US dollar, and it’s not going to take that long.

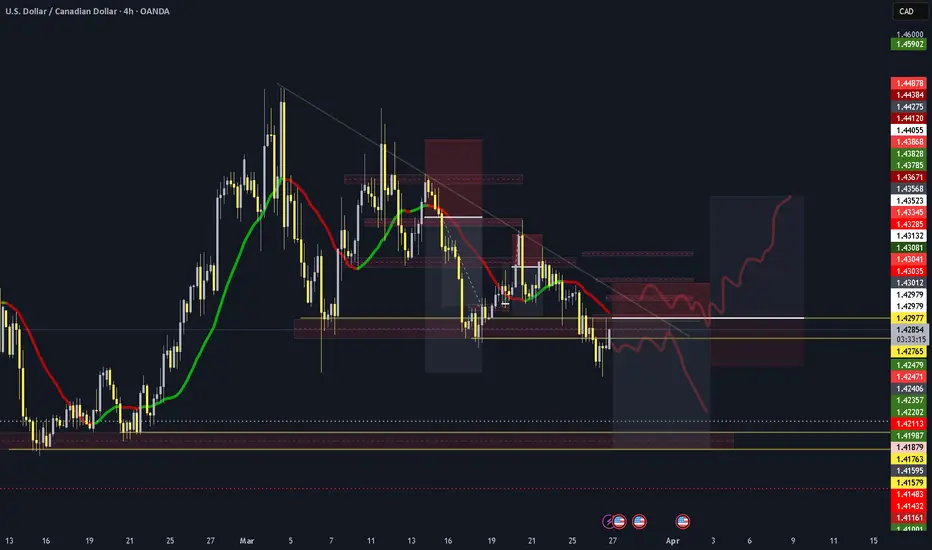
Descending Triangle on USDCADNoticing a descending triangle chart pattern on the 4H timeframe for USDCAD. The descending triangle is a neutral pattern suggesting two scenarios but usually plays out on bearish scenarios.
Price had been giving us LHs and equal lows. Combined with the corelation with DXY we may see bearish movement. However, confirmation is key. A break below the support will confirm the bears are in control. Alternatively, a break above the trendline AND the resistance I marked out suggests the bulls are in control.


Bearish Bias on USD/CAD – Fundamental and Technical ConfluenceFundamental Overview:
We’re seeing several bearish signals from the fundamental side for USD/CAD:
Retail Sales: Negative, indicating weaker consumer spending and slowing economic activity.
Inflation: Bearish, as high inflation may lead to tighter monetary policies, slowing growth.
Employment Change: Negative, suggesting a contraction in job creation, signaling economic weakness.
Unemployment Rate: Negative, reflecting potential challenges in the labor market.
These factors all lean toward a bearish bias, reinforcing the case for selling USD/CAD.
Technical Overview:
On the chart, price is currently in a discounted zone with confluence from the anchored VWAP from the recent low, which aligns with the current bearish trend. The VWAP suggests that the price has retraced back to a significant level, and with the fundamentals pointing to a weak outlook for USD, a continuation to the downside seems likely.
Key Levels & Target:
Short entry near the VWAP confluence.
Targeting the next key support level, watching for any price action confirmation.

USDCAD SELL/SHORTBy utilizing Fibonacci retracement levels, historical patterns, , we can formulate a hypothesis that the market might follow a similar trajectory if bearish sentiment prevails.

USDCAD LONG ReboundUSDCAD Rebound until the 1h orderblock upside. We have confirmation on daily timeframe.

USDCAD Long1)Trend defined. 4h uptrend reversal after touching a key area.
2)Contradictory limit order entry. At a previous key level.
3)Default loss. Below the previous pullback low.
4)Target set. 5.59.
5)Risk <= 3%.
6)Singular trade.
7)Trades placed today <= 5.

usdcad still in range ? The USD/CAD is sitting at a critical support level in its rectangular trading range. The VRVP (Volume-Weighted Average Price) shows strong institutional interest right here, and the COT reports suggest leveraged traders aren't aggressively buying USD. This points to a potential bounce or consolidation zone. The daily chart and hourly timeframe are both showing similar signs - we're at a key support where smart money seems to be positioning themselves. It's a classic setup where the market is potentially setting up for a move, but waiting for a clear catalyst.
The key is watching how price respects this support level and looking for confirmation of either a bounce or a breakdown. i would want to see a solid rejection of these lower prices or a clean break below.
if not the range will confirm for now
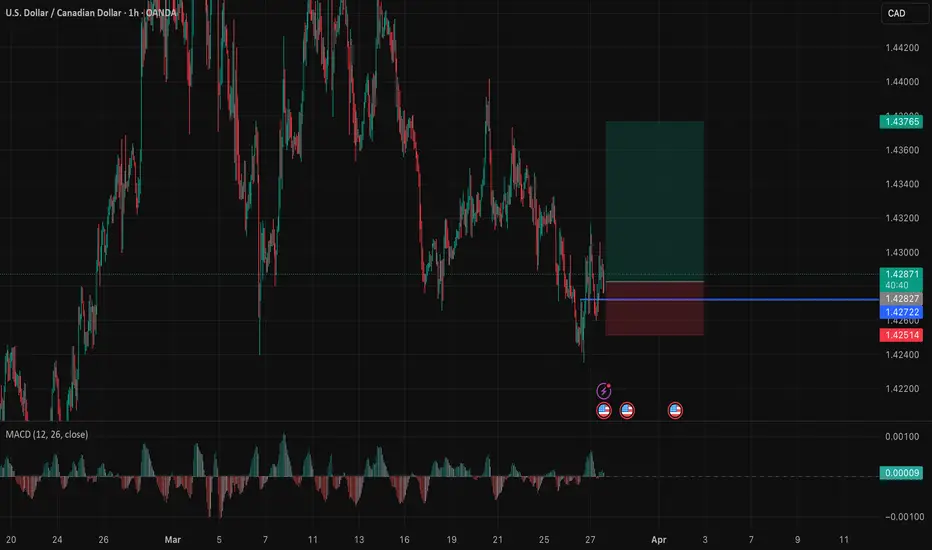
USDCAD 1 hr Chart Long IdeaHello Friends,
USDCAD found support on 4h timeframe and thus gives us opportunity for long positions.
Entry = Market Price
SL = 1.42509
TP = 1.43751
We can break even the position after crossing 1st resistance at 1.43077
Please like, share, and follow for more ideas.
Thanks
USDCAD 26.03.2025~+ Conciliatory messages from Trump on tariffs; Trump hinted at flexibility ("more targeted approach")
+ Seasonals
- CAD COT

usd cad redictionI have creted two scenarios as i see a perfect consolidation triangle , we should confirm it on the retest of the trend line or the moving average

USDCAD(Review and Speculation for the Day)Previously our Analysis was looking out for BUY but now,we look out for SELL.ENJOY!!

USDCAD INTRADAY trend changeThe USDCAD currency pair remains in a bearish trend, with the recent price action reflecting an oversold bounce. Despite the temporary rebound, the overall sentiment remains weak unless a decisive breakout occurs.
Key Levels to Watch:
Resistance Levels: 1.4338 (critical level), 1.4413, 1.4475
Support Levels: 1.4276, 1.4200, 1.4139
Bearish Scenario:
A rejection from the 1.4338 resistance level could reaffirm the downside bias, leading to a continuation of the bearish move toward 1.4276, with further declines targeting 1.4200 and 1.4139 over the longer timeframe.
Bullish Scenario:
A breakout above 1.4338 with a daily close above this level would challenge the bearish sentiment, opening the door for further upside movement toward 1.4413, followed by 1.4475.
Conclusion:
The market sentiment remains bearish, with 1.4338 as a critical resistance zone. A rejection from this level would reinforce the downtrend, while a confirmed breakout would shift the outlook to bullish, favoring further upside gains. Traders should closely watch price action at this key level for confirmation.
This communication is for informational purposes only and should not be viewed as any form of recommendation as to a particular course of action or as investment advice. It is not intended as an offer or solicitation for the purchase or sale of any financial instrument or as an official confirmation of any transaction. Opinions, estimates and assumptions expressed herein are made as of the date of this communication and are subject to change without notice. This communication has been prepared based upon information, including market prices, data and other information, believed to be reliable; however, Trade Nation does not warrant its completeness or accuracy. All market prices and market data contained in or attached to this communication are indicative and subject to change without notice.

USDCAD is ready to short againNo comment needed. All information is in the chart analysis.
Steps to follow:
Analyze yourself.
Take the position with SL and Take Profits.
Wait, it may take a couple of days, so take a break and step away from the screen from time to time, just like I do :)
Get the result.
I will update the trade every day.
Like, comment with your good mood or viewpoint, share with your circle. It’s together that we get stronger!
Good trades, Traders!
The golden bear

USDCAD looks to be continuing downwardUSDCAD will continue down the downward channel, breaking support below. Then we will wait for the retest of resistance before we place the trade. If it breaks the top channel trendline it will continue upwards to the next trend line in chart. also, wait for retest of that scenario as well.

USDCAD BEARISH REVERSAL IMMINENT *USD/CAD: Bearish Reversal Imminent?*
A high-probability selling opportunity has emerged in the USD/CAD pair, with a critical resistance zone in play.
*Trade Parameters:*
- *Sell Zone:* 1.43300 - 1.43800
- *Profit Targets:*
- TP1: 1.42400
- TP2: 1.41500
- *Stop-Loss:* 1.44600
*Rationale:*
1. *Confluence of Resistance:* The USD/CAD pair has reached a robust resistance zone, where sellers are likely to intervene.
2. *Bearish Momentum:* Technical indicators are flashing bearish signals, hinting at a potential downturn.
3. *CAD Strength:* A resurgent Canadian Dollar, fueled by rising oil prices and a sturdy economy, may exacerbate the USD/CAD decline.
*Market Analysis:*
The USD/CAD pair is experiencing a consolidation phase following a recent upswing, with market participants exercising caution ahead of key economic data releases. A breach of the 1.42400 support level could precipitate a sharp decline.
*Trading Plan:*
Sell USD/CAD within the designated zone (1.43300 - 1.43800), with a stop-loss at 1.44600. Utilize the profit targets to secure gains or adjust the stop-loss to break even.
Keep remembering the Travis with best wishes👍


Falling towards pullback support?The Loonie (USD/CAD) is falling towards the pivot which has been identified as a pullback support and could bounce to the 1st resistance which is a pullback resistance.
Pivot: 1.4236
1st Support: 1.4150
1st Resistance: 1.4359
Risk Warning:
Trading Forex and CFDs carries a high level of risk to your capital and you should only trade with money you can afford to lose. Trading Forex and CFDs may not be suitable for all investors, so please ensure that you fully understand the risks involved and seek independent advice if necessary.
Disclaimer:
The above opinions given constitute general market commentary, and do not constitute the opinion or advice of IC Markets or any form of personal or investment advice.
Any opinions, news, research, analyses, prices, other information, or links to third-party sites contained on this website are provided on an "as-is" basis, are intended only to be informative, is not an advice nor a recommendation, nor research, or a record of our trading prices, or an offer of, or solicitation for a transaction in any financial instrument and thus should not be treated as such. The information provided does not involve any specific investment objectives, financial situation and needs of any specific person who may receive it. Please be aware, that past performance is not a reliable indicator of future performance and/or results. Past Performance or Forward-looking scenarios based upon the reasonable beliefs of the third-party provider are not a guarantee of future performance. Actual results may differ materially from those anticipated in forward-looking or past performance statements. IC Markets makes no representation or warranty and assumes no liability as to the accuracy or completeness of the information provided, nor any loss arising from any investment based on a recommendation, forecast or any information supplied by any third-party.
