Falling towards pullback support?The Loonie (USD/CAD) is falling towards the pivot which has been identified as a pullback support and could bounce to the 1st resistance which is a pullback resistance.
Pivot: 1.4236
1st Support: 1.4150
1st Resistance: 1.4359
Risk Warning:
Trading Forex and CFDs carries a high level of risk to your capital and you should only trade with money you can afford to lose. Trading Forex and CFDs may not be suitable for all investors, so please ensure that you fully understand the risks involved and seek independent advice if necessary.
Disclaimer:
The above opinions given constitute general market commentary, and do not constitute the opinion or advice of IC Markets or any form of personal or investment advice.
Any opinions, news, research, analyses, prices, other information, or links to third-party sites contained on this website are provided on an "as-is" basis, are intended only to be informative, is not an advice nor a recommendation, nor research, or a record of our trading prices, or an offer of, or solicitation for a transaction in any financial instrument and thus should not be treated as such. The information provided does not involve any specific investment objectives, financial situation and needs of any specific person who may receive it. Please be aware, that past performance is not a reliable indicator of future performance and/or results. Past Performance or Forward-looking scenarios based upon the reasonable beliefs of the third-party provider are not a guarantee of future performance. Actual results may differ materially from those anticipated in forward-looking or past performance statements. IC Markets makes no representation or warranty and assumes no liability as to the accuracy or completeness of the information provided, nor any loss arising from any investment based on a recommendation, forecast or any information supplied by any third-party.
USDCAD trade ideas

USD/CAD(20250325)Today's AnalysisToday's buying and selling boundaries:
1.4294
Support and resistance levels:
1.4357
1.4333
1.4318
1.4270
1.4255
1.4232
Trading strategy:
If the price breaks through 1.4294, consider buying, the first target price is 1.4318
If the price breaks through 1.4270, consider selling, the first target price is 1.4255

USDCAD Sell PlanWatching price reaction at H1 and H4 FVGs — expecting continuation to the downside. Eyes on liquidity resting below recent lows.
H1 & H4 FVGs respected 👀

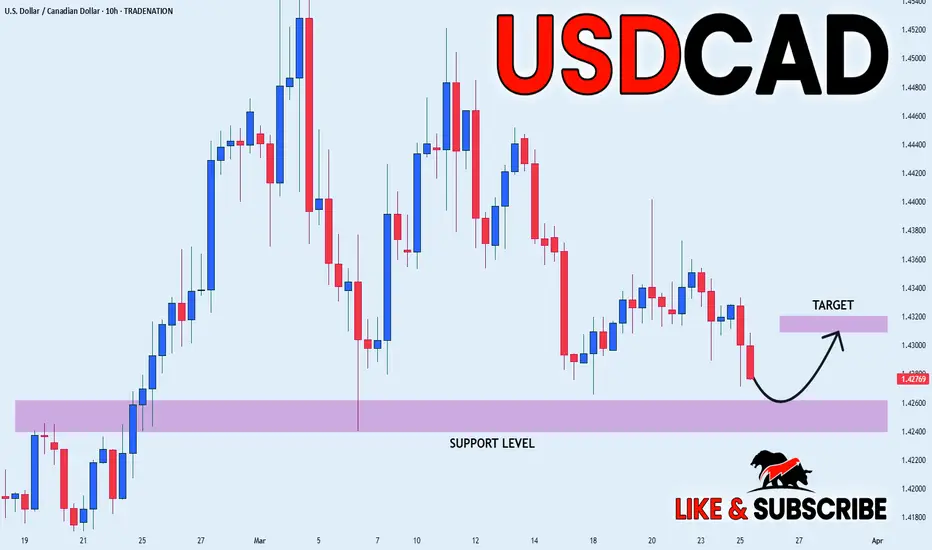
USD_CAD LOCAL LONG|
✅USD_CAD fell again to
Retest the support of 1.4420
But it is a strong key level
So I think that there is a high chance
We will see a bullish rebound and a move up
LONG🚀
✅Like and subscribe to never miss a new idea!✅
Disclosure: I am part of Trade Nation's Influencer program and receive a monthly fee for using their TradingView charts in my analysis.
USD-CAD Long From Support! Buy!
Hello,Traders!
USD-CAD made a retest of
The horizontal support level
Of 1.4256 and we are already
Seeing a bullish rebound so
We will be expecting a
Further bullish move up
Buy!
Comment and subscribe to help us grow!
Check out other forecasts below too!
Disclosure: I am part of Trade Nation's Influencer program and receive a monthly fee for using their TradingView charts in my analysis.

Lingrid | USDCAD potential Selling OPPORTUNITY Post-Sell-OffThe price perfectly fulfilled my last idea . It hit the target level. Following the bearish movement, FX:USDCAD made a pullback, and on the daily timeframe, it formed a long-tailed bar that suggests a potential retest of the zone above the 1.4200 level. After the recent drop, the market is now moving sideways, just above the previous day low. If the market breaks and closes below this low, it may retest the support zone below. However, considering that the price action remains within the weekly range, it could continue to oscillate between the upper and lower boundaries. I expect a downward move if the price holds below the upward trendline. My goal is support zone around 1.42615.
Traders, If you liked this educational post🎓, give it a boost 🚀 and drop a comment 📣

USDCAD 1H forecastLooking for a bearish outlook on UCAD as a potential Leading Digonal pattern, note* it can also be a 1-2 1-2 pattern.
Even if price re-prices by moving up, making all these pullbacks, the main direction is bearish.

Bullish bounce?USD/CAD is falling towards the support level which is a pullback support that is slightly above the 127.2% Fibonacci extension and also line sup with the 61.8% Fibonacci projection and could bounce from this level to our take profit.
Entry: 1.4242
Why we like it:
There is a pullback support level that line sup with the 61.8% Fibonacci projection and also slightly above the 127.2% Fibonacci extension.
Stop loss: 1.4151
Why we like it:}
There is a pullback support level that lines up with the 100% Fibonacci projection.
Take profit: 1.4357
Why we like it:
There is a pullback resistance.
Enjoying your TradingView experience? Review us!
Please be advised that the information presented on TradingView is provided to Vantage (‘Vantage Global Limited’, ‘we’) by a third-party provider (‘Everest Fortune Group’). Please be reminded that you are solely responsible for the trading decisions on your account. There is a very high degree of risk involved in trading. Any information and/or content is intended entirely for research, educational and informational purposes only and does not constitute investment or consultation advice or investment strategy. The information is not tailored to the investment needs of any specific person and therefore does not involve a consideration of any of the investment objectives, financial situation or needs of any viewer that may receive it. Kindly also note that past performance is not a reliable indicator of future results. Actual results may differ materially from those anticipated in forward-looking or past performance statements. We assume no liability as to the accuracy or completeness of any of the information and/or content provided herein and the Company cannot be held responsible for any omission, mistake nor for any loss or damage including without limitation to any loss of profit which may arise from reliance on any information supplied by Everest Fortune Group.

USCAD BUY ideaUSDCAD seems to be entering a much expected consolidation. I see only scalp opportunities in the range.

USDCAD What Next? SELL!
My dear subscribers,
This is my opinion on the USDCAD next move:
The instrument tests an important psychological level 1.4356
Bias - Bearish
Technical Indicators: Supper Trend gives a precise Bearish signal, while Pivot Point HL predicts price changes and potential reversals in the market.
Target - 1.4330
About Used Indicators:
On the subsequent day, trading above the pivot point is thought to indicate ongoing bullish sentiment, while trading below the pivot point indicates bearish sentiment.
Disclosure: I am part of Trade Nation's Influencer program and receive a monthly fee for using their TradingView charts in my analysis.
———————————
WISH YOU ALL LUCK

USD/CAD For Bearishyou can go short now
or
wait for pull-back near by entry point and then go short
have fun :)

USDCAD SELL/SHORTBy utilizing Fibonacci retracement levels, historical patterns, , we can formulate a hypothesis that the market might follow a similar trajectory if bearish sentiment prevails.

I'm adding more USDCAD short here!!I've not been happy with UCAD price movement. It is fast. Hit me out fast or go for TP, but either one, be fast about it. This guy has been going down albeit slowly. I'm adding more positions here as I know it will fall.
Dont mind those telling you to buy, it is not buying. You're still early to the move.
Ya gaziere unu


Bearish reversal?The Loonie (USD/CAD) is rising towards the pivot and could reverse to the 1st support which line sup with the 61.8% Fibonacci projection.
Pivot: 1.4385
1st Support: 1.4238
1st Resistance: 1.4485
Risk Warning:
Trading Forex and CFDs carries a high level of risk to your capital and you should only trade with money you can afford to lose. Trading Forex and CFDs may not be suitable for all investors, so please ensure that you fully understand the risks involved and seek independent advice if necessary.
Disclaimer:
The above opinions given constitute general market commentary, and do not constitute the opinion or advice of IC Markets or any form of personal or investment advice.
Any opinions, news, research, analyses, prices, other information, or links to third-party sites contained on this website are provided on an "as-is" basis, are intended only to be informative, is not an advice nor a recommendation, nor research, or a record of our trading prices, or an offer of, or solicitation for a transaction in any financial instrument and thus should not be treated as such. The information provided does not involve any specific investment objectives, financial situation and needs of any specific person who may receive it. Please be aware, that past performance is not a reliable indicator of future performance and/or results. Past Performance or Forward-looking scenarios based upon the reasonable beliefs of the third-party provider are not a guarantee of future performance. Actual results may differ materially from those anticipated in forward-looking or past performance statements. IC Markets makes no representation or warranty and assumes no liability as to the accuracy or completeness of the information provided, nor any loss arising from any investment based on a recommendation, forecast or any information supplied by any third-party.

Triangle breakout (correction) i had posted a similar trade earlier but on buys without the candle breaking out the triangle, but now i have seen the clear movement of the chart and I'm certain that its a sell. Goodluck

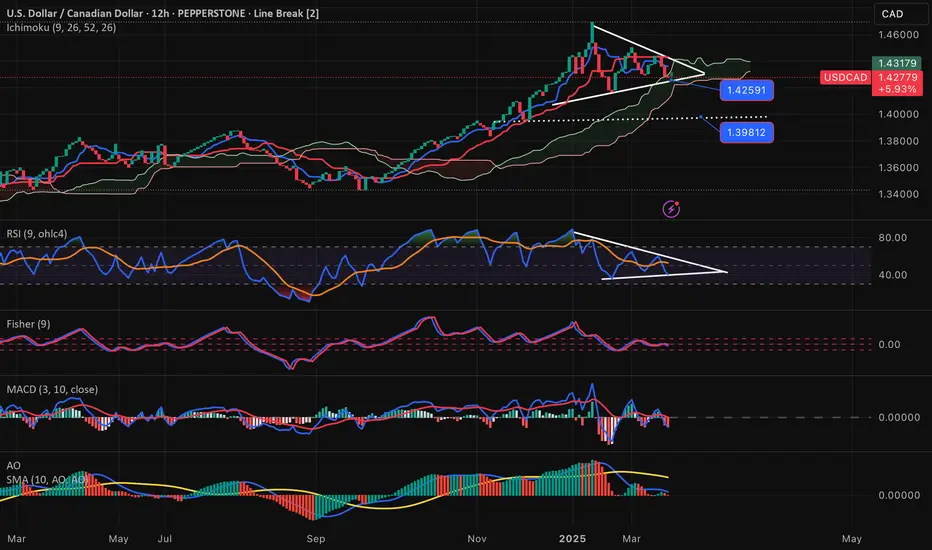
USDCAD-SELL strategy 12 hourly chart Line Break (2)The pair feels heavy, and especially higher OIL price and a triangle with support little lower, and approaching critical cloud areas, suggest we have a reasonable chance to see it move lower sharply.
Strategy SELL @ 1.4310-1.4340 and take profit near 1.4039 for now.
USDCADUSDCAD
- Falling Wedge in Short Time Frame
- Completed " 1234 " Impulsive Waves
- Break of Structure
- S / R Level
- Change of Characteristics

USDCAD- Slowly droppingPrice broke and retested the double top on the 4 hour time frame. On the 1 hour price is making lower high. anticipating a drop soon to at least back to the weekly low.

USD/CAD(20250325)Today's AnalysisToday's buying and selling boundaries:
1.4318
Support and resistance levels:
1.4379
1.4356
1.4342
1.4295
1.4280
1.4257
Trading strategy:
If the price breaks through 1.4342, consider buying, the first target price is 1.4356
If the price breaks through 1.4295, consider selling, the first target price is 1.4280

$USDCAD – Dollar Dominance or Canadian Comeback?(1/9)
Good evening, everyone! 🌙 USDCAD – Dollar Dominance or Canadian Comeback?
With USDCAD at 1.43180, is the US dollar’s reign continuing, or is the Canadian dollar poised for a resurgence? Let’s dive into the currency markets! 🔍
(2/9) – PRICE PERFORMANCE 📊
• Current Rate: 1.43180 as of Mar 24, 2025 💰
• Recent Move: Up from 1.3700 in Apr 2024, showing US dollar strength 📏
• Sector Trend: Currency markets volatile, driven by economic indicators and policies 🌟
It’s a dynamic market—let’s see what’s driving the dollar’s dominance! ⚙️
(3/9) – MARKET POSITION 📈
• Exchange Rate: USDCAD reflects USD value against CAD 🏆
• Coverage: Influenced by interest rates, economic growth, commodity prices ⏰
• Trend: US dollar strengthening, CAD weakening, per price movement 🎯
Firm in its position, but can the CAD make a comeback? 🚀
(4/9) – KEY DEVELOPMENTS 🔑
• Interest Rates: US rates higher than Canada’s, attracting investment to USD 🌍
• Commodity Prices: Potential drop in oil prices weakening CAD, per data 📋
• Economic Growth: US economy outperforming Canada, per reports 💡
These factors are stirring the pot! 🛢️
(5/9) – RISKS IN FOCUS ⚡
• Interest Rate Changes: Fed or BoC policy shifts can alter the landscape 🔍
• Commodity Market: Volatility in oil and other commodities affects CAD 📉
• Global Economy: Economic slowdowns or recoveries impact currency values ❄️
It’s a risky dance—watch your steps! 🛑
(6/9) – SWOT: STRENGTHS 💪
• US Dollar: Higher interest rates, safe haven status, strong economy 🥇
• Canadian Dollar: Supported by commodity exports, diversified economy 📊
Both have their strengths, but the balance tips towards USD currently! 🏦
(7/9) – SWOT: WEAKNESSES & OPPORTUNITIES ⚖️
• US Dollar Weaknesses: Potential overvaluation, trade tensions 📉
• Canadian Dollar Opportunities: Rising commodity prices, tech sector growth 📈
Can CAD turn the tables or will USD continue to dominate? 🤔
(8/9) – POLL TIME! 📢
USDCAD at 1.43180—your take? 🗳️
• Bullish on USD: 1.50+ soon, dollar’s dominance continues 🐂
• Neutral: Sideways movement, risks balance out ⚖️
• Bullish on CAD: 1.40 below, Canadian dollar rebounds 🐻
Chime in below! 👇
(9/9) – FINAL TAKEAWAY 🎯
USDCAD’s 1.43180 price reflects US dollar strength 📈, but CAD has its own aces up its sleeve. Strategic trading could be key to navigating this pair. Gem or bust?

USDCAD Expected Growth! BUY!
My dear subscribers,
USDCAD looks like it will make a good move, and here are the details:
The market is trading on 1.4316 pivot level.
Bias - Bullish
Technical Indicators: Both Super Trend & Pivot HL indicate a highly probable Bullish continuation.
Target - 1.4336
About Used Indicators:
The average true range (ATR) plays an important role in 'Supertrend' as the indicator uses ATR to calculate its value. The ATR indicator signals the degree of price volatility.
Disclosure: I am part of Trade Nation's Influencer program and receive a monthly fee for using their TradingView charts in my analysis.
———————————
WISH YOU ALL LUCK

USD/CAD is nearing a potential turning pointThe Canadian dollar has strengthened slightly against the US dollar recently and appears to be preparing for another significant move. USD/CAD began weakening around 14 March after it failed to break through resistance at CA$1.445 and fell to the uptrend at CA$1.428. USD/CAD is gearing up for a potential breakout as a symmetrical triangle nears completion.
The triangle has been gradually forming and could be approaching a breaking point over the next few days as the wedge closes. As measured by the relative strength index, momentum has turned decidedly negative, suggesting that USD/CAD could continue to decline. However, for that to happen, the pair may have to contend with the uptrend and support levels in place since the beginning of 2025 around CA$1.430.
The FX rate at CA$1.430 has been a key support and resistance level for some time, and a break below this level could set up a potential further decline to CA$1.415.
However, triangle patterns such as these can be tricky, and until confirmed, USD/CAD could just as quickly rise, leading to potential US dollar strength. Should USD/CAD break above the downtrend at CA$1.438, it could rally back to the upper end of the trading range at CA$1.445.
With the ongoing back-and-forth headlines surrounding the Trump trade wars and the looming 2 April tariff deadline, the currency could break in either direction.
Written by Michael J Kramer, founder of Mott Capital Management
Disclaimer: CMC Markets is an execution-only service provider. The material (whether or not it states any opinions) is for general information purposes only and does not take into account your personal circumstances or objectives. Nothing in this material is (or should considered to be) financial, investment or other advice on which reliance should be placed.
No opinion given in the material constitutes a recommendation by CMC Markets or the author that any particular investment, security, transaction, or investment strategy is suitable for any specific person. The material has not been prepared in accordance with legal requirements designed to promote the independence of investment research. Although we are not specifically prevented from dealing before providing this material, we do not seek to take advantage of the material prior to its dissemination.
