USDCAD trade ideas
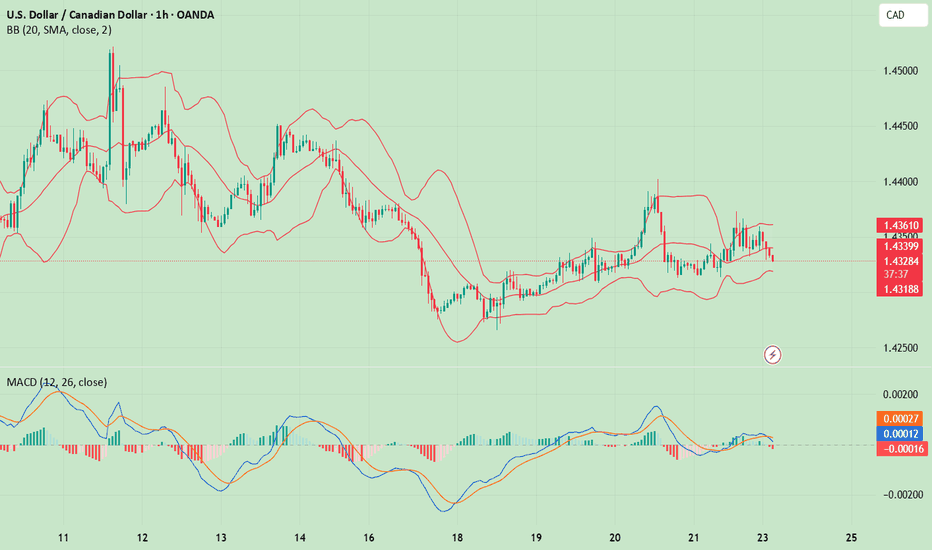
USD/CAD H1 | Falling to overlap supportUSD/CAD is falling towards an overlap support and could potentially bounce off this level to climb higher.
Buy entry is at 1.4311 which is an overlap support that aligns with the 61.8% Fibonacci retracement.
Stop loss is at 1.4258 which is a level that lies underneath a multi-swing-low support.
Take profit is at 1.4396 which is an overlap resistance.
High Risk Investment Warning
Trading Forex/CFDs on margin carries a high level of risk and may not be suitable for all investors. Leverage can work against you.
Stratos Markets Limited (www.fxcm.com):
CFDs are complex instruments and come with a high risk of losing money rapidly due to leverage. 63% of retail investor accounts lose money when trading CFDs with this provider. You should consider whether you understand how CFDs work and whether you can afford to take the high risk of losing your money.
Stratos Europe Ltd (www.fxcm.com):
CFDs are complex instruments and come with a high risk of losing money rapidly due to leverage. 63% of retail investor accounts lose money when trading CFDs with this provider. You should consider whether you understand how CFDs work and whether you can afford to take the high risk of losing your money.
Stratos Trading Pty. Limited (www.fxcm.com):
Trading FX/CFDs carries significant risks. FXCM AU (AFSL 309763), please read the Financial Services Guide, Product Disclosure Statement, Target Market Determination and Terms of Business at www.fxcm.com
Stratos Global LLC (www.fxcm.com):
Losses can exceed deposits.
Please be advised that the information presented on TradingView is provided to FXCM (‘Company’, ‘we’) by a third-party provider (‘TFA Global Pte Ltd’). Please be reminded that you are solely responsible for the trading decisions on your account. There is a very high degree of risk involved in trading. Any information and/or content is intended entirely for research, educational and informational purposes only and does not constitute investment or consultation advice or investment strategy. The information is not tailored to the investment needs of any specific person and therefore does not involve a consideration of any of the investment objectives, financial situation or needs of any viewer that may receive it. Kindly also note that past performance is not a reliable indicator of future results. Actual results may differ materially from those anticipated in forward-looking or past performance statements. We assume no liability as to the accuracy or completeness of any of the information and/or content provided herein and the Company cannot be held responsible for any omission, mistake nor for any loss or damage including without limitation to any loss of profit which may arise from reliance on any information supplied by TFA Global Pte Ltd.
The speaker(s) is neither an employee, agent nor representative of FXCM and is therefore acting independently. The opinions given are their own, constitute general market commentary, and do not constitute the opinion or advice of FXCM or any form of personal or investment advice. FXCM neither endorses nor guarantees offerings of third-party speakers, nor is FXCM responsible for the content, veracity or opinions of third-party speakers, presenters or participants.
USD/CAD Triangle Pattern (24.03.2025)The USD/CAD pair on the M30 timeframe presents a Potential Buying Opportunity due to a recent Formation of a Triangle Pattern. This suggests a shift in momentum towards the upside and a higher likelihood of further advances in the coming hours.
Possible Long Trade:
Entry: Consider Entering A Long Position around Trendline Of The Pattern.
Target Levels:
1st Resistance – 1.4403
2nd Resistance – 1.4435
🎁 Please hit the like button and
🎁 Leave a comment to support for My Post !
Your likes and comments are incredibly motivating and will encourage me to share more analysis with you.
Best Regards, KABHI_TA_TRADING
Thank you.
USD/CAD(20250324)Today's AnalysisToday's buying and selling boundaries:
1.4345
Support and resistance levels:
1.4404
1.4382
1.4368
1.4322
1.4308
1.4286
Trading strategy:
If the price breaks through 1.4345, consider buying, the first target price is 1.4368
If the price breaks through 1.4322, consider selling, the first target price is 1.4 308
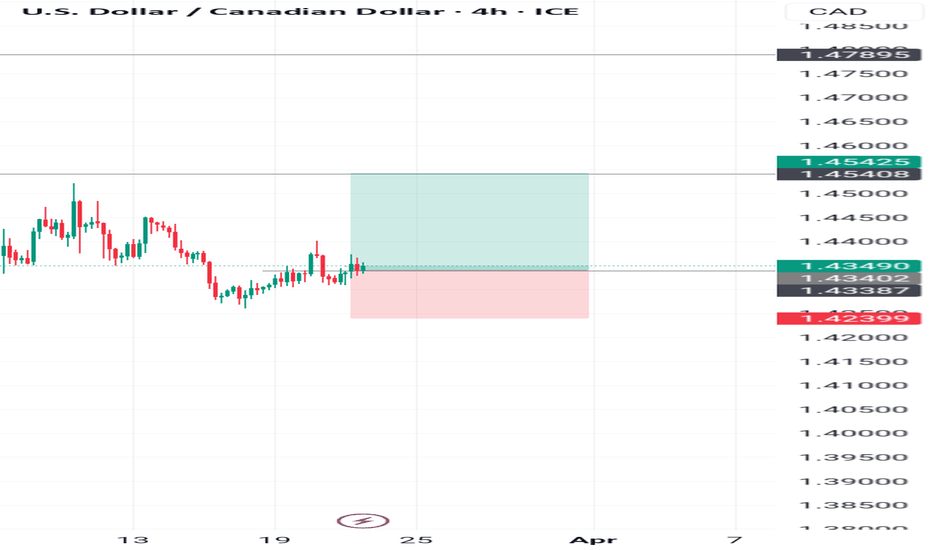
USDCAD - Higher Probability Upside Within Broader CorrectionThe USD/CAD 4-hour chart displays a complex price structure with recent upward momentum after finding support in the blue reaction zone (approximately 1.4250-1.4280). Currently trading around 1.4350, the pair appears poised for continued upside movement, with the higher probability scenario being a break above the orange resistance line at 1.4402. This view is supported by the recent series of higher lows and the bullish reversal from the support zone. However, traders should approach this opportunity cautiously, as we remain within a larger corrective structure in the broader market context. This suggests that while the immediate bias favors upside movement, price may still experience downward swings before a definitive breakout. A prudent approach would be to take this trade piece by piece, using smaller position sizes and tighter risk management to navigate potential volatility until the orange resistance is decisively broken.
Disclosure: I am part of Trade Nation's Influencer program and receive a monthly fee for using their TradingView charts in my analysis.
USD/CAD: Sideways Movement Signals Possible DownsideAfter a bearish move, the USD/CAD pair staged a pullback, forming a long-tailed candle on the daily timeframe that points to a potential retest of the zone above the 1.4200 level. Currently, the market is trading sideways, positioned just above the previous day's low.
If the price breaks and closes below this low, it may attempt to retest the support zone beneath. However, with price action still contained within the weekly range, continued oscillation between the upper and lower boundaries remains possible. A move to the downside is anticipated if the pair holds below the upward trendline, with the next target being the support zone around 1.42615
USDCAD Channel Down aiming for the 1D MA200.The USDCAD pair has been trading within a Channel Down and is currently around the 1D MA50 (blue trend-line) following its latest Lower High formation.
If the current Bearish Leg is as strong as the previous one, we can expect the price to hit at least the 1D MA200 (orange trend-line) at 1.4000.
-------------------------------------------------------------------------------
** Please LIKE 👍, FOLLOW ✅, SHARE 🙌 and COMMENT ✍ if you enjoy this idea! Also share your ideas and charts in the comments section below! This is best way to keep it relevant, support us, keep the content here free and allow the idea to reach as many people as possible. **
-------------------------------------------------------------------------------
💸💸💸💸💸💸
👇 👇 👇 👇 👇 👇


