USDCADBelow is the fundamental analysis for USD/CAD, structured similarly to the provided model:
Fundamental Analysis of USD/CAD (February 2025)
This analysis covers updated macroeconomic indicators, geopolitical factors, data from the Commitment of Traders (COT) report, possible scenarios, and a favorable scenario based on current economic conditions.
1. Macroeconomic Indicators and Monetary Policy
Canada
• GDP and Economic Growth:
• The Canadian economy recorded modest growth of 0.2% in Q4 2024, reflecting cautious expansion amid global uncertainties.
• Inflation:
• Inflation is projected to moderate to around 3.2% by autumn 2025, still above the Bank of Canada’s (BoC) target range.
• BoC Monetary Policy:
• In early February 2025, the BoC maintained its policy stance, with the benchmark rate steady at approximately 5.00%, as officials balance the risks of slowing growth against persistent inflationary pressures.
• Unemployment and Labor Market:
• The labor market remains resilient, though wage pressures and employment growth are being closely monitored in light of global economic headwinds.
United States
• GDP and Economic Growth:
• The US economy continues its robust expansion, driven by strong consumer spending and a resilient labor market.
• Inflation:
• With inflation remaining above the Fed’s 2% target, the US faces ongoing pricing pressures that necessitate a cautious monetary policy.
• Fed Monetary Policy:
• At the latest FOMC meeting, the Federal Reserve kept its benchmark rate within the 4.25% - 4.50% range, maintaining a balance between curbing inflation and supporting growth.
• Unemployment and Labor Market:
• Low unemployment figures continue to underscore the strength of the US labor market.
2. Geopolitical Factors
• Trade Relations and Tariff Policies:
• Given the close trade ties between the US and Canada, any shifts in trade policy—such as potential tariff adjustments or renegotiations of trade agreements—could directly impact the USD/CAD pair.
• Fiscal Policies:
• Expansionary fiscal measures in the US, along with debates over budget deficits, could influence the long-term trajectory of the US dollar relative to the Canadian dollar.
• Energy Markets:
• As Canada is a major energy exporter, fluctuations in global oil prices can have a significant impact on the CAD’s performance, indirectly affecting the USD/CAD exchange rate.
3. Commitment of Traders (COT) Report – February 11, 2025
Non-Commercial Traders (Large Speculators):
• Long Positions: 62,000
• Short Positions: 67,500
• Net Position: -5,500 (net short on CAD relative to USD)
• This suggests that large speculators are currently favoring the US dollar over the Canadian dollar in the near term.
Commercial Traders (Hedgers):
• Long Positions: 90,300
• Short Positions: 78,200
• Net Position: +12,100 (net long on CAD)
• Major institutions and corporations appear more optimistic about the Canadian dollar’s fundamentals over the longer term.
Small Traders (Non-Reportable):
• Long Positions: 4,200
• Short Positions: 3,600
• Net Position: +600 (net long on CAD)
• Indicates a moderately bullish sentiment among retail traders for CAD.
Interpretation:
• The net short position of large speculators on CAD reflects short-term bearish expectations.
• However, the net long positioning by commercial and small traders suggests that institutional and retail players expect a more favorable outlook for the Canadian dollar in the longer term.
4. Possible Scenarios for USD/CAD
Scenario 1: USD Appreciation (Bearish for CAD)
• Triggers:
• Continued robust performance of the US economy and a steadfast, possibly more hawkish Fed policy.
• A dovish tilt by the BoC amid slower domestic growth.
• Outcome:
• USD/CAD could rise, with the pair potentially trading above 1.35.
Scenario 2: Consolidation (Sideways Movement)
• Triggers:
• Mixed economic data from both Canada and the US, with central banks adopting a “wait-and-see” approach.
• Outcome:
• USD/CAD may trade within a narrow range, approximately between 1.32 and 1.35.
Scenario 3: CAD Appreciation (Bullish for CAD)
• Triggers:
• A more robust-than-expected economic performance in Canada, reducing the need for further BoC easing.
• Signs of a slowdown in the US economy prompting a dovish shift by the Fed.
• A favorable move in global energy prices supporting the CAD.
• Outcome:
• USD/CAD could decline, with the pair potentially moving below 1.32.
5. Favorable Scenario Based on Current Data
Medium-Term Favorable Scenario for USD/CAD: Consolidation with a Potential for CAD Appreciation
Reasons:
• While large speculators are net short on the CAD, the longer-term positions held by commercial and small traders indicate growing confidence in the Canadian dollar.
• The fundamentals in Canada—such as steady labor market conditions and resilience in key sectors like energy—support a gradual stabilization.
• Any signs of a more dovish stance by the Fed in response to slowing US growth could further bolster CAD relative to USD.
Target:
• In the coming months, USD/CAD may consolidate in the range of 1.32 to 1.35, with the potential for CAD appreciation driving the pair lower toward 1.32.
6. Disclaimer
This analysis is for educational purposes only and does not constitute investment advice. The Forex market is volatile, and trading decisions should be based on individual research and analysis. Any losses incurred from the use of this analysis are the sole responsibility of the investor.
If you have any further questions or need additional insights, feel free to ask!
USDCAD trade ideas

USDCAD TRADE SETUPWait for retest the key level and bearish momentum then take a trade for Sell otherwise skip this setup

USDCAD Bearish Breakdown: Retest & Drop Incoming? USDCAD Daily Chart Analysis 📉🔥
1️⃣ Trend Breakdown:
The pair was in an uptrend but has now broken below the ascending trendline, signaling a potential bearish shift.
2️⃣ Resistance Zone (Supply Area) 🟦:
The 1.4350 - 1.4450 region acted as resistance, rejecting price strongly.
Multiple rejections in this area indicate strong selling pressure.
3️⃣ Bearish Confirmation 📉:
Price is now trading below the broken trendline.
The recent daily candle closed bearish, confirming sellers are in control.
4️⃣ Key Support Areas 🔍:
1.3957 (200 EMA) → A crucial dynamic support level.
1.3916 → Previous key level that may act as strong demand.
5️⃣ Projected Move ⬇️:
Price may retest the broken trendline (pullback).
If rejection occurs, further drop towards 1.3950 - 1.3910 is likely.
📌 Final Thought:
A bearish move is in play! Watch for a pullback to retest the broken structure before considering further shorts. If price breaks below 1.3950, expect further declines.
💭 What’s your bias? Bulls 🐂 or Bears 🐻?

USD correlation short As the correlation is saying short for USD any Pull back and long entry will be up for the eurusd,GBPusd ,AUDUSD and short for USDCAD

AUDUSD: Another 300+ Pips In Making, Use Proper Risk Management AUDUSD price has broken through the bearish inducement and currently on the way to make another high. Strong bullish presence is likely to pressure the price to create another high. Use accurate risk management.

XAUUSD: $3100 is the next target, Get Ready For the Big Move!Gold is currently making a small correction and looking at how the price is behaved. We are expecting how the price is likely to develop next. Use accurate risk management.

USDCAD wait for a corrective structure before you sellFor USDCAD, looks like market will give us a correction before the drop, you can skip the correction and wait for the sell setup after the completion of the correction

USDCAD Strong Bearish Breakout!
HI,Traders !
USD-CAD keeps going down
After the strong bearish
Breakout of the key horizontal
Level of 1.42823 which is
Now a resistance and as
We are bearish biased we will
Be expecting a further
Bearish move down!
Comment and subscribe to help us grow !

USDCAD BearishUSDCAD retraced from 2020 High, and likely to continue to dive deeper.
1.3950 likely to be supported, at a 1.54 RR.

USD/CAD Testing Trendline Support Before Continuing BullishOn the USD/CAD 5D time frame chart, the price is currently experiencing a significant decline after reaching the resistance area around 1.46721. This pullback remains within the context of a long-term uptrend, as indicated by the ascending trendline, which has repeatedly acted as support since 2021.
The primary scenario in this analysis suggests that the price could retest the support area around the ascending trendline and the previous breakout zone (blue area), located in the 1.38 - 1.39 range. If the price finds strong support in this area and shows signs of reversal, a buy opportunity can be considered, with an upside target back to the 1.46721 resistance level.
In this analysis process, several confirmations should be observed before making an entry decision:
Price Reaction at Trendline Support – If the price shows a strong bounce at this level, the bullish scenario remains valid.
Reversal Candlestick Confirmation – Patterns like bullish engulfing or pin bars can serve as reliable entry signals.
On the other hand, if the price breaks below the trendline significantly, this bullish scenario may become invalid, and USD/CAD could enter a deeper correction phase. Therefore, risk management is crucial, with an ideal stop loss placed below the trendline support.

USDCAD Bearish scenarioWe can clearly see the consolidation on weekly chart.
Past 2 weeks we realy show selling presure.
That for me is confirmation that we will go down more.
The play is long term 1-2 yeras but can't beas easy as that.
So, trade safe!

USDCAD SELL SETUPPrice finally broke the ranging structure. We'll be looking for another opportunity to go short on the pull back!
USDCAD USDCAD quick pullback on Usdcad still on a bearish trend at the moment I do see a continuation on the bearish there is just a minor correction that needs to some on the upside before the continuation keeps going.

USDCAD – looking for value to go short .. the week of 17 FebAs per my analysis, we are seeing a weak USD across all major and minor currency pairs on the weekly and daily time frames. Which pair to trade will probably become clearer on Mon, but for now I am looking at USDCAD.
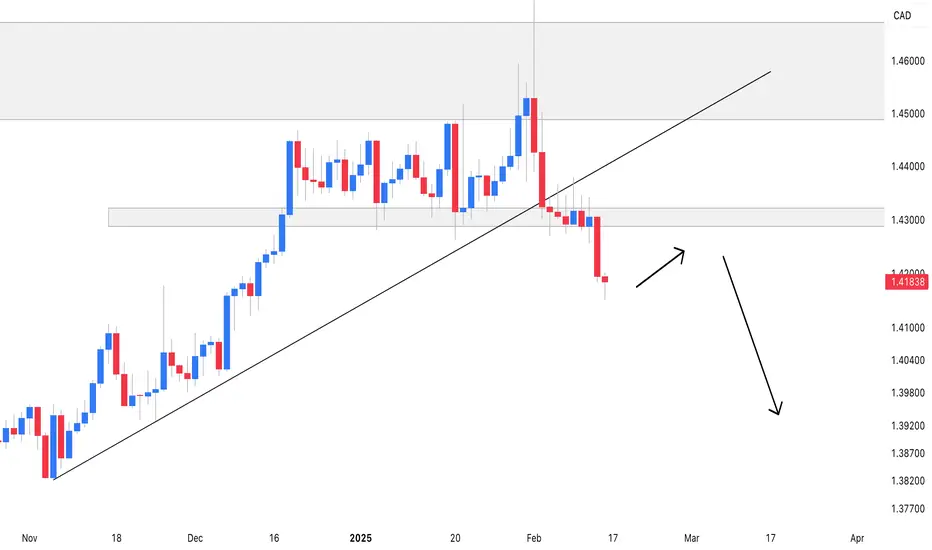
Yes, that huge spike up gap is confusing, but that gap was quickly filled. If I just ignore that gap, the picture becomes clearer; now I find that the price action this entire year was in a range between 1.4468 and 1.4280. This range narrowed considerably to the lower part of the range (see the yellow box) and this led to my bearish bias. On Thu last week, price actually broke down (below the range). It could attempt a pull back to the area I have marked in green. This area is significant, it has acted as support multiple times. I also see that the bearish candles have started becoming larger and I feel that the bears are taking control of this market. If price does pullback to my zone, we could have a good trade location.
Given the scenario I described, I would take a short position, with stop around 1.4350 and initial target at the support near 1.4180. If the downtrend continues with momentum, I will consider extending my trade to a secondary target near 1.3950.
This is not a trade recommendation, merely my own analysis. Trading carries a high level of risk, so only trade with money you can afford to lose and carefully manage your capital and risk. If you like my idea, please give a “boost” and follow me to get even more. Please comment and share your thoughts too!!
It’s not whether you are right or wrong, but how much money you make when you are right and how much you lose when you are wrong – George Soros

USDCAD 2/17 - 2/21Looking towards the left side on the daily timeframe we can see that price has bounced off of a major level of resistance. Zooming into the smaller timeframe on the right side (hour) we can see that price has started to slow down/forming bullish divergence. Could possibly be a nice catch towards the upside.

Weekly USDCAD Short - Wyckoff Upthrust & a triple topAfter the second week closed below the highest bar that poked the previous high we have a strong confirmation to short this Upthrust to the downside. The Poke bar on its own is a sizable one. Our final target is the downside of this range. We also have a Triple Top bearing. On the monthly chart, we are coming from a big downtrend although, on the weekly chart, we can say this is a countertrend trade - we bet that we are in a range at the moment.
Giving and option for take profit target and a final one.
That will be a fairly long trade if it works out properly.

Silver Breaks Key Level: Set to Outperform Gold?Silver prices breach major level and could be set to outperform gold as the dollar weakens.
This content is not directed to residents of the EU or UK. Any opinions, news, research, analyses, prices or other information contained on this website is provided as general market commentary and does not constitute investment advice. ThinkMarkets will not accept liability for any loss or damage including, without limitation, to any loss of profit which may arise directly or indirectly from use of or reliance on such information

USDCAD INTRADAY loss of important supportThe USDCAD currency pair intraday sentiment appears bearish, supported by the confirmed loss of support of the longer-term sideways consolidation trading range. However, since the spike caused by the possible tariff announcement on 03rd February 2024, the USDCAD price action is displaying signs of bearish behaviour. The increase in optimism over the Russia and Ukraine truce triggers the price action. The USD currency remains strong based on the expectation that the Fed will hold interest rates at the current levels for longer. On the other hand, the market expectation for BoC is to continue gradually reducing the interest rates further.
The key trading level is at 1.4260. An oversold rally from the current level and a bearish rejection at 1.4260 level could target additional downside support at 1.4150 followed by the 1. 4100 and 1.4025 levels over the longer timeframe.
Alternatively, an oversold rally from the current levels and a confirmed breakout above 1.4260 resistance and a daily close above that level would negate the bearish outlook opening the way for a further rally and a retest of 1.4300 resistance followed by 1.4350 and 1.4400 levels.
This communication is for informational purposes only and should not be viewed as any form of recommendation as to a particular course of action or as investment advice. It is not intended as an offer or solicitation for the purchase or sale of any financial instrument or as an official confirmation of any transaction. Opinions, estimates and assumptions expressed herein are made as of the date of this communication and are subject to change without notice. This communication has been prepared based upon information, including market prices, data and other information, believed to be reliable; however, Trade Nation does not warrant its completeness or accuracy. All market prices and market data contained in or attached to this communication are indicative and subject to change without notice.

USDCAD H4 ShortThe price has passed the support level. We can wait for a return to the level and enter on the lower TF. Or open on the market.

USDCAD (Bearish)USD hit its monthly Supply & resistance zone against CAD finally, as we predicted this probability previously with our students. Now I expect to follow this pattern at least till we reach a demand level. Great for other assets to perform against dollar.

USD/CAD Retest Nearing Completion, Strong Bullish Wave Incoming USD/CAD is trading at approximately 1.4170.Our target price of 1.8000 suggests an anticipated upward movement of over 38,000 pips, indicating a highly bullish outlook. You note that the pair is completing a retesting period, potentially leading to a strong bullish wave.
Technical analysis indicates that USD/CAD has been consolidating around recent highs, with the market awaiting key economic data to determine its next direction. A significant support level to monitor is 1.3950; a break below this level could shift the bias from bullish to bearish. Conversely, maintaining support above this level may reinforce the bullish scenario.
Fundamentally, the Canadian dollar has recently strengthened, reaching a two-month high against the U.S. dollar. This appreciation was driven by a decrease in U.S. bond yields and positive Canadian labor market data, including a drop in the unemployment rate to 6.6% and the addition of 76,000 new jobs in January 2025. These factors have eased concerns about an economic slowdown in Canada.
In summary, while the USD/CAD pair is currently exhibiting consolidation, the completion of the retesting period could lead to a strong bullish wave toward your target price. Traders should closely monitor key support levels and upcoming economic data releases to make informed decisions.

USDCAD (4H) - Bearish Break of Consolidation ZoneOANDA:USDCAD
📶Technical Analysis:
Weekly Chart:
🟠 Price is in a long-term bullish trend, confirmed by a trendline formed since 2021 and 3 MAs aligned bullish.
🟡 Price tested major resistance at 1.4600-1.4700, which was previously tested in 2016 and 2020.
🟢 Strong pullback after testing resistance, indicating a potential bearish reversal pattern.
Daily Chart:
🟢 Strong bearish candle on the daily chart confirms that the weekly resistance holds.
🟡 Price volatility influenced by Trump's tariff decision.
🟢 The bearish momentum on the daily chart confirms the trend reversal from bullish to bearish.
🔴 The next strong support is around 1.3900, where the price has failed to break five times.
4H Chart:
🟡 Price has been consolidating since Dec 2024 between 1.4450 (resistance) and 1.4300 (support).
🟡 Price initially broke above the range due to tariff news but quickly returned to the consolidation zone.
🟢 Strong bearish candle broke through the lower support at 1.43, signaling potential bearish continuation.
🟢 The break of support suggests a bearish outlook, with the next targets near 1.3900.
🟢 The Moving Averages (MAs) are crossing, indicating a potential shift to a bearish trend.
🔤 Summary:
🟡 Waiting for a retest of the broken 1.43 support level to confirm the bearish trend continuation.
🟡 Expecting a correction in the bearish trend with the formation of additional signal candles that confirm the bearish momentum after the retracement.
🟡 Watch for the formation of bearish candles after the correction, either near the broken support level or EMA levels for confirmation before entering the bearish trade.

market totally forgot trump's first term or what?market totally forgot trump's first term or what?
wick lows setups at key levels
track the news
The macro case is building for this Friday. Great spikes to play at the zones identified.
Check out our socials for some nice insights.
Let us know if there're any pair you like to see or if this is something you like.
Do ask if you have any question
Not as refined as our direct trade setups. More for advanced active traders.
information created and published doesn't constitute investment advice!
NOT financial advice
