USDCAD 15-Min Setup: Buyers Defend Crucial ZoneGood morning traders,
Trust you are doing great.
Kindly go through my analysis of USDCAD currency pair.
Overview
The USDCAD M15 chart presents a bullish price setup around the 1.38350–1.38410 support zone, with current price action consolidating just above this area.
Idea
Price bounced off the key support zone (blue box), suggesting buyer interest. The BB Squeeze momentum indicator shows weakening selling pressure, which could signal an upcoming bullish move.
Key Support: 1.38350
Upside Targets: 1.38650, 1.38880, and 1.39039
Invalidation: Setup fails if price breaks below 1.38280
From the fundamental context, we can see that the Canadian dollar (CAD) is moving more in sync with the U.S. dollar (USD) again, a return to its historical behavior. This happens because Canada was spared from certain tariffs, making its economy more closely tied to U.S. growth sentiment—a key bullish factor for CAD when the USD strengthens. But because CAD is now closely tied to U.S. sentiment, CAD won't weaken as sharply, which might explain why the price is consolidating instead of spiking aggressively. As such, we might see a slow but steady move on the pair as time progresses.
Conclusion
As long as the price holds above the 1.38350 support zone, a bullish continuation toward the mentioned targets is likely.
Cheers and happy trading.
USDCAD trade ideas

USD/CAD – Major Trendline Rejection + Bullish Reversal ZoneUSD/CAD is currently forming a bullish reversal setup on the weekly timeframe, suggesting a potential longer-term move to the upside.
Right now, the price is rebounding from a long-term ascending trendline, which has acted as dynamic support since 2021. This level also aligns with a prior resistance-turned-support zone, adding confluence. Volume has spiked recently, signaling strong market interest at this level. ⚠️
If price holds above 1.3800 and breaks above the recent weekly highs, we could see a bullish continuation toward the 1.4650–1.4800 supply zone. 🎯
🔹 Trade Setups to Consider:
1️⃣ Weekly Trendline Bounce Entry 📍 Entry: 1.3886
🛑 Stop Loss: 1.3723
🎯 Targets: 1.4140 ➡️ 1.4650
2️⃣ Breakout & Retest Entry 📍 Entry: 1.4140 (on retest after breakout)
🛑 Stop Loss: 1.3950
🎯 Target: 1.4800
📌 Risk Management Tip: This setup is based on a higher timeframe, so wider stops and longer holding periods are expected—size your positions accordingly.
💬 What’s your view on USD/CAD? Drop your thoughts below 👇
#Forex #TradingSetup #WeeklyChart #PriceAction #TechnicalAnalysis #TradeIdeas #USDCAD #TrendlineSupport #BullishReversal #MacroSetup

[USDCAD] Trade ideaOn this forex pair I am now looking for a swing long position to build step by step. Here we have my main level of interest and the price action start to switch from short to potential long.
I take the trade and still manage it live.
Great Trade !

USDCAD Swing ShortJust set and forget. Trump's goal is for a weak Dollar to balance the trade deficit.

USDCAD Bounce from New Swing Low — Still BearishUSDCAD 🇺🇸🇨🇦 has created a new swing low at 1.37871 and is starting to bounce.
However, my overall bias remains bearish toward the next major target of 1.34380 — an easy 300 pips from where we are now.
🟡 Sell interest zones:
1.39621 (pullback and rejection)
1.37871 (continuation)
1.36647 (breakdown)
1.35432 (breakdown)
🎯 Final target: 1.34380 before reassessing.

USD/CAD BUYERS WILL DOMINATE THE MARKET|LONG
Hello, Friends!
We are now examining the USD/CAD pair and we can see that the pair is going down locally while also being in a downtrend on the 1W TF. But there is also a powerful signal from the BB lower band being nearby indicating that the pair is oversold so we can go long from the support line below and a target at 1.387 level.
Disclosure: I am part of Trade Nation's Influencer program and receive a monthly fee for using their TradingView charts in my analysis.
✅LIKE AND COMMENT MY IDEAS✅

USDCAD: B tradeA page from my trading journal. Please take it with a grain of salt, as I’m still learning and growing 🌟
• Will become B+ if price pulls to VWAP and rejects
• A if it forms a failed breakout above 1.39 followed by strong bear reversal bar

Canadian Dollar vs. US Dollar. The Spring Is Compressing.In previous posts, we have already begun to look at the key drivers of the US outperformance over the past decade.
The US market dominance has been largely driven by the rapid rise of tech giants (such as Apple, Microsoft, Amazon and Alphabet), which have benefited from strong profit growth, global market reach and significant investor inflows.
Unsatisfactory International Performance
Markets outside the US have faced headwinds including multiple stifling sanctions and tariffs, slowing economic growth, political uncertainty (especially in Europe), a stronger US dollar and the declining influence of high-growth tech sectors.
The Valuation Gap
By 2025, US equities will be considered relatively expensive compared to their international peers, which may offer more attractive valuations in the future.
Recent Shifts (2025 Trend)
Since early 2025, international equities have begun to outperform the S&P 500, and European and Asian equities have regained investor interest. Global market currencies are also widely dominated by the US dollar.
Factors include optimism around the following three big themes.
DE-DOLLARIZATION. DE-AMERICANIZATION. DIVERSIFICATION.
De-dollarization is the process by which countries reduce their reliance on the US dollar (USD) as the world's dominant reserve currency, medium of exchange, and unit of account in international trade and finance. This trend implies a shift away from the central role of the US dollar in global economic transactions to alternative currencies, assets, or financial systems.
Historical context and significance of the US dollar
The US dollar became the world's primary reserve currency after World War II, as enshrined in the Bretton Woods Agreement of 1944. This system pegged other currencies to the dollar, which was convertible into gold, making the dollar the backbone of international finance. The United States became the world's leading economic power, and the dollar replaced the British pound sterling as the dominant currency for global trade and reserves.
The dollar has been the most widely held reserve currency for decades. As of the end of 2024, it still accounts for about 57% of global foreign exchange reserves, far more than the euro (20%) and the Japanese yen (6%). However, this share has fallen from over 70% in 2001, signaling a gradual shift and prompting discussions about de-dollarization.
How De-Dollarization Works
Countries looking to reduce their reliance on the dollar are pursuing several strategies:
Diversifying reserves: Central banks are holding fewer U.S. dollars and increasing their holdings of other currencies, such as the euro, yen, British pound, or new alternatives such as the Chinese yuan. While the yuan's share remains small (about 2.2%), it has grown, especially among countries like Russia.
Using alternative currencies in trade: Countries are entering into bilateral or regional agreements to conduct trade in their own currencies rather than using the dollar as an intermediary. For example, China has introduced yuan-denominated oil futures (the "petroyuan") to challenge the petrodollar system. Increasing gold reserves: Many countries, including China, Russia and India, have significantly increased their purchases of gold as a safer reserve asset, reducing their dollar holdings.
Developing alternative financial systems: Some countries and blocs, such as BRICS, are working to develop alternatives to the US-dominated SWIFT payment system to avoid the risk of sanctions and gain true economic and political independence.
Reasons for de-dollarization
The move towards de-dollarization is driven by geopolitical and economic factors:
Backlash against US economic hegemony: The US often uses dollar dominance to impose sanctions and exert political pressure, encouraging countries to seek financial sovereignty.
Rise of new economic powers: Emerging economies like China and groups like the BRICS are seeking to reduce their vulnerability to U.S. influence and promote regional integration and alternative financial infrastructures.
Geopolitical tensions: Conflicts like the war in Ukraine have intensified efforts by countries like Russia to remove the dollar from their reserves to avoid sanctions.
Implications and outlook
While the dollar remains dominant, a more de-dollarized world is already changing global economic power. The U.S. may lose some advantages, such as lower borrowing costs and geopolitical influence. For the U.S. economy, de-dollarization could lead to a weaker currency, higher interest rates, and reduced foreign investment, although some effects, such as inflation from a weaker dollar, could belimited .
For other countries, de-dollarization could mean greater economic independence and less exposure to U.S. policy risks. However, no currency currently matches the dollar’s liquidity, stability, and global recognition, so a full transition is unlikely in the near future .
Summary
De-dollarization is a complex, ongoing process that reflects a gradual shift away from the global dominance of the U.S. dollar. It involves diversifying reserves, using alternative currencies and assets, and creating new financial systems to reduce dependence on the dollar.
Driven by geopolitical tensions and the rise of emerging economic powers, de-dollarization challenges the entrenched role of the dollar but is unlikely to completely replace it anytime soon.
Instead, it is leading to a more multipolar monetary system in international finance, increasing demand for alternative investments to the U.S.
Technical task
The main technical chart is presented in a quarterly breakdown, reflecting the dynamics of the Canadian dollar against the US dollar FX_IDC:CADUSD in the long term.
With the continued positive momentum of the relative strength indicator RSI(14), flat support near the level of 0.70 and a decreasing resistance level (descending top/ flat bottom) in case of a breakout represent the possibility of price growth to 0.80, with the prospect of parity in the currency pair and strengthening of the Canadian dollar to all-time highs, in the horizon of the next five years.
--
Best wishes,
Your Beloved @PandorraResearch Team 😎

USDCAD accumulation phase for long 1.4050-60usdcad stopped making further lower low in daily time frame. 23rd April daily candle made a higher low, indication for strength for coming days. demand zone for long is 1.3840-3800, stop loss: 1.3780, target: 1.4050-50. even weekly trend is down. reversal/counter trend trade. use lower risk please.

USDCAD INTRADAY Downtrend continuation below 1.4060. The USDCAD pair is exhibiting a bearish sentiment, reinforced by the ongoing downtrend. The key trading level to watch is at 1.4060, which represents the current intraday swing low and the falling resistance trendline level.
In the short term, an oversold rally from current levels, followed by a bearish rejection at the 1.4060 resistance, could lead to a downside move targeting support at 1.3780, with further potential declines to 1.3730 and 1.3630 over a longer timeframe.
On the other hand, a confirmed breakout above the 1.4060 resistance level and a daily close above that mark would invalidate the bearish outlook. This scenario could pave the way for a continuation of the rally, aiming to retest the 1.4080 resistance, with a potential extension to 1.4160 levels.
Conclusion:
Currently, the USDCAD sentiment remains bearish, with the 1.4060 level acting as a pivotal resistance. Traders should watch for either a bearish rejection at this level or a breakout and daily close above it to determine the next directional move. Caution is advised until the price action confirms a clear break or rejection.
This communication is for informational purposes only and should not be viewed as any form of recommendation as to a particular course of action or as investment advice. It is not intended as an offer or solicitation for the purchase or sale of any financial instrument or as an official confirmation of any transaction. Opinions, estimates and assumptions expressed herein are made as of the date of this communication and are subject to change without notice. This communication has been prepared based upon information, including market prices, data and other information, believed to be reliable; however, Trade Nation does not warrant its completeness or accuracy. All market prices and market data contained in or attached to this communication are indicative and subject to change without notice.

USDCAD SELL/SHORTBy utilizing levels, historical patterns, , we can formulate a hypothesis that the market might follow a similar trajectory if bearish sentiment prevails.

USDCAD Bears Gain Momentum Below Resistance WallUSDCAD 8D TECHNICAL ANALYSIS
OVERALL TREND
📉 DOWNTREND — Confirmed by multiple moving averages stacked bearishly and recent breakdown from a Pivot High at 1.46560. The Trend Score reads -0.10, signaling growing bearish sentiment, though the current downtrend confidence is moderate (4.8%).
🔴RESISTANCE ZONE
🔴 1.47937 — PIVOT HIGH | SELL STOPLOSS
🔴 1.46560 — SELL ORDER 2
🔴 1.43772 — SELL ORDER 1
🎯ENTRIES & TARGETS
🎯 1.38464 — SELL ORDER & TP 1
🎯 1.34004 — SELL ORDER & TP 2 | Mid-Pivot
🎯 1.30718 — SELL ORDER & TP 3
🎯 1.25643 — EXIT SELL | TP 4
🟢SUPPORT ZONE
🟢 1.24442 — BUY ORDER 1
🟢 1.21463 — BUY ORDER 2
🟢 1.20070 — PIVOT LOW | BUY STOPLOSS
📊INDICATOR SUMMARY
RSI @ 37 — Near oversold, but neutral
MACD — Bearish divergence confirmed (Sell)
Momentum — Weak bullish rebound (Buy)
Stochastic %K — Neutral but nearing oversold (14.64)
Major Moving Averages — Mostly bearish alignment (20/30/50/100/200 EMAs & SMAs all showing Sell)
🤓STRUCTURAL NOTES
Bearish engulfing candle near 1.43772 resistance confirms sell-side pressure
Price rejected near the Pivot High zone (1.46560) and has broken below short-term support
EMA/SMA crossover downward confirms bearish acceleration
Volume Weighted MA also supports a downside continuation
TRADE OUTLOOK 🔎
📉 Short Bias — Valid below 1.43772 with target zones between TP1 @ 1.38464 and TP4 @ 1.25643
📈 Long setups only initiate below 1.24442 support bounce with confluence at the BUY STOP zone (1.20070)
👀 Watch price action at 1.38464 and 1.34004 — key decision zones for mid-trend reversal or continuation
🧪STRATEGY RECOMMENDATION
CONSERVATIVE APPROACH (Trend-Following):
— Entry: 1.43772 retest
— TP Levels: 1.38464 / 1.34004 / 1.30718 / 1.25643
— SL: Above 1.46560
AGGRESSIVE APPROACH (Breakout Pullback):
— Entry: On break and close below 1.38464
— TP: 1.34004 / 1.30718 / 1.25643
— SL: Above 1.40900
“Discipline | Consistency | PAY-tience™” — Let the chart speak and the setup confirm.

USDCAD Long 4/24/2025USD/CAD Long Setup – 4H Demand Bounce + Fib Confluence Ahead of Jobless Claims
Looking to long USD/CAD based on a confluence of technical structure and macro catalysts.
Daily Chart:
Yesterday printed a bullish engulfing candle, signaling strong buyer intent and continuation of the broader uptrend.
4H Chart:
Price pulled back into a 61.8% Fibonacci retracement of the recent leg, aligning perfectly with a well-defined 4H demand zone.
Importantly, no 4H candle has closed below the body of the previous bullish engulfing, suggesting buyers are holding control.
Trade Expectation:
Expecting this to be a correction within a trend, not a reversal — looking for a continuation that retests the highs and pushes for a breakout beyond 1.3900.
Fundamental Catalyst:
Today’s U.S. unemployment claims release will be the key driver. A lower-than-expected print could fuel USD strength and send this pair accelerating to new short-term highs.
Target Zone:
First target is a retest of the recent high; extended target is a break above 1.3900, which opens the door to higher timeframe expansion.
Stop: Just below the 4H demand zone, respecting the structural invalidation of the Fib level.
This is a clean trend-continuation play with both technical alignment and fundamental tailwinds.

BUY USDCAD for bearish trend reversal STOP LOSS : 1.37774 BUY USDCAD for bearish trend reversal
STOP LOSS : 1.37774
Regular Bullish Divergence
In case of Regular Bullish Divergence:
* The Indicator shows Higher Lows
* Actual Market Price shows Lower Lows
We can see a strong divergence on the MACD already and There is a strong trend reversal on the daily time frame chart.....
The daily time frame is showing strength of trend reversal from this strong level of Support so we are looking for the trend reversal and correction push from here .....
TAKE PROFIT : take profit will be when the trend comes to an end, feel from to send me a direct DM if you have any question about take profit or anything
Remember to risk only what you are comfortable with…….trading with the trend, patient and good risk management is the key to success here

USDCAD SHORT Market structure bearish on HTFs 3
entry at both Daily and Weekly AOi
Weekly Rejection At AOi
Daily Rejection at AOi
Previous Daily Structure point
Around Psychological Level 1.38500
H4 Candlestick rejection
Rejection from Previous structure
Levels 4.49
Entry 105%
REMEMBER : Trading is a Game Of Probability
: Manage Your Risk
: Be Patient
: Every Moment Is Unique
: Rinse, Wash, Repeat!
: Christ is King.

Potential bullish rise?USD/CAD has reacted off the resistance level which is an overlap resistance and could rise from this level to our take profit.
Entry: 1.3844
Why we like it:
There is an overlap resistance level.
Stop loss: 1.3781
Why we like it:
There is a pullback support level.
Take profit: 1.4029
Why we like it:
There is a pullback resistance level that lines up with the 50% Fibonacci retracement.
Enjoying your TradingView experience? Review us!
Please be advised that the information presented on TradingView is provided to Vantage (‘Vantage Global Limited’, ‘we’) by a third-party provider (‘Everest Fortune Group’). Please be reminded that you are solely responsible for the trading decisions on your account. There is a very high degree of risk involved in trading. Any information and/or content is intended entirely for research, educational and informational purposes only and does not constitute investment or consultation advice or investment strategy. The information is not tailored to the investment needs of any specific person and therefore does not involve a consideration of any of the investment objectives, financial situation or needs of any viewer that may receive it. Kindly also note that past performance is not a reliable indicator of future results. Actual results may differ materially from those anticipated in forward-looking or past performance statements. We assume no liability as to the accuracy or completeness of any of the information and/or content provided herein and the Company cannot be held responsible for any omission, mistake nor for any loss or damage including without limitation to any loss of profit which may arise from reliance on any information supplied by Everest Fortune Group.

Daily Price Action: USDCAD Wednesday 4/23/2025In this video, we will be looking into the potential price action of USDCAD.

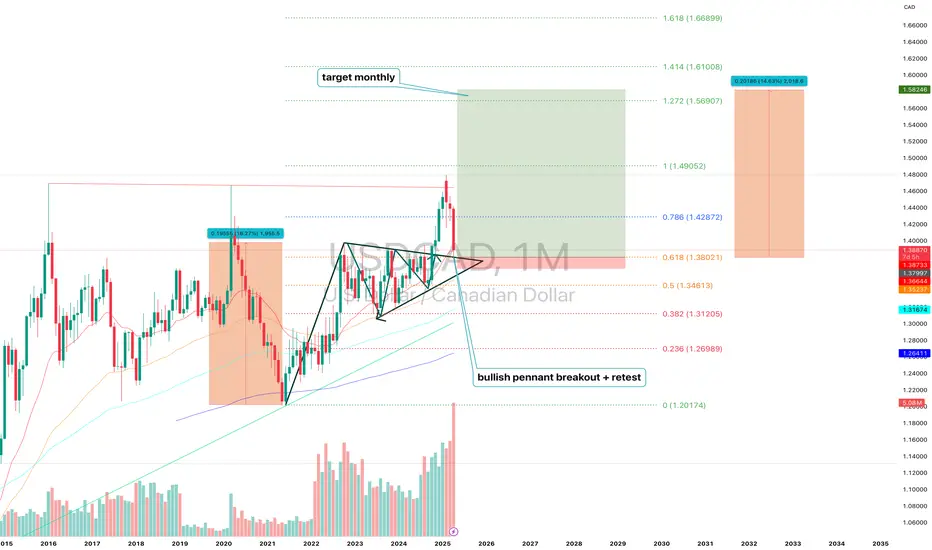
USDCAD (1M) Bullish Pennant Structure and H ProjectionUSDCAD (1M) — Technical and Fundamental Analysis: Bullish Pennant Structure and H Projection
On the monthly chart of USDCAD, a bullish pennant structure has been formed and confirmed with a breakout followed by a clean retest of the upper boundary. The price broke out of the consolidation zone with momentum and is currently holding above the key support at 1.3802. The structure remains active: the first target based on the projected move is 1.4905. If the impulse continues and the market structure remains intact, extended targets lie at 1.5690 (1.272), 1.6100 (1.414), and 1.6689 (1.618) Fibonacci expansions. Technically, the 1.3802 level (0.618 retracement) is the critical support. If this zone holds, the bullish scenario remains valid. The nearest resistance is 1.4287 (0.786), and a confirmed break above this level would likely trigger the next phase toward 1.49. Volume increased during the breakout, confirming strong buyer interest.
Fundamentally, the setup is supported by diverging monetary policies: the Bank of Canada has signaled a more dovish stance due to slowing inflation and economic softness, while the Federal Reserve remains more neutral and cautious about rate cuts. In addition, oil prices — a key factor for the Canadian dollar — are under pressure, weakening the CAD further. Broader macro uncertainty and the global demand for USD as a reserve and safe-haven asset continue to support the dollar, strengthening the USDCAD pair.
Conclusion: As long as the price holds above the 1.38 zone and confirms above 1.4287, the bullish structure remains in play with a target of 1.4905 and potential extensions to 1.5690–1.6100.
USDCAD BUY*Trendline unbroken
* Weak sell side continuity
* Buying targeting reference point following a lower low broken
* Volume imbalance recovered

uptrendThe downtrend is expected to end at the current support area and we will see the start of the upward trend.
Otherwise, the downtrend is likely to continue to the next support levels.

USD/CAD H1 | Rising into a multi-swing-high resistanceUSD/CAD is rising towards a multi-swing-high resistance and could potentially reverse off this level to drop lower.
Sell entry is at 1.3849 which is a multi-swing-high resistance that aligns with the 38.2% Fibonacci retracement.
Stop loss is at 1.3915 which is a level that sits above the 61.8% Fibonacci retracement and an overlap resistance.
Take profit is at 1.3735 which is a support level that aligns with the 161.8% Fibonacci extension.
High Risk Investment Warning
Trading Forex/CFDs on margin carries a high level of risk and may not be suitable for all investors. Leverage can work against you.
Stratos Markets Limited (tradu.com):
CFDs are complex instruments and come with a high risk of losing money rapidly due to leverage. 63% of retail investor accounts lose money when trading CFDs with this provider. You should consider whether you understand how CFDs work and whether you can afford to take the high risk of losing your money.
Stratos Europe Ltd (tradu.com):
CFDs are complex instruments and come with a high risk of losing money rapidly due to leverage. 63% of retail investor accounts lose money when trading CFDs with this provider. You should consider whether you understand how CFDs work and whether you can afford to take the high risk of losing your money.
Stratos Global LLC (tradu.com):
Losses can exceed deposits.
Please be advised that the information presented on TradingView is provided to Tradu (‘Company’, ‘we’) by a third-party provider (‘TFA Global Pte Ltd’). Please be reminded that you are solely responsible for the trading decisions on your account. There is a very high degree of risk involved in trading. Any information and/or content is intended entirely for research, educational and informational purposes only and does not constitute investment or consultation advice or investment strategy. The information is not tailored to the investment needs of any specific person and therefore does not involve a consideration of any of the investment objectives, financial situation or needs of any viewer that may receive it. Kindly also note that past performance is not a reliable indicator of future results. Actual results may differ materially from those anticipated in forward-looking or past performance statements. We assume no liability as to the accuracy or completeness of any of the information and/or content provided herein and the Company cannot be held responsible for any omission, mistake nor for any loss or damage including without limitation to any loss of profit which may arise from reliance on any information supplied by TFA Global Pte Ltd.
The speaker(s) is neither an employee, agent nor representative of Tradu and is therefore acting independently. The opinions given are their own, constitute general market commentary, and do not constitute the opinion or advice of Tradu or any form of personal or investment advice. Tradu neither endorses nor guarantees offerings of third-party speakers, nor is Tradu responsible for the content, veracity or opinions of third-party speakers, presenters or participants.

USDCAD: Breakout & Bearish Continuation 🇺🇸🇨🇦
USDCAD broke and closed below a key intraday/daily horizontal support cluster.
I expect a bearish trend continuation after its retest.
Next goal - 1.376
❤️Please, support my work with like, thank you!❤️
I am part of Trade Nation's Influencer program and receive a monthly fee for using their TradingView charts in my analysis.

USDCADUSDCAD
- Completed " 12345 " Impulsive Waves
- Break of Structure
- Fibonacci Level - 38.20% - 50.00%
- Order Block
- Bullish Channel as an corrective pattern in Short Time Frame
