USDCAD 1 Hr ChartAttached is the 15 minute chart for USDCAD, posting for further utilization. I'm interested in smart money concepts and ict
USDCAD trade ideas

USDCAD 15 M ChartAttached is the 15 minute chart for USDCAD, posting for further utilization. I'm interested in smart money concepts and ict

USDCAD Bear Flag pattern still in play, POST BOCIntraday Update: The USDCAD slipped to bear flag support following the interest rate decision. The market was trading short CAD in hopes of a cut, and was disappointed. A break of the 1.3830 level would open up channel support at 1.3760. The BOC presser is ongoing at time of writing.

USDCAD Long IdeaUSDCAD form a breakdown from a tringle with MMC (Mirror Market structure ) it will repeat it self and and gonna go up again in the triangle.
#USDCAD

USDCADTook the first wave of USDCAD and rode that successfully and we've have been given a re-entry for yet another long position. The pair is on some recovery as it makes it's way to the downside on the overall timeframe so entry has to be calculated carefully.
Trump's Tax tariffs, some friction with Canada, lingering war between Russia, the EU and Ukraine really having some effects on this pair
We would ride this pair all the way to the upside carefully so, brace up!

USDCAD INTRADAY bearish below 1.4060The USDCAD pair is exhibiting a bearish sentiment, reinforced by the ongoing downtrend. The key trading level to watch is at 1.4060, which represents the current intraday swing low and the falling resistance trendline level.
In the short term, an oversold rally from current levels, followed by a bearish rejection at the 1.4060 resistance, could lead to a downside move targeting support at 1.3825, with further potential declines to 1.3700 and 1.3540 over a longer timeframe.
On the other hand, a confirmed breakout above the 1.4060 resistance level and a daily close above that mark would invalidate the bearish outlook. This scenario could pave the way for a continuation of the rally, aiming to retest the 1.4160 resistance, with a potential extension to 1.4270 levels.
Conclusion:
Currently, the USDCAD sentiment remains bearish, with the 1.4060 level acting as a pivotal resistance. Traders should watch for either a bearish rejection at this level or a breakout and daily close above it to determine the next directional move. Caution is advised until the price action confirms a clear break or rejection.
This communication is for informational purposes only and should not be viewed as any form of recommendation as to a particular course of action or as investment advice. It is not intended as an offer or solicitation for the purchase or sale of any financial instrument or as an official confirmation of any transaction. Opinions, estimates and assumptions expressed herein are made as of the date of this communication and are subject to change without notice. This communication has been prepared based upon information, including market prices, data and other information, believed to be reliable; however, Trade Nation does not warrant its completeness or accuracy. All market prices and market data contained in or attached to this communication are indicative and subject to change without notice.

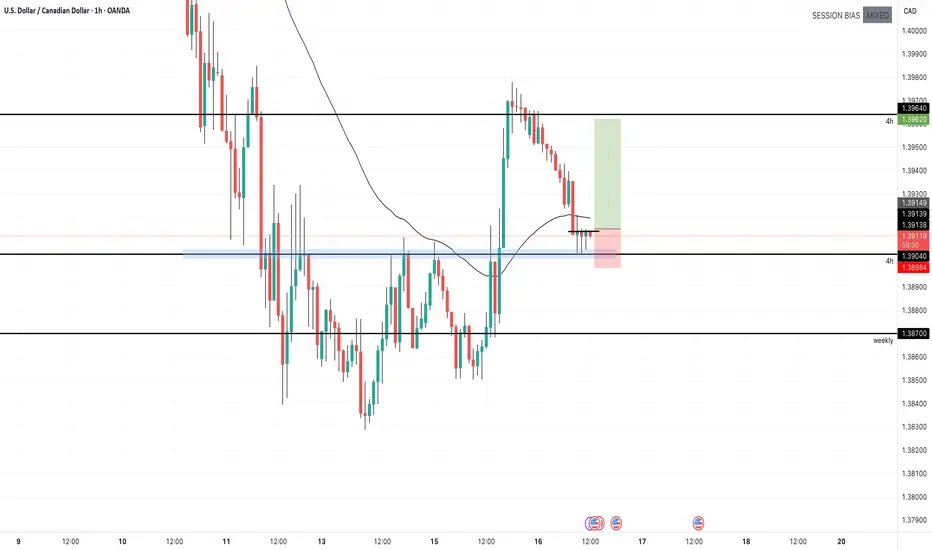
USD/CAD – Bullish Reversal Zonea at Trendline + Morning StarUSD/CAD is currently forming a bullish reversal setup, which often signals a potential upside move.
Right now, the price is testing a key support and a historical demand zone, while also printing a Morning Star candlestick pattern on the daily timeframe, which is a classic bullish reversal signal. ⚠️
If buyers hold the trendline and we see a breakout above the recent minor high around 1.3950, we could see a bullish move toward the 1.4050–1.4170 zone. 🎯
🔹 Trade Setups to Consider:
1️⃣ Aggressive Long (Based on Morning Star Pattern) 📍 Entry: 1.3915
🛑 Stop Loss: 1.38143
🎯 Targets: 1.40248 ➡️ 1.41290
💬 What’s your view on USD/CAD? Drop your thoughts below 👇
#Forex #TradingSetup #PriceAction #TechnicalAnalysis #TradeIdeas #FX #USDCAD #Reversal #MorningStar #CandlestickPatterns #TrendlineSupport

USDCAD Selling not over yet.Last time we looked at the USDCAD pair (March 21, see chart below), we got the most optimal sell entry that easily hit our 1.4000 Target:
As the price broke below its 1D MA200 (orange trend-line) having made a significant correction since the February 03 High, we believe there is more selling to be made at least on the short-term.
That is because the Higher Lows Zone that started on the May 2021 market bottom, hasn't yet been tested and since December 2023, the market always broke inside it before rebounding.
As a result, we expect a new rejection on the 1D MA200, delivering a 1.38200 Target.
-------------------------------------------------------------------------------
** Please LIKE 👍, FOLLOW ✅, SHARE 🙌 and COMMENT ✍ if you enjoy this idea! Also share your ideas and charts in the comments section below! This is best way to keep it relevant, support us, keep the content here free and allow the idea to reach as many people as possible. **
-------------------------------------------------------------------------------
Disclosure: I am part of Trade Nation's Influencer program and receive a monthly fee for using their TradingView charts in my analysis.
💸💸💸💸💸💸
👇 👇 👇 👇 👇 👇

THE LONNIE TANKED IN THE WAKE OF A SOFTER INFLATION READINGThe Lonnie is seen bearish during the Asian session. Meanwhile the overall trend is bearish but rebounded the previous day to close at 1.3958 a cumulative of + 58% for the day. The pair witnessed a slight resistance somewhere around 1.3977 but tanked afterwards and maintained this trajectory today the 16th of April 2025.
The pair is seen hovering around 1.3916 and 1.3904 which serves as minor support while waiting for the next catalyst to drive prices.
Talking about catalyst that drives prices, on the radar yesterday we saw the annual inflation rate in Canada fell to 2.3% in March of 2025 from eight-month high of 2.6% in the previous month, below market expectations that it would remain at 2.6% and below forecasts by the central bank of 2.5%. This decline could further explain the tank in the pair.
UPCOMING CATALYST:
Later today at 4:30PM GMT +4, markets await the release of U.S core retail sales and retail sales m/m simultaneously with a forecast of 0.4% a slight tick up from 0.3% from previous month and 1.3% a significant increase from 0.2% from previous month respectively.
At 5:45PM GMT +4, the BoC would likely hold its interest rate steady at 2.75% for the first it’s holding rate since June 2024.
LEVELS TO WATCH:
In view of the upcoming data release, analyst expects price to tank further to 1.3868 and probably resisted around 1.3833 if the CAD is strengthened against the USD, on the flipside, in the event that the USD gains momentum, then potential target would be around 1.3972 and further rally would eye 1.4071. However, further breakout of these levels is not ruled out as per analyst.

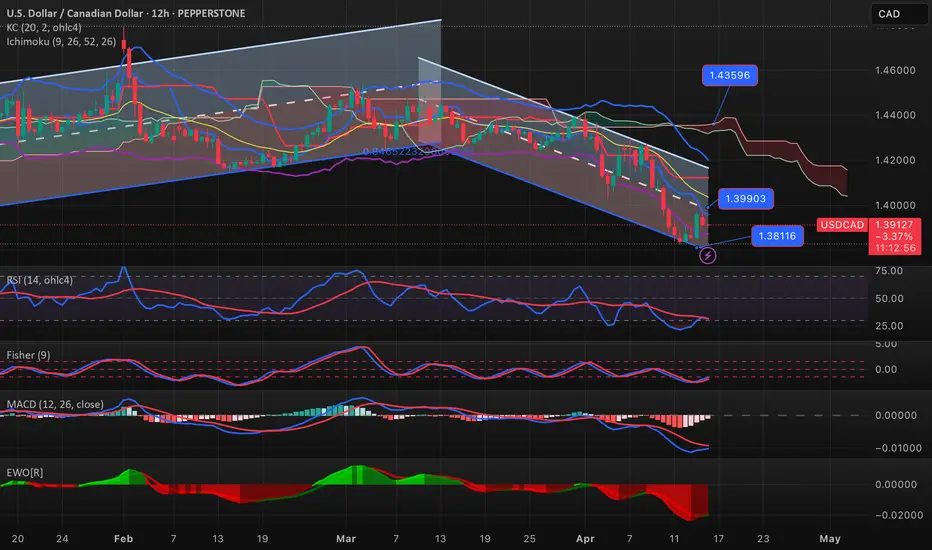
USDCAD-BUY strategy 12 hourly chart - Regression channelsThe pair seems to be in a corrective mode currently. The 90-min chart still has some underlying weakness, but overall we are improving. I feel we may have a chance to test 1.3990 and en-route 1.4078 recovery level.
Strategy BUY @ 1.3875-1.3900 and take profit near 1.4067 for now.
LONG IDEA ON USDCADI am looking to buy USDCAD from the london zone highlighted on my chart, if i dont find a reversal pattern, i will wait for price to drop to the NY zone i mapped out and look for reversals/by opportunity from there.... My major reversal patterns are doube bottom, divergence, or any other reversal candle stick. Good luck

USDJPY and USDCAD analysis todayHello traders, this is a complete multiple timeframe analysis of this pair. We see could find significant trading opportunities as per analysis upon price action confirmation we may take this trade. Smash the like button if you find value in this analysis and drop a comment if you have any questions or let me know which pair to cover in my next analysis.

USDCAD Technical and Order Flow AnalysisOur analysis is based on multi-timeframe top-down analysis & fundamental analysis.
Based on our view the price will rise to the monthly level.
DISCLAIMER: This analysis can change anytime without notice and is only for assisting traders in making independent investment decisions. Please note that this is a prediction, and I have no reason to act on it, and neither should you.
Please support our analysis with a like or comment!

USDCAD Long IdeaWill wait for this long area if we get it if we just miss it will look to enter of a 15min BOS. this is not financial advice. happy trading
33

3 Tips to Make Trading EasierTrading is such a strange beast—both extremely difficult and unparalleled in its simplicity.
Sometimes, we find ourselves floating in effortless flow. Other times, we’re stuck in a storm of confusion, frustration, or overconfidence.
And it’s in these oscillations—the swing between extremes—where the true difficulty lies.
On one end, we show the market less respect than it demands.
On the other, we freeze in fear or get swept away in frustration and rage.
Managing these extremes is part of the trader’s job.
Managing them well… is an art form.
Here are 3 foundational tools that have helped me:
⸻
1. Find. Your. Rhythm.
Each of us is wired differently. Our biochemistry, personality traits, and preferences are all unique—and they absolutely affect how we trade.
Some traders thrive on high-frequency scalping.
Others wait patiently for a single swing setup.
Some feel energized after 6 hours of screen time.
Others burn out after one intense hour.
If you don’t understand your personal rhythm, you’ll constantly be misaligned—not just with your strategy, but with your life.
Workaholics may get bored and start forcing trades.
Laid-back traders may overcommit and burn out fast.
Rhythm isn’t just about preference—it’s about sustainability.
⸻
2. Practice Tolerating Discomfort.
Trading is uncomfortable.
Let’s be real—90% of it ranges from mildly uneasy to outright agonizing.
Practicing discomfort outside of trading has made a huge difference for me:
Cold plunges.
Sadhu boards.
Early morning wake-ups.
Cardio.
Even practicing restraint during family arguments.
These things teach you to sit with that gnawing feeling and not act impulsively.
They train your nervous system to stay stable under pressure.
Trading may not get “easier,” but your capacity for difficulty increases—so it starts to feel easier.
⸻
3. Plan Is Everything.
Trading becomes way simpler when you just show up to execute a plan.
If your plan says there are no trades today—then walk away.
If your plan says take two trades—then take them.
Win or lose, outsource the result to the plan, not to your self-worth.
Then, at the end of a set period (ideally written into the plan), review your execution.
Were you compliant?
What can be adjusted?
A good plan + rhythm alignment + discomfort tolerance = consistency.
⸻
Trading is obviously more complex than three bullet points can capture—but the foundation you can build from these is immense.
Thanks for reading.
Happy trading.
—Lightwork_

USDCAD H4 | Bullish Rise Based on the H4 chart analysis, the price is approaching our buy entry level at 1.3908, a pullback support.
Our take profit is set at 1.4055, a pullback resistance that aligns with the 50% Fibo retracement.
The stop loss is placed at 1.3828, a swing low support level.
High Risk Investment Warning
Trading Forex/CFDs on margin carries a high level of risk and may not be suitable for all investors. Leverage can work against you.
Stratos Markets Limited (tradu.com):
CFDs are complex instruments and come with a high risk of losing money rapidly due to leverage. 63% of retail investor accounts lose money when trading CFDs with this provider. You should consider whether you understand how CFDs work and whether you can afford to take the high risk of losing your money.
Stratos Europe Ltd (tradu.com):
CFDs are complex instruments and come with a high risk of losing money rapidly due to leverage. 63% of retail investor accounts lose money when trading CFDs with this provider. You should consider whether you understand how CFDs work and whether you can afford to take the high risk of losing your money.
Stratos Global LLC (tradu.com):
Losses can exceed deposits.
Please be advised that the information presented on TradingView is provided to Tradu (‘Company’, ‘we’) by a third-party provider (‘TFA Global Pte Ltd’). Please be reminded that you are solely responsible for the trading decisions on your account. There is a very high degree of risk involved in trading. Any information and/or content is intended entirely for research, educational and informational purposes only and does not constitute investment or consultation advice or investment strategy. The information is not tailored to the investment needs of any specific person and therefore does not involve a consideration of any of the investment objectives, financial situation or needs of any viewer that may receive it. Kindly also note that past performance is not a reliable indicator of future results. Actual results may differ materially from those anticipated in forward-looking or past performance statements. We assume no liability as to the accuracy or completeness of any of the information and/or content provided herein and the Company cannot be held responsible for any omission, mistake nor for any loss or damage including without limitation to any loss of profit which may arise from reliance on any information supplied by TFA Global Pte Ltd.
The speaker(s) is neither an employee, agent nor representative of Tradu and is therefore acting independently. The opinions given are their own, constitute general market commentary, and do not constitute the opinion or advice of Tradu or any form of personal or investment advice. Tradu neither endorses nor guarantees offerings of third-party speakers, nor is Tradu responsible for the content, veracity or opinions of third-party speakers, presenters or participants.

Long trade
1Hr TF overview
📈 Trade Breakdown – Buy-Side (USDCAD)
📅 Date: Monday, April 14, 2025
⏰ Time: 4:30 PM (NY Time) – NY Session PM
📈 Pair: USDCAD
🧭 Direction: Long (Buy)
Trade Parameters:
Entry: 1.38575
Take Profit (TP): 1.39845 (+0.91%)
Stop Loss (SL): 1.38261 (–0.23%)
Risk-Reward Ratio (RR): 4.83 ✅
🧠 Trade Narrative:
A late NY session long idea capitalising on:
End-of-day liquidity imbalances and price rejecting a discount level after a pullback into demand (PD Array for measure - discount vs premium)

BOC decision - trading the uncertaintyMarkets are narrowly leaning toward no rate cut from the Bank of Canada this Wednesday. Markets were pricing a 58% chance of a pause as of Friday last week. With traders nearly evenly split, short-term volatility in USD/CAD is possible.
While the Bank had previously signaled it would "proceed carefully" on future rate cuts, that guidance came before the heightened risks tied to the U.S. “Liberation Day” tariff announcements.
From a technical standpoint, there are early signs the pair may be forming a near-term bottom. If the BOC holds rates steady, USD/CAD could retake its 200-day moving average, opening the door for a move toward resistance near 1.4100.

USDCAD LONG UPDATEAs I told in the last trade idea USDCAD is BULLISH and if price keeps holding we might see Take Profit hit.


Daily Price Action: USDCAD Tuesday 4/15/2025In this video, we are looking into the potential daily price action of USDCAD.

USD/CAD 1H Breaking Structure: The Start of a New Trend?Hi traders! Analyzing USD/CAD on the 1H timeframe, spotting a potential bullish reversal from a descending wedge pattern:
🔹 Entry: 1.38846
🔹 TP: 1.40286
🔹 SL: 1.37692
Price is bouncing off the lower boundary of a falling wedge, showing signs of bullish divergence with RSI also turning upwards. The breakout of the descending structure may signal a trend reversal or at least a corrective move to the upside.
The RSI is recovering from the oversold region, reinforcing the idea of a possible bullish push. A break and close above the minor resistance zone could confirm the move towards higher levels.
Watching closely for momentum confirmation!
⚠️ DISCLAIMER: This is not financial advice. Every trader must evaluate their own risk and strategy.
