Short trade
Pair BTCUSD
Sellside trade idea
7.00 pm
Tokyo Session PM
Observation of price action via the LND to NY Session
Entry : POI level reached
Entry 66404.5
Profit level 65510.5 (1.35%)
Stop level 66510.5 (0.16%)
RR 8.43
USDCBTC trade ideas

#Bitcoin and 70k Level TonightAs we know on the last days we saw a massive pump into bitcoin and a correction the last time this happen the price went from 60k to 70k in a single night moving 10%.
My prediction is that price come into this uptrend grabbing liquidity and will spyke to the upside massively.
Trump is going to win and price will keep pushing further.
#Bitcoin #70K #Soon

Long Position on BitcoinIm taking a long position on bitcoin after price coldown around 60,000$ Key Level, in over all the bitcoin is steel on a nice uptrend in time frames like 4H.
After the 4.1% Unployment Rate coming much positive this can help shifting the narrative to the upside.

Fib circles from 4 years ago - still accurate... Next week new Fib Timeline. Going up or down? POLONIEX:BTCUSDC

Short trade
Sellside trade
Pair BTCUSDT
Tokyo Session PM
Sat 21st Sept 24
7.00 pm (NY time)
Entry 63537.0
Profit level 62352.5 (1.86%)
Stop level 63745.0 (0.33%)
RR 5.69

The most epic W pattern everBitcoin is accumulating a few months, preparing a strong impulsive move. The mentioned range above the price can be easily passed and we will see first impulse towards 80.000$, and the last impulse around 120-150.000$.

BTC Butterfly Point C ProbableBTC is on it's way to 42-44k. Butterfly point C has likely confirmed at the current 63.8 region which is also the POC of the entire upper range

BTC long capitulationIdeal way for me to get long on BTC and crypto
Just what I would like to see not what will happen

Monthly Camarilla pivots BTCI would watch the L3 for a bounce and be careful of a break or a bounce of the L4. BTC loves to touch these levels. I circled a few eamples of the last few months

BTC Camarilla monthly pivots + gap fillI think btc has a chance of rising from both here (the monthly central pivot) as well as the L3 which could very well wick lower. However as long as we do not violate L4 I think we are still in the same range and structure. I am not convinced this range break either direction this month.

Most like we are dumping now BTC be careful we are likely going As I share already that we are most likely going dump from here this the right area but news makes changes let's see in few hours the market will dump

Bitcoin Update: Heading Towards 52K? The charts are speaking, and Bitcoin's next move looks intriguing! 📊 It seems we're following a familiar pattern, possibly leading us to the 40K to 52K range very soon. 📉📈
Stay tuned as we navigate this exciting journey together! Where do you think Bitcoin is headed next? Drop your thoughts below! 👇💬 #Bitcoin #CryptoUpdate #MarketAnalysis
Bitcoin Update: Heading Towards 52K?

BTC Possible Moves for the Next Few Weeks / MonthsThe markets are designed to fake out in such a way so that when they rise, the least amount of investors will be on board to profit.
Buckle up, buckaroos.
(Hopefully we bounce off the bottom of the white channel and continue upwards though. BTC hasn't acted like this yet after halving... yet everyone is thinking the same way about that. Every time everyone thinks that same way about something investing-related, it doesn't end too well...)

BTC is set to complete the patternBTC price action seems to complete the inverse head and shoulders pattern which has bullish potential to hit $87k. It's a good time to add BTC in your portfolio at this price keeping in mind the longer perspective of BTC to hit $100k.

BTC/USDC looking for buys after capturing stops.Hello everyone !
In this analysis we are waiting for BTC to purge orders below the CRL and enter the liquidity pool so we can start looking at purchases, let's see how the market will behave after the
US Average Hourly, US Non-Farm Employment Change and US Unemployment Rate.
For now, just wait, patience is the key!

BTC-2024 Daily chart projection for the rest of the year.Eliott waves. Projection done on May 11th, 2024. Correction waves until 42-45k range, then impulse waves all the way up to 125-140k.

Bitcoin BTC/USD, updateIn this situation Clearly, Bitcoin price is likely to continue falling towards around 54,000 USD. This conclusion is supported by the appearance of a Rising Wedge (bearish reversal pattern), resistance at 67,000 USD, and the emergence of Bearish Divergence in MACD.
However, this is a risk, and don't use my trading idea accordingly, because my idea may not be accurate all the time, as well as it may not match your trading style. Take care!

Bitcoin $68,700 breakout was a good sign!Bitcoin (BTC) bulls cheered as the price smashed through the $68,700 resistance level, marking a significant milestone. However, the climb has stalled as the coin encounters a new hurdle - the $69,700 to $70,500 resistance zone .
A decisive break above $70,500 could signal further bullish momentum.
This area has historically proven to be a profit-taking zone for experienced traders. The logic is that after a strong upswing, some investors lock in gains, leading to a temporary price dip.

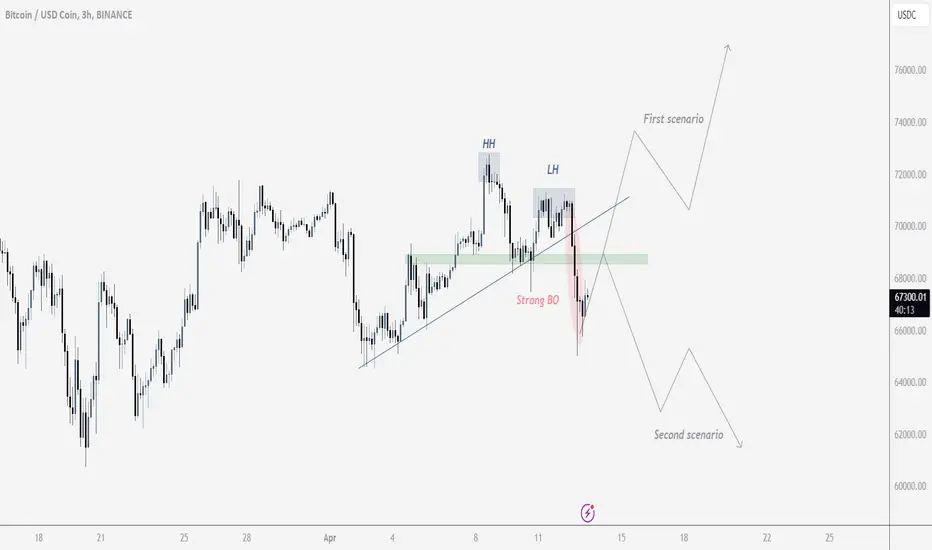
Two scenarios for $BTCThe price could not touch its previous high and also broke the trendline
Considering the stronger downward momentum, I consider scenario 2 more reliable
Bitcoin on Brink of Breakout: Bulls Eye $68,700 as Support HoldsBitcoin (BTC) is currently finding support at $64,500 on the 4-hour time frame. The price is facing resistance at $66,100, and a breakout above this level could lead to a further rise towards $67,400.
If the market shows strength, this breakout could reach a target price of $68,700. Bitcoin's recent price action suggests a potential bullish continuation and a break above $66,300 would be a positive sign for the bulls.
However, it is important to note that the cryptocurrency market remains volatile, and unexpected events could cause the price to reverse course. Traders should carefully manage their risk and consider using stop-loss orders to protect their capital.

BTC/USDT 4HInterval Chart ReviewHello everyone, let's take a look at the BTC to USDT chart on a 4-hour time frame. As you can see, the price came out of the local upward trend line.
Let's start by determining the support line and as you can see, the first support in the near future is $64,988, when the price comes out the bottom, the next one is at $63,198 and then at $60,780. Looking further, we can see two important support zones from $59,393 to $57,736 and the other from $55,543 to $53,976.
Looking the other way, you can see resistance at the level of $68,928 and another one at $71,390, then the resistance zone from $73,225 to $75,642 is important, where the recently formed price peak is located, only when the price leaves it the top can move towards the resistance at level of $82,402.
Looking at the RSI indicator, you can see the moment of breaking from the support line, while the STOCH indicator can be seen falling below the lower limit, which confirms the current decline.

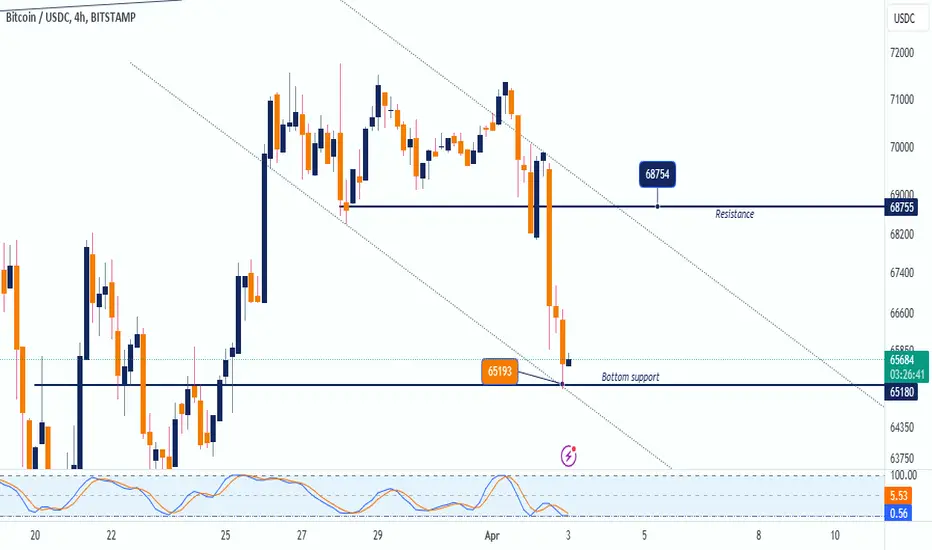
Bitcoin Finds Support After Rejection at $71,200In a recent price movement, Bitcoin encountered resistance at $71,200 on a 4-hour chart timeframe. This rejection indicates that there were more sellers than buyers at that price point, preventing Bitcoin from breaking through.
However, there's some positive news for bulls. The world's leading cryptocurrency appears to have found support at $65,200 . This suggests that buyers emerged at this level, preventing a steeper decline. Analysts are now expecting Bitcoin to potentially touch $68,755 in the near future. It's important to note that this is just a prediction, and the market could move in either direction.
It will be interesting to see if Bitcoin can build on this support and make another attempt to break through the $71,200 resistance level. If successful, this could signal a continuation of the uptrend. Conversely, a drop below $65,200 could indicate further weakness in the short term.
ocaka bosco PROGRAMME SPONSOR CHILDMOTHERS AND ORPHANS FUNDRAISIocaka bosco
PROGRAMME SPONSOR CHILDMOTHERS AND ORPHANS FUNDRAISING Please Come and support the vulnerable women, man orphans and child mothers in the world together thanks
