USDCHF Imbalance Zone Possible Set Up for Bearish ContinuationBased on the current analysis of USDCHF, there's a compelling bearish setup forming on the 4-hour timeframe. Let's dive into the details! 🔍
Fundamental Analysis 💹
USDCHF is currently under significant bearish pressure at 0.8655 📉. The Swiss Franc has been strengthening against the USD, likely due to its safe-haven status amid current market uncertainties. This fundamental backdrop supports our technical bearish bias! 🇨🇭
Technical Analysis on 4H Chart 📈
The price is trading below both the 20 EMA (0.8677) and 50 EMA (0.8715) 📊, confirming the bearish momentum. This bearish EMA alignment creates a perfect environment for short entries! ⚡
Imbalance Zone Opportunity 🎯
There's a clear imbalance zone between 0.8664 - 0.8674 that hasn't been properly retested yet. This zone represents an area where price moved quickly, leaving behind unfilled orders. If price retraces into this zone, it could act as a magnet for sellers! 💰
The Perfect Setup 🔄
Wait for price to retrace into the imbalance zone (0.8664 - 0.8674) ⬆️
Look for bearish price action confirmation (engulfing candles, rejection wicks) 🕯️
Confirm a bearish structure break after the retracement 📉
Enter short position with stops above the recent swing high (~0.8680) 🚫
Target the equilibrium level (0.8661) as first take-profit 🎯
Extended targets at previous lows or 1:2 risk-reward ratio 💸
Risk Management ⚠️
Keep your stop loss tight above the imbalance zone
Consider scaling out at key support levels
Total risk should not exceed 1-2% of your trading capital 💵
This setup offers an excellent risk-to-reward opportunity if executed properly! The bearish momentum is strong, with both EMAs confirming the downtrend. The imbalance zone provides a high-probability entry point for shorts! 🔥
USDCHF trade ideas

USDCHFButterfly pattern in confluence with Deep Crab pattern: look for buys at D point. Expecting one more up before drop.

USD/CHF Collapses to 2025 Lows as Momentum Turns ExtremeThe U.S. dollar just plunged through the 0.8400 handle, cratering to fresh multi-month lows near 0.8145 against the Swiss franc.
📉 Price is decisively below both the 50- and 200-day SMAs
📊 MACD shows deepening downside momentum, well below zero
📉 RSI is in oversold territory at 18.79, highlighting stretched bearish sentiment
While the RSI suggests a short-term bounce could be due, the broader trend has clearly turned bearish. As long as USD/CHF holds beneath the former support at 0.8400, bears remain in control — and the path toward 0.8000 or even lower could be open.
-MW


USDCHF: Bullish Outlook ExplainedIt seems like USDCHF is getting ready for a rebound following a drop last week.
To confirm this, I have observed a strong bullish breakout of a resistance line in a symmetric triangle pattern, along with a noticeable bullish imbalance after reaching a historical low.
Targets are set at 0.8186 and 0.8307.

UsdChf Sell bias Price cleared Fridays High 0.82565 with a nice rejection. My initial point of interest was the H4 open and close level.
Hence the target is the previous day low 0.80983
But scaling down lower timeframe like 20m shows engulfing with inducement that's a confirmation for short. Ride with me
Kindly boost if you find this insightful 🫴

USD/CHF For Bullish as Pull-backwait for pull-back near by entry point and then go long
general trend is down trend
current phase is pull-back and may be finish near by target 3
have fun :)

USDCHF INTRADAY oversold bounce capped at 0.8300Recent price action in USDCHF suggests an oversold bounce, with resistance capping gains at the 0.8300 level.
The continuation of selling pressure could extend the downside move, with key support levels at 0.8090, followed by 0.8040 and 0.7940.
Alternatively, a confirmed breakout above 0.8300, accompanied by a daily close higher, would invalidate the bearish outlook. In this scenario, USDCHF could target 0.8365, with further resistance at 0.8450 and 0.8520.
Conclusion:
The price remains below pivotal level, with 0.8300 acting as a key resistance. Failure to break above this level could reinforce downside risks, while a breakout could shift momentum back in favour of bulls. Traders should watch for confirmation signals before positioning for the next move.
This communication is for informational purposes only and should not be viewed as any form of recommendation as to a particular course of action or as investment advice. It is not intended as an offer or solicitation for the purchase or sale of any financial instrument or as an official confirmation of any transaction. Opinions, estimates and assumptions expressed herein are made as of the date of this communication and are subject to change without notice. This communication has been prepared based upon information, including market prices, data and other information, believed to be reliable; however, Trade Nation does not warrant its completeness or accuracy. All market prices and market data contained in or attached to this communication are indicative and subject to change without notice.

USDCHF LongHi guys,
Hope everyone is still enjoying the lovely big profits we earned on gold, BTC, and EURUSD. We are yet to hit a stop loss this year, which is good.
Anyway, here is our long signal for EUR USD. Wait for the 5 minute candle to close above, and respect the entry.
USD CHF Buy 🦇
📊Entry: 0.81733
⚠️Sl: 0.81531
✔️TP1: 0.81938
✔️TP2: 0.82199
✔️TP3: 0.82530
✔️TP4: 0.82868
Hope you earn lots of profit. Please drop me a comment if you follow the signal
Best wishes
Sarah ETAforex

USD CHF long - swing ideaWith USD in potential demand, there could be an opportunity for a nice swing against the CHF.

USDCHF SELLS Price is overall bearish but it formed a minor support on H1. Ideally, I'd like to see price retrace to the broken support around 0.83600 area.

Weekly FOREX Forecast: Wait for Buys vs USD!This is the FOREX outlook for the week of April 14-18th.
In this video, we will analyze the following FX markets:
USD Index
EUR
GBP
AUD
NZD
CAD
CHF
JPY
The USD is still overall bearish... but is due for a correction. Short term bullishness in the USD is what I am monitoring this week, then aa resumption of it's bearish trend. This will provide
buying opportunities in xxxUSD pairs, and selling opportunities in USDxxx pairs.
Enjoy!
May profits be upon you.
Leave any questions or comments in the comment section.
I appreciate any feedback from my viewers!
Like and/or subscribe if you want more accurate analysis.
Thank you so much!
Disclaimer:
I do not provide personal investment advice and I am not a qualified licensed investment advisor.
All information found here, including any ideas, opinions, views, predictions, forecasts, commentaries, suggestions, expressed or implied herein, are for informational, entertainment or educational purposes only and should not be construed as personal investment advice. While the information provided is believed to be accurate, it may include errors or inaccuracies.
I will not and cannot be held liable for any actions you take as a result of anything you read here.
Conduct your own due diligence, or consult a licensed financial advisor or broker before making any and all investment decisions. Any investments, trades, speculations, or decisions made on the basis of any information found on this channel, expressed or implied herein, are committed at your own risk, financial or otherwise.

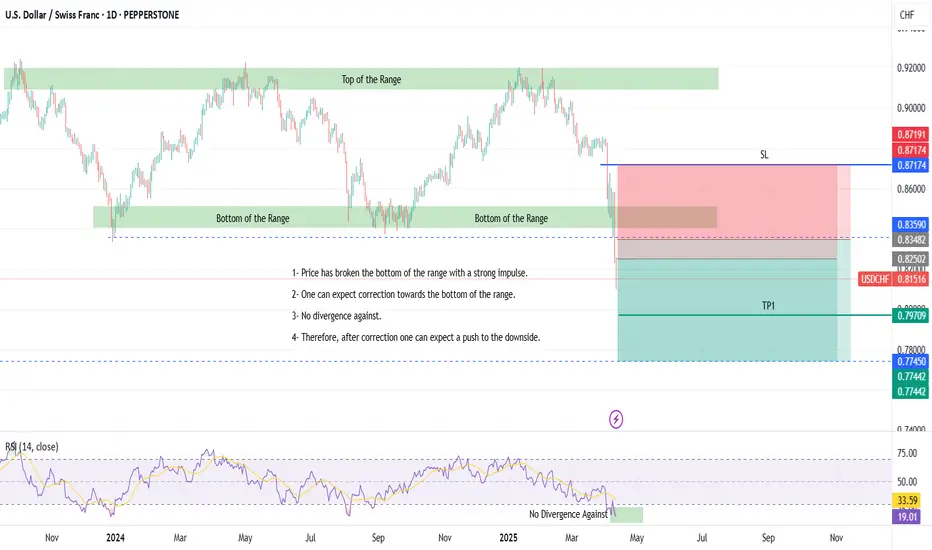
14-04-2025 _ Short Term Bearish Idea _ USDCHF D11- Price has broken the bottom of the range with a strong impulse.
2- One can expect correction towards the bottom of the range.
3- No divergence against.
4- Therefore, after correction one can expect a push to the downside.
USDCHF Break a mjaor Support On Friday, USDCHF broke through the major support level. Enter the trade when it retests this area, which now acts as resistance. The graph indicates the next two significant support levels. Let's observe...

super buy OPP.Hey guys. Wave 2 is about to END and It's time for super sharp wave (Wave 3). Just go long and make your account super big...(wink).

USDCHF - Forecast | 04.202512.04.2025 | Investors blew away key support levels of the pair, rushing en masse into the Swiss Franc, and broke through the psychological mark of 0.82000 in a short period of time. This was due to the likely negative consequences for the US dollar and the economy as a whole from the impact of Trump's policies and his tariff actions. As the consequences are expected to be serious, in the medium term the US dollar will remain under pressure in this currency pair, at least until the end of April. However, a technical upward correction cannot be ruled out, which we will look at in the coming week.
Entry: 0.81800 - 0.81000 | Limits: 0.80300 - 0.79800 | Targets: 0.83600 - 0.84500

USDCHF: Important Historic Structure Breakout 🇺🇸🇨🇭
USDCHF violated a significant weekly support cluster.
That breakout opens a potential for even more decline.
Get ready for the text of 0.8 level and a down movement further.
❤️Please, support my work with like, thank you!❤️
I am part of Trade Nation's Influencer program and receive a monthly fee for using their TradingView charts in my analysis.

Trends and pivot points If you notice when you flip through time frames that pivots coincide they’re usually hit by price points. When rejected they tend to go to lower time frames in search of support or resistance.
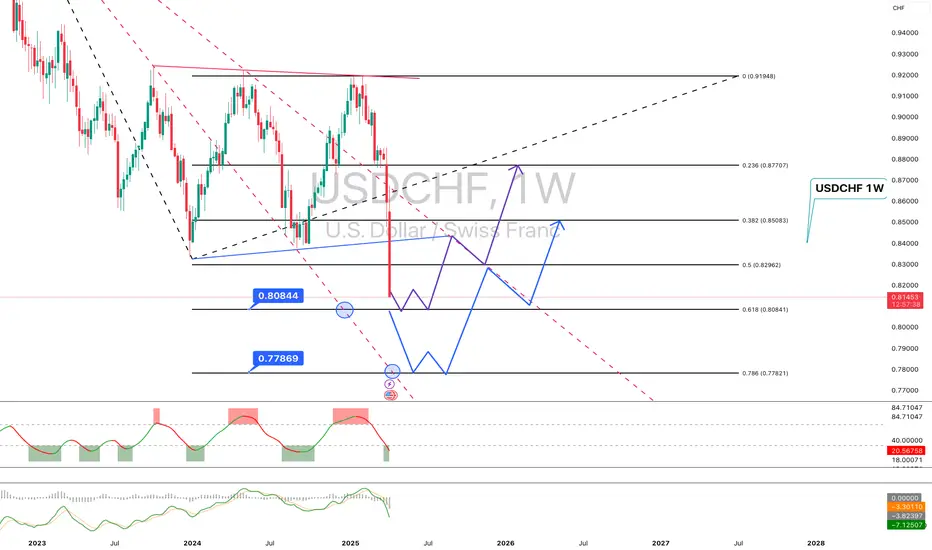
USDCHF (1W) – Preparing for a Potential ReversalThe chart shows strong bearish momentum, but price is approaching a potential demand zone, though it hasn't fully tested it yet. The main focus is on the 0.8080–0.8095 area, aligned with the 0.618 Fibonacci level — a key point where a bounce may occur.
Key Levels:
🔹 Buy Zone #1: 0.8080–0.8095
→ 0.618 Fibonacci, previous consolidation, and a potential reversal point
🔹 Buy Zone #2: 0.7780–0.7800
→ 0.786 Fibonacci, deeper support and lower boundary of the structure
Scenario:
The current structure hints at a possible W-pattern formation after a dip into the demand zone.
If the bullish scenario plays out, potential recovery targets include:
→ 0.8300–0.8500 – initial correction targets
→ 0.8770 – major resistance (Fibo 0.236)
Alternative View:
If price breaks below the 0.7780 level, the structure would shift bearish — next area of interest could form below 0.75.
USDCHF is in a wait-and-watch zone. The downward move continues, but key levels (especially 0.8080 and 0.7780) are worth watching as potential demand zones. There’s a high probability of a technical bounce or reversal setup developing once these zones are tested.
USDCHF this pair has been dropping and it has broken the old lows, we expect it to continue dropping as the dxy is also dropping, price has to retest first the support turned resistance to confirm our sells

Continuation of the Multi-Decade DowntrendWith the US tariff trade wars about to commence, I feel that many investors will once again flock to the venerable Swiss Franc as a safer asset.

USDCHF Wave Analysis – 10 April 2025
- USDCHF broke support zone
- Likely to fall to support level 0.8200
USDCHF currency pair recently broke the support zone between the key support level 0.8400 (which reversed the price multiple times in August and September) and the support trendline of the daily down channel from February.
The breakout of this support zone accelerated the active intermediate impulse wave (3).
USDCHF currency pair can be expected to fall to the next support level 0.8200, which is the target price for the completion of the active impulse wave (3).

90 day plan We’ve been on a range and DXY has a tendency to have breakouts worse than herpes so this to will pass and we should see a rise to a new monthly high
