USDIDR trade ideas
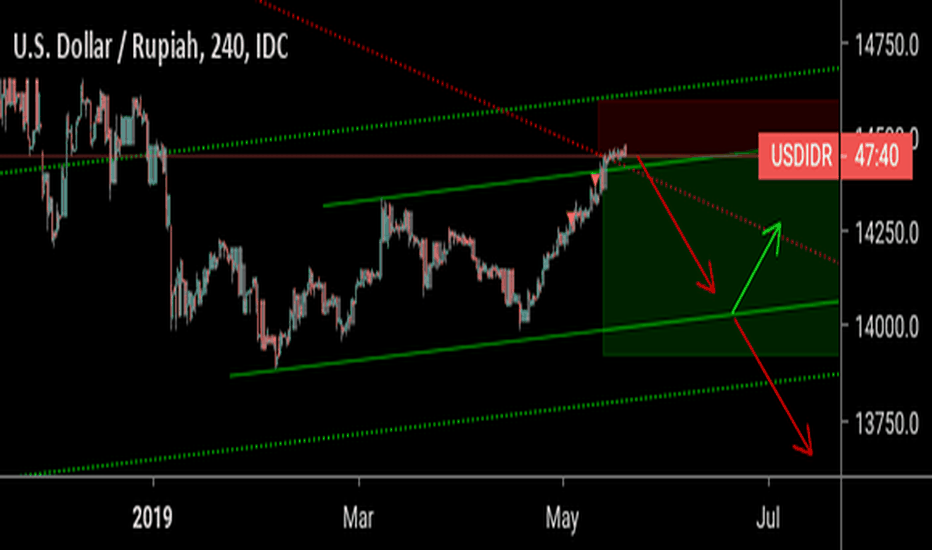
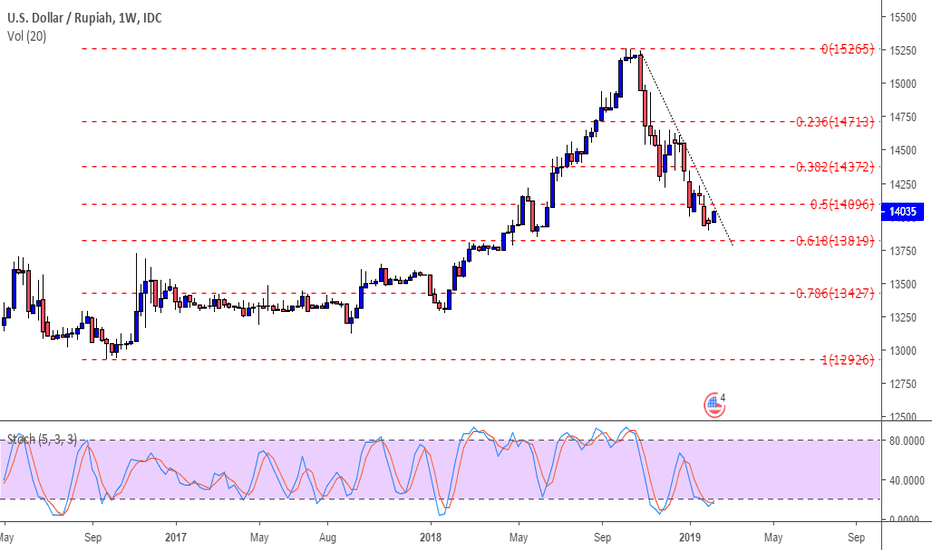
Rising Wedge on Weekly TF- Currently the price is moving inside the Rising Wedge on weekly timeframe and looks like it trying to broke the 1st trendline. Invalidated if the price managed to hold 13200 price for a long time and expect a sideway price movement in between fibonacci line .
- Breaking the 2nd up trend line (bright yellow line) would be devastating for this currency..
let see how this plays out. peace..
Rupiah is in Hazardous RoadFX_IDC:USDIDR
I predict Rupiah (USDIDR) might keep depreciating to more than Rp14,300/USD.
If Rupiah Breakout Resistance (Rp14,300/USD), then the possibility of Rupiah strengthening to Rp13,600/USD or any level below Rp14,000/USD is vanished. Rupiah will be on the verge to keep weakening to its lowest level at Rp15,300/USD.
Rupiah must move below Rp14,000/USD in the next 1-2 weeks to shrink any threats that make Rupiah might keep decreasing to Psychology level at Rp15,000/USD.
USDIDR should rise to Rp14,900/USD, deeper depreciationUSDIDR could move to Rp14,900/USD after finishing consolidating around Rp14,300 - Rp14,400 for almost a month.
By moving above Rp14,000, USDIDR is continuing "Uptrend" to at least Rp14,900 (above highest level at Jokowi's administration at Rp14,800). The depreciation this time might as well bring Rupiah to touch Rp15,000/USD.
USDIDR's weakness will last as Yuan in depreciation modeUSDIDR could and might touch Rp14,800, highest level during President Joko Widodo administration.
There is a possibility Rupiah go beyond Rp14,800 and reach Rp15,000 but i predict it won't happen since Rp14,800 should be a strong psychology Resistance.
However, Rupiah should move within a range of Rp14,300 - Rp14,600 for the rest of 2018.
Rupiah should appreciate below Rp14,200 to open possibility of strengthening below Rp13,xxx again.
USDIDR Points Towards Continuation of WeaknessThe USDIDR also trends with its peers in Singapore and Thailand for continued downward movement. Although weakness in the past week is showing weaker signals in RSI and the bull bear crowd sentiment indicator, nearly all exponential moving averages suggest further continuation of the trend. In spite of this, price action is fast approaching a 2018 trend line which could reappear as long-term support and a reversal, although this is not likely to come to fruition for a number of trading days unless volatility really picks up.
If you would like to see more charts check out www.tradingview.com or if you want more analysis go to www.linkedin.com


