USDJPY: Bullish Trend Reversal?! 🇺🇸🇯🇵
USDJPY formed a strong bullish reversal pattern on a daily,
breaking the underlined daily resistance and confirming
a Change of Character CHoCH.
I believe that the pair will steadily return to a global bullish trend.
The price may grow at least to 147.0 level after a completion of a retracement.
❤️Please, support my work with like, thank you!❤️
USDJPY trade ideas

USD/JPY: 145.00, Trendline ResistanceThe net result of the Bank of Japan rate decision has been Yen-weakness, with USD/JPY initially showing an explosive move with a breakout beyond 145.00. That move couldn't hold, however, with an assist from the underside of a bullish trendline helping to cap the weekly highs, leading to a push back-below the 145.00 handle.
For next week there's remaining bullish structure, which a recent higher-low at 144.00 that bulls need to defend to retain control. But given the broader backdrop of USD-strength going into FOMC, USD/JPY has bullish continuation potential, with levels at 148.00 and 150.00 as the next significant waypoints overhead. - js

Uj might be reversing- We are at a painfully large demand area.
- Price squeezing and consolidating in a dropping wedge.
- Thursday candle was a bullish harami (indicating a possible u-turn)
- Friday was the Good Friday (Market holiday), so it doesn't count
Let us patiently wait here for the price to either break the wedge or at least it hits the lower border of the wedge to place our first entry. The reversal is imminent provided we do not break the demand area. Patience is the key here.
Once we have a full confirmation to buy we will look further for targets, till then just watch it.
I will update you guys when I place my own entry. Pray hard, trade smart :) and best of luck!
Here is the close up look of the wedge:

USDJPY: Bounce on the 17 month Support starting massive rally.USDJPY is neutral on its 1D technical outlook (RSI = 50.306, MACD = -0.870, ADX = 40.251) but is on a massive bounce on the S1 Zone, which has been holding since December 25th 2023. That Low last week also approached the 1W MA200. The LH trendline is the Resistance level of this pattern (Descending Triangle) and since the last one hit the 0.786 Fibonacci, we expect this one to hit the 0.618 Fib (TP = 153.500).
## If you like our free content follow our profile to get more daily ideas. ##
## Comments and likes are greatly appreciated. ##

Can USD/JPY hold THIS key support after a mixed NFP report? The US dollar traded mixed shortly after the NFP was released, as risk-on sentiment remained the prevailing trend. As index futures rose further, commodity dollars extended their gains against the greenback, while the USD/JPY attempted to find support around the key 144.00 - 144.50 area. This zone was resistance in the past so let's see if the UJ will be able to rebound from here later in the session, and in early next week.
NFP comes in stronger, but...
The nonfarm payrolls data “beat” forecasts, with a headline print of 177K vs. 138K eyed. But data for March was revised lower to 185K rom 228K. Revisions to prior two months have taken out 58K from initial estimates. Taken together, this is hardly a beat. But the good news was that full-time employment rose sharply. The unemployment rate, meanwhile, was unchanged at 4.2%.
On the inflation side of things, average earnings came in slightly lower than expected, rising 0.2% on a month-over-month basis, compared with 0.3% expected. Nothing to get too excited over, but potentially good news as far as inflation is concerned – especially after we saw a slightly weaker Core PCE Price Index in mid-week.
NFP was never going to matter much
The market’s focus is on trade war and trade negotiations. We were never going to see any wild market reactions, and so it has so far proved. The US dollar initially spiked then quickly returned to pre-NFP levels. Gold fell, and index futures added onto earlier gains.
Up next: ISM Services PMI on Monday and FOMC on Thursday.
By Fawad Razaqzada, market analyst with FOREX.com


USDJPY 1 day ⚙️ Technical Overview (USD/JPY – 1D)
📉 Trend & Structure:
Rising wedge pattern has been broken to the downside, which is typically a bearish reversal signal.
Price has retested the broken trendline from below near the 147.30 resistance level, confirming structure rejection.
Clear breakdown below both ascending trendlines.
📊 Key Levels:
Resistance:
147.32 (marked on chart, rejected after trendline break)
Minor resistance around 145.90–146.50, former support area turned resistance.
Support:
Nearest horizontal support: 135.00 – 136.00 zone
Major support (and target of measured move): 122.73, also aligned with prior consolidation zone from 2022.
📏 Measured Move:
A measured move suggests a potential drop of -8.43% (~1,229 pips) from the wedge top to the lower trendline support around 133.00–122.70 range.
This aligns with a long-term target near 122.73, which is a major structural level.
🧠 Outlook & Bias:
Bias: Bearish
Momentum: Strong breakdown with retest failure indicates bearish momentum is intact.
Confirmation: A daily close below 144.50 could further confirm downside continuation.
📌 Potential Trade Idea (Not Financial Advice):
Entry: After confirmation below 144.50 or aggressive entry on current retest failure.
SL: Above 147.50 (last swing high & trendline).
TP: First target at 136.00; second target at 122.70

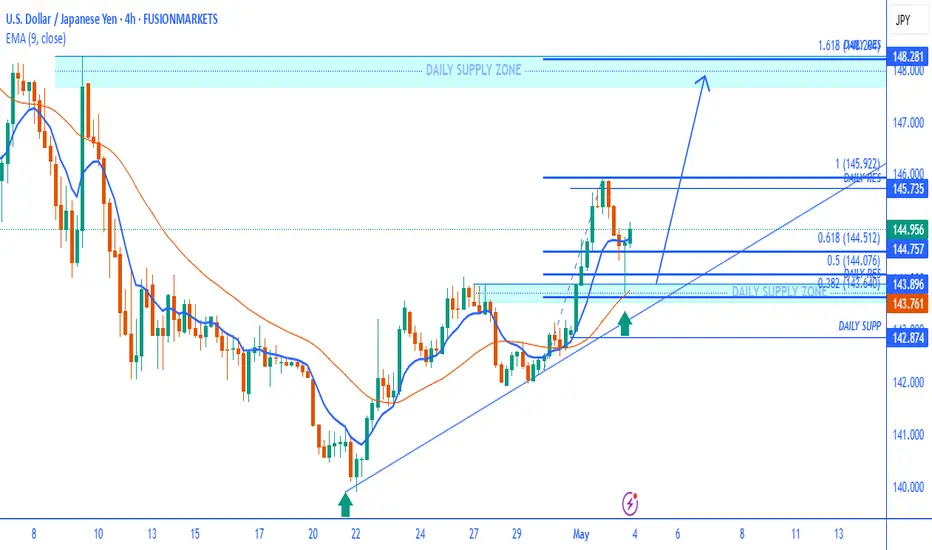
USDJPYThis is a 4-hour chart of the USD/JPY currency pair with a technical analysis setup that includes the following key elements:
Chart Analysis:
Trendline Support:
The price is following an ascending trendline, confirmed by higher lows (marked by green arrows).
The recent bounce off this trendline signals ongoing bullish momentum.
Key Levels & Zones:
Daily Supply Zone: Located around 147.80–148.30, which could act as a major resistance if price rallies.
Daily Resistance: At approximately 145.735, which price is approaching.
Daily Support: Around 142.87, reinforced by trendline confluence.
Fibonacci Retracement:
Fibonacci levels are drawn from the recent swing low to high:
0.382 ≈ 144.05
0.5 ≈ 144.07
0.618 ≈ 144.51
The price recently bounced from near the 0.618 retracement and is now climbing.
Moving Averages:
EMA 9 and EMA 21 are both sloping upward, with the 9 EMA (blue) currently at 144.757 and above the 21 EMA (orange), reinforcing a short-term bullish bias.
Bullish Scenario (highlighted by arrows):
If the price holds above the trendline and the 144.50–144.75 zone, a move toward 145.92 (previous high) is expected.
A break above 145.92 could lead to an extension toward 148.28 (1.618 Fib extension), coinciding with the supply zone.
Summary:
Current Bias: Bullish, as long as price respects the trendline and EMAs.
Confirmation for Continuation: A close above 145.735.
Invalidation: A sustained break below 143.75 or the trendline could shift the bias bearish.
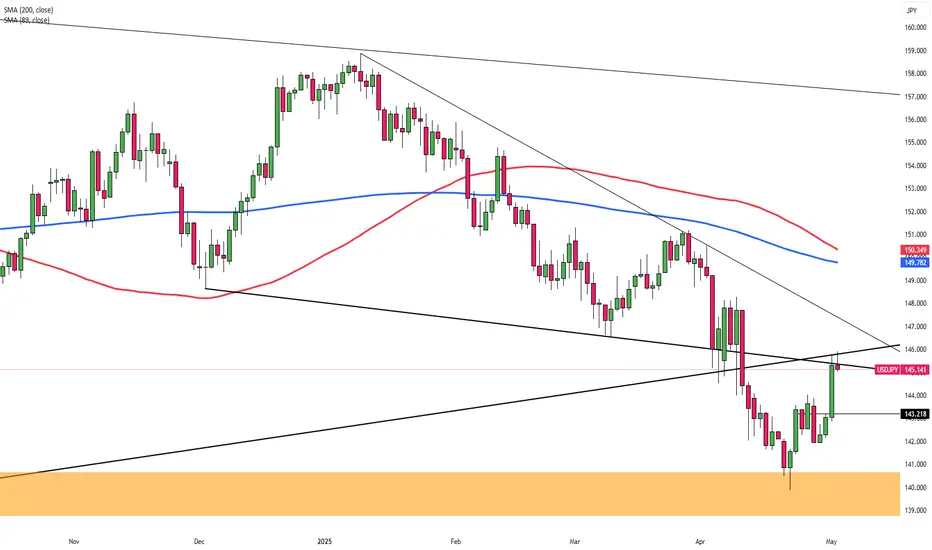
USDJPYOn the Daily timeframe.
Price reacted to the major zone and reversed upwards, correlating with the established bullish bias on the monthly/weekly timeframe.
Price has already broken the daily trendline and we will be heading to the 4hr timeframe for further confirmation.

Yen Near 146 as Trade Hopes WeighThe yen hovered near 146 per dollar Friday after a 1.6% drop, pressured by weaker safe-haven demand amid improving US-China trade prospects. China is open to talks after repeated U.S. outreach, while Japan and the U.S. wrapped up a second round of bilateral talks, aiming for a June deal. Domestically, Japan’s jobless rate rose to 2.5% in March, but the labor market stayed tight. The Bank of Japan held rates at 0.5% and cut its growth and inflation outlooks, signaling limited chances of near-term hikes.
Resistance is located at 145.90, followed by 146.75 and 149.80. On the downside, support levels are at 139.70, then 137.00 and 135.00.
Usd/Jpy 02-May-2025 AnalysisDisclaimer: easyMarkets Account on TradingView allows you to combine easyMarkets industry leading conditions, regulated trading and tight fixed spreads with TradingView's powerful social network for traders, advanced charting and analytics. Access no slippage on limit orders, tight fixed spreads, negative balance protection, no hidden fees or commission, and seamless integration.
Any opinions, news, research, analyses, prices, other information, or links to third-party sites contained on this website are provided on an "as-is" basis, are intended only to be informative, is not an advice nor a recommendation, nor research, or a record of our trading prices, or an offer of, or solicitation for a transaction in any financial instrument and thus should not be treated as such. The information provided does not involve any specific investment objectives, financial situation and needs of any specific person who may receive it. Please be aware, that past performance is not a reliable indicator of future performance and/or results. Past Performance or Forward-looking scenarios based upon the reasonable beliefs of the third-party provider are not a guarantee of future performance. Actual results may differ materially from those anticipated in forward-looking or past performance statements. easyMarkets makes no representation or warranty and assumes no liability as to the accuracy or completeness of the information provided, nor any loss arising from any investment based on a recommendation, forecast or any information supplied by any third-party.

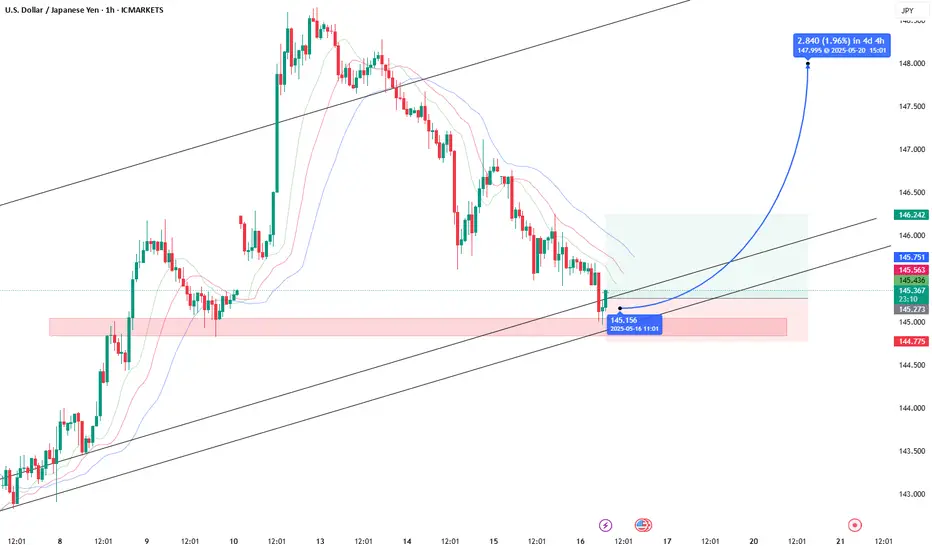
USD/JPY Eyes Breakout After Healthy Wave 4 CorrectionThe USD/JPY pair is currently unfolding a clean impulsive 5-wave structure to the upside. The price action has already completed Waves 1, 2, and 3, and has entered a probable Wave 4 correction.
Wave 3 appears extended and tapped into a key Fair Value Gap (FVG), which acted as resistance.
Wave 4 is likely to develop as a shallow retracement, possibly forming a bull flag or expanded flat before launching into Wave 5.
The ascending channel supports the bullish structure with both Wave 2 and Wave 4 respecting lower bounds.
Targets: 144.750 - 144.351
Stoploss: 146.268

USDJPY Repriced for a Better Short OpportunityIn my initial trade shared during the Asian session, USDJPY swept the sell-side liquidity and formed a clear Fair Value Gap (FVG). Price action has now provided a refined entry point for a continuation short setup.
The recent liquidity sweep, followed by displacement, suggests that the market may aim for the recent low — with the potential to push even further if bearish momentum continues. My short position is now aligned with this structure, and I’ll be watching closely for signs of continuation or rejection near key support levels.

BUY USDJPYThe pair
D1= is creating HH/HL
We waited to reach at the point of at least HL (it has reached 50 level of Fib in a 1D
If we observe fundamentally; yesterday the news pushed down the USD to accomplish the filling of the opening gap for this week.
Today at 0000+hrs the JPY has announced negative news to them.
The signal given is giving the probability of reversing to the upside.
Let us see the way it will behave.

USD looks performing against JPYUSD looks to be performing against JPY, I expect it to go up to 147-148
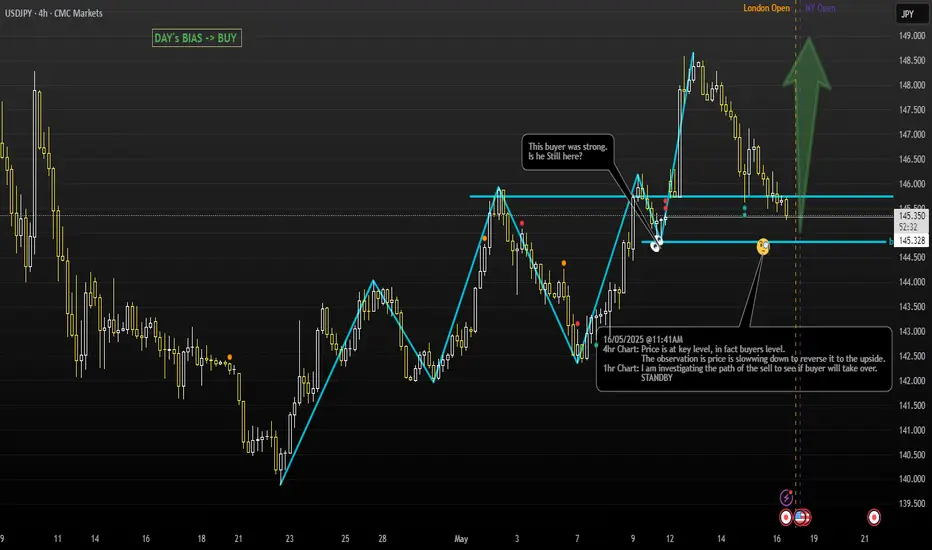
USDJPY - Potential Buy (Day Trading)Hi Traders,
Today we are BUYING CMCMARKETS:USDJPY intraday.
Price Action Analysis:
4hr Chart: Price is at a key level — buyer territory. It’s also starting to slow down, showing signs that sellers might be running out of strength.
1hr Chart: The selling trend is still intact. We’re watching for signs that buyers might be stepping back in.
Lower Time frame: Timing for Entry
Good Luck
Study, study, Study. Me :)
USDJPY - Potential Sell (Swing to long term Trade)Hi traders,
This is a repost from my last analysis.
We are still focusing to SELL CMCMARKETS:USDJPY
Price Action Analysis:
Weekly or higher Chart: Price seems to be slowing down and showing signs of turning to the downside. Buyers have tried several times to push up from the 140.0 level, but each time, sellers responded with more selling. It feels like sellers are still holding a lot of CMCMARKETS:USDJPY and are trying to offload it.
Daily Chart: Price has been making new highs, which is actually a good sign for a potential sell-off. We’re watching to see if the daily chart shows signs of giving up. However, price is still in buyer territory, so we’re on standby for now.
Lower time frame Chart: Timing for Entry
Good Luck.
"The most important investment you can make is in yourself." Warren Buffet

USDJPY BuyThe USD/JPY pair is showing strong bullish momentum, and all signs point to a continued move higher in the near term.
📈 Key Drivers Supporting USD/JPY Upside:
Interest Rate Divergence – The Federal Reserve remains hawkish, while the Bank of Japan continues its ultra-loose monetary policy. This widening rate differential favors USD strength.

USDJPY – Potentially More Volatility AheadUSDJPY experienced a significant move higher at the end of April/beginning of May, as first, the Bank of Japan (BoJ) started to indicate caution towards further interest rate hikes due to the uncertainty caused by the introduction of President Trump’s trade tariffs, a potential negative for the JPY. This was followed by dollar demand linked to Monday’s announcement by US and China trade representatives of a significant de-escalation of tariffs on imports from each country for a 90 day period.
This upside squeeze saw USDJPY trade from a low of 139.89 on April 22nd to a high of 148.65 on Monday May 12th, as FX traders were forced to pare back weak short positions as short term upside resistance levels were broken.
Since then, however, the rally has come to an abrupt halt with USDJPY falling to a low of 145.60 on Wednesday, with a potential catalyst for this drop being a news report outlining currency policy discussions between US and South Korean governments at the start of May which may have led to increased speculation that President Trump’s administration may be open to a weaker dollar.
Looking forward, this pick up in USDJPY volatility may not be finished as traders now have to digest 2 scheduled events today and one overnight that may impact where this popular currency finishes the week.
The first 2 events, includes the earnings and forward guidance from the US retail colossus Walmart (due today before the open) and US Retail Sales data (1330 BST today), which will provide FX traders with an important update on the current appetite of US consumers to spend through the recent trade war upheaval.
Then, overnight the Japanese Preliminary Q1 GDP growth update is due at 0050 BST (Friday). This release could either support the current BoJ caution over further rate hikes, or lead to a potential resurgence of market rate hike expectations, if it comes in stronger than anticipated, with knock on implications for USDJPY volatility into the weekend.
Technical Update: Being Prepared For Further Volatility
It has certainly been an impressive rally in USDJPY, with traders perhaps focusing on the recent close above 145.92 as a potential positive. This level was equal to the May 2nd session high, which might be viewed by some, as opening further attempts to extend recent price strength.
However, within financial markets, psychological round numbers in price can influence trader sentiment, meaning as impressive as latest upside may appear, it might still have to close above 150.00, equal to the round price number evident just above recent activity.
What if the 150.00 resistance holds and fresh weakness emerges?
This week’s activity has so far, seen a price high established at 148.65, posted on Monday, which coupled with the 150.00 psychological resistance, may be an area traders could be focusing on as next possible resistance. They may feel, this 148.65/150.00 range could continue to hold price strength, even attract selling pressure.
A pattern for USDJPY activity in 2025, has been attempts at price strength failing under the previous recovery price highs, as indicated by the pattern of lower highs since the January 10th upside extreme, highlighted on the chart below.
It is far too early to say if this is the case again, but the 38.2% Fibonacci retracement of April to May price strength, which stands at 145.31, might prove an important support.
If this 145.31 level were to give way on a closing basis, it could point to a possible phase of more extended declines, and potential weakness towards 144.28, the deeper 50% level, even 143.24, the 61.8% retracement.
What if 145.31 Support Holds?
If the 145.31 support holds current price weakness, it could be argued, the 148.65/150.00 range is a resistance area we should perhaps watch on a closing basis, if it is challenged over coming sessions.
While not a guarantee of a more sustained phase of price strength, if closes above 148.65/150.00 were to materialise, traders might then look for potential to test higher resistance levels.
Focus could for instance then turn towards tests of the next price failure high, which is represented by 151.21, posted on March 28th 2025, possibly further if this in turn gives way.
The material provided here has not been prepared in accordance with legal requirements designed to promote the independence of investment research and as such is considered to be a marketing communication. Whilst it is not subject to any prohibition on dealing ahead of the dissemination of investment research, we will not seek to take any advantage before providing it to our clients.
Pepperstone doesn’t represent that the material provided here is accurate, current or complete, and therefore shouldn’t be relied upon as such. The information, whether from a third party or not, isn’t to be considered as a recommendation; or an offer to buy or sell; or the solicitation of an offer to buy or sell any security, financial product or instrument; or to participate in any particular trading strategy. It does not take into account readers’ financial situation or investment objectives. We advise any readers of this content to seek their own advice. Without the approval of Pepperstone, reproduction or redistribution of this information isn’t permitted.

USD/JPY LONGPull back again to donchian channel. Red arrows show previous pull backs to continue its bullish momentum and pivot.

CHECK USDJPY SIGNAL READ CAPTAINusdjpy signal technical analysis satup 👇🏼
(usdjpy) buy zone
( TRADE SATUP)
ENTRY POINT (145.900) to (145.800) 📊
FIRST TP (146.250)📊
2ND TARGET (146.800) 📊
LAST TARGET (147.300) 📊
STOP LOOS (145.300)❌
FALLOW RISK MANAGMENT

USDJPY to continue uptrendUSDJPY is forming has broken out of the downward channel and formed a new upward channel/trend. Expect a break of the trendline around 145.850 and continue upward from area
of support to resistance zone/are of interest at 150.734. This resistance area extends all the way back to 10/2023 and appears quite strong. The 1h chart is also showing a potential crossover of the RSI/RSI EMA. The ADX is falling, the DMI is divergent. The MACD is divergent and downward momentum is slowing.
15/5/2025 0226 PDT

Uptrend targetsUSD/JPY filled the May 10–11 gap and is now showing signs of a bullish bounce from the 145.36 zone. Buyers are testing higher, but 146.50 remains key resistance. A break above could open room toward 147.50, while failure may trigger another drop. Price is currently neutral-bullish; wait for confirmation before entering.
